


In this article, BeInCrypto takes a look at eight altcoins that decreased the most over the past seven days (March 26 – April 2).
This week’s hateful eight altcoins are:
- AscendEX Token (BTMX) – 23.67%
- Pundi X (NPXS) – 13.39%
- SwissBorg (CHSB) – 10.54%
- THETA (THETA) – 8.52%
- Harmony (ONE) – 3.11%
- Voyager Token (VGX) – 1.80%
- Celer Network (CELR) – 1.31%
- Ravencoin (RVN) – 0.17%
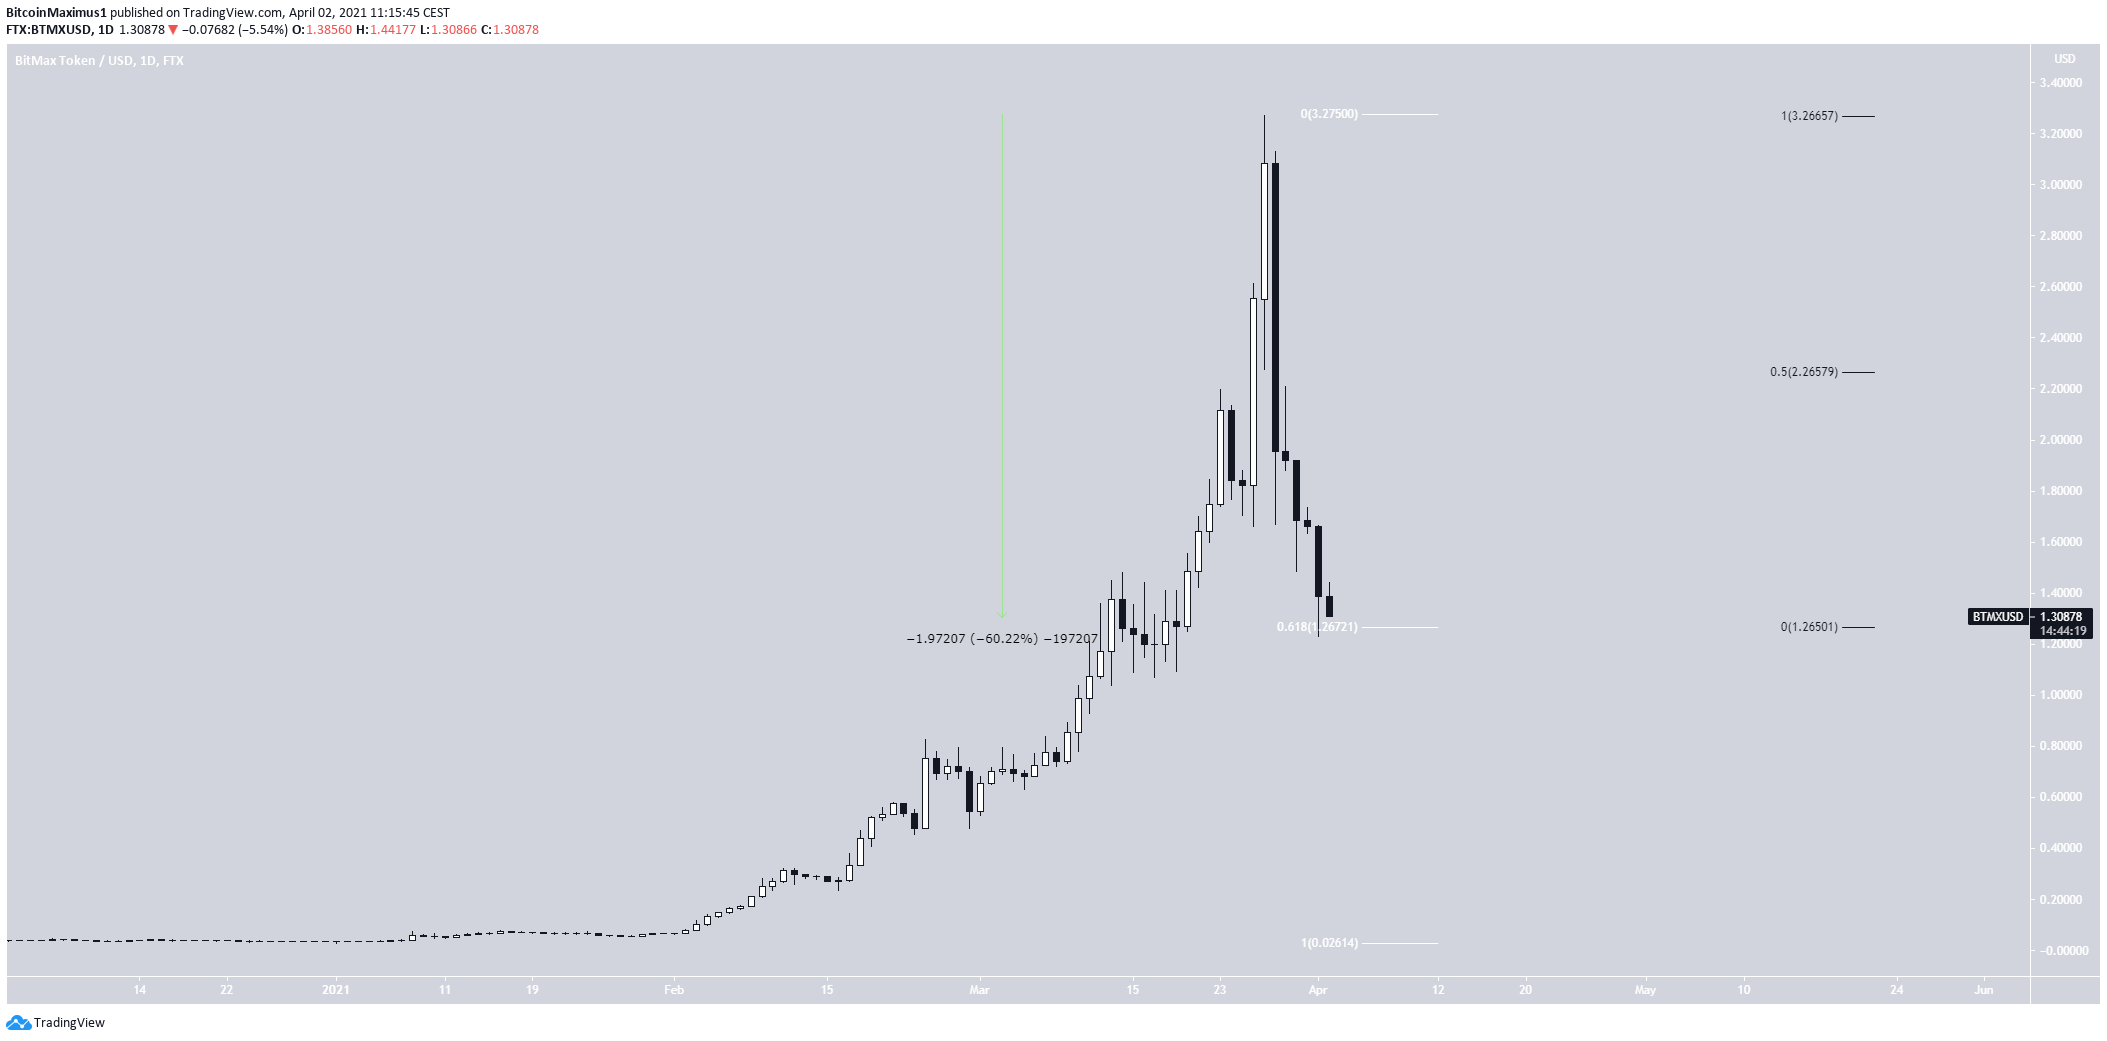
BTMX
BTMX has been decreasing since March 27 when it reached an all-time high price of $3.27. Since then, it has dropped by 60%.
Despite the sharp drop, BTMX has reached a significant support level at $1.27. It’s both a horizontal support and the 0.618 Fib retracement of the entire upward move.
This is a likely area for a bounce, which could take BTMX towards the 0.5 Fib retracement resistance at $2.33.
Nevertheless, the shape of the decrease makes it likely that this is the beginning of a new bearish impulse, which means that the upward movement has ended.
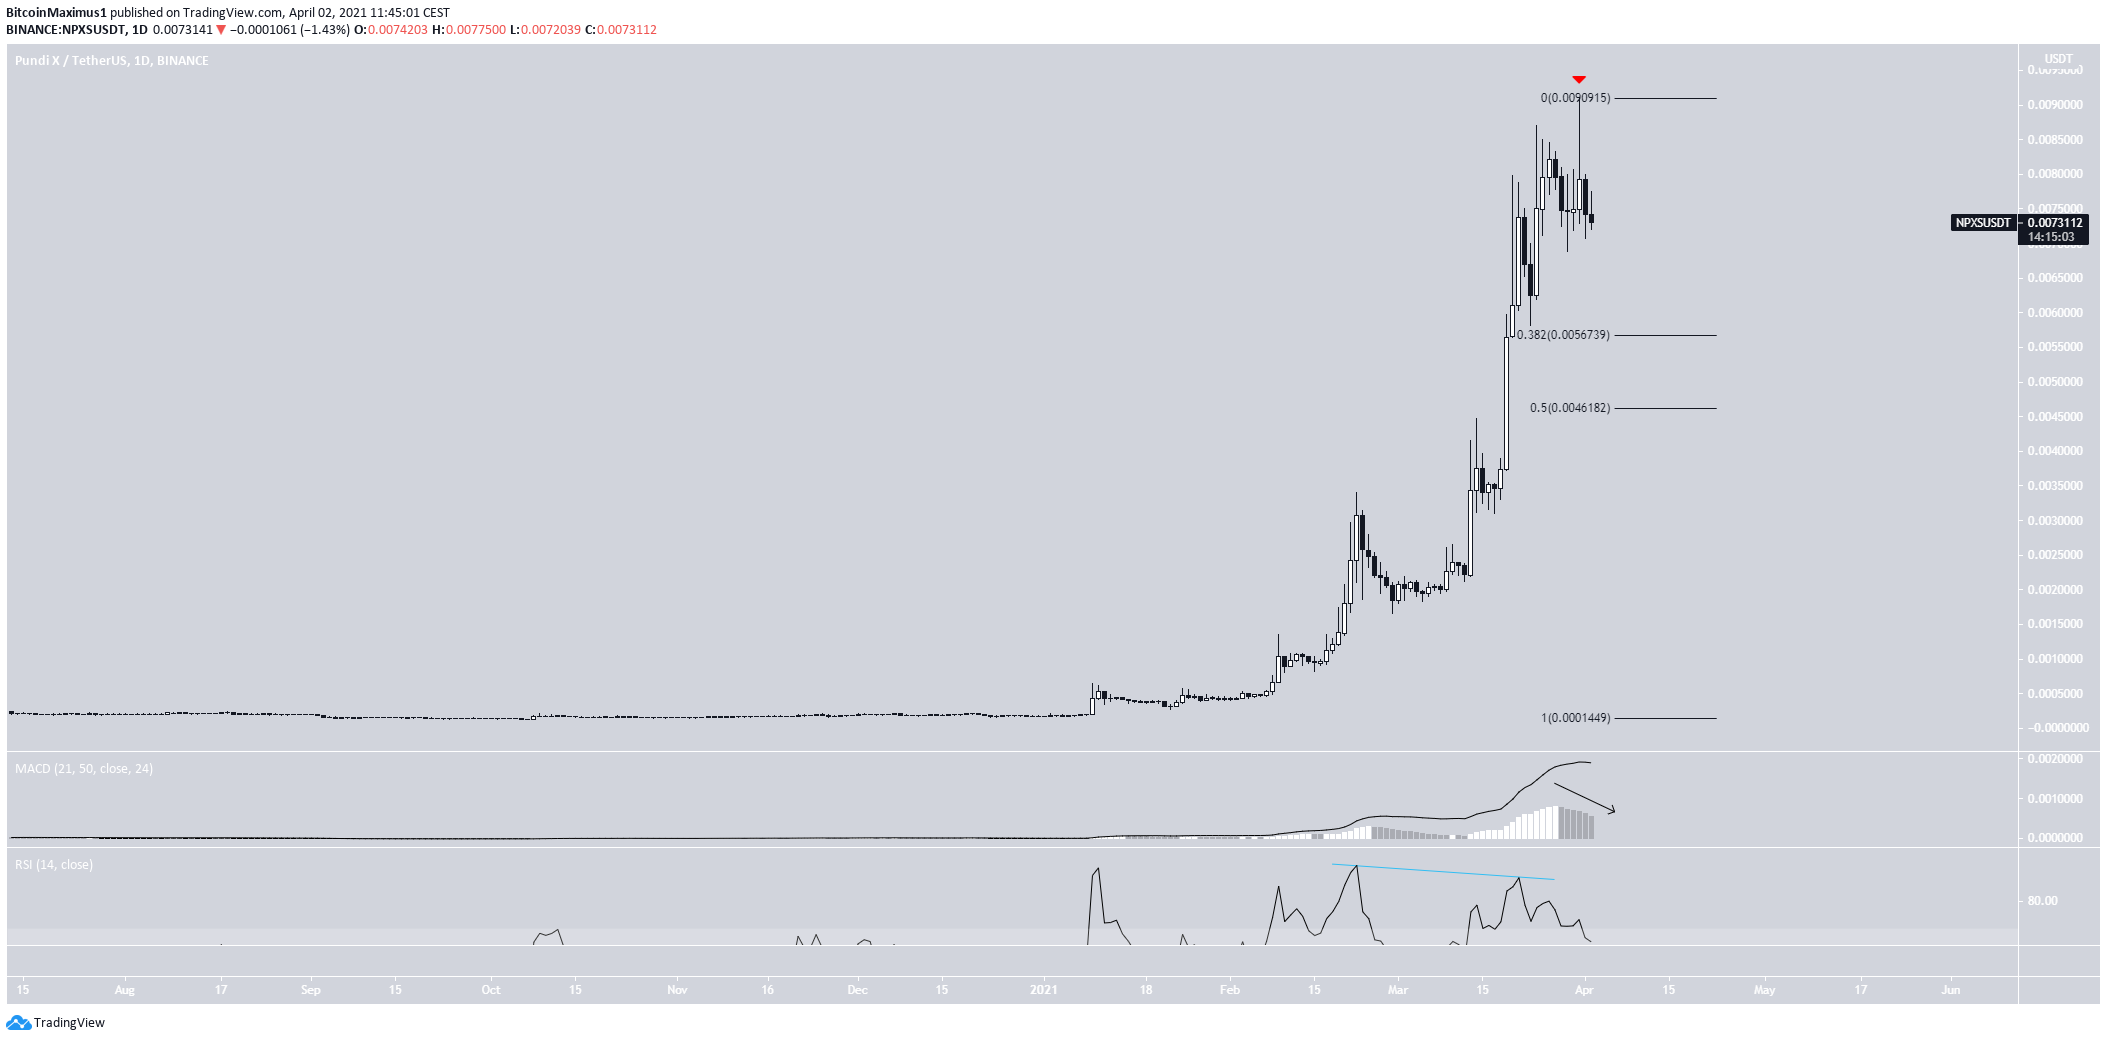
NPXS
On March 31, NPXS reached a high of $0.009. However, it created a shooting star candlestick, a common sign of a trend reversal.
In addition, this high was combined with a bearish divergence in the RSI, and the MACD is decreasing.
When combined with the previously parabolic rate of decrease, this is a potential sign that the trend has ended.
If this is true, the next support levels would be found at $0.0056 and $0.0046.
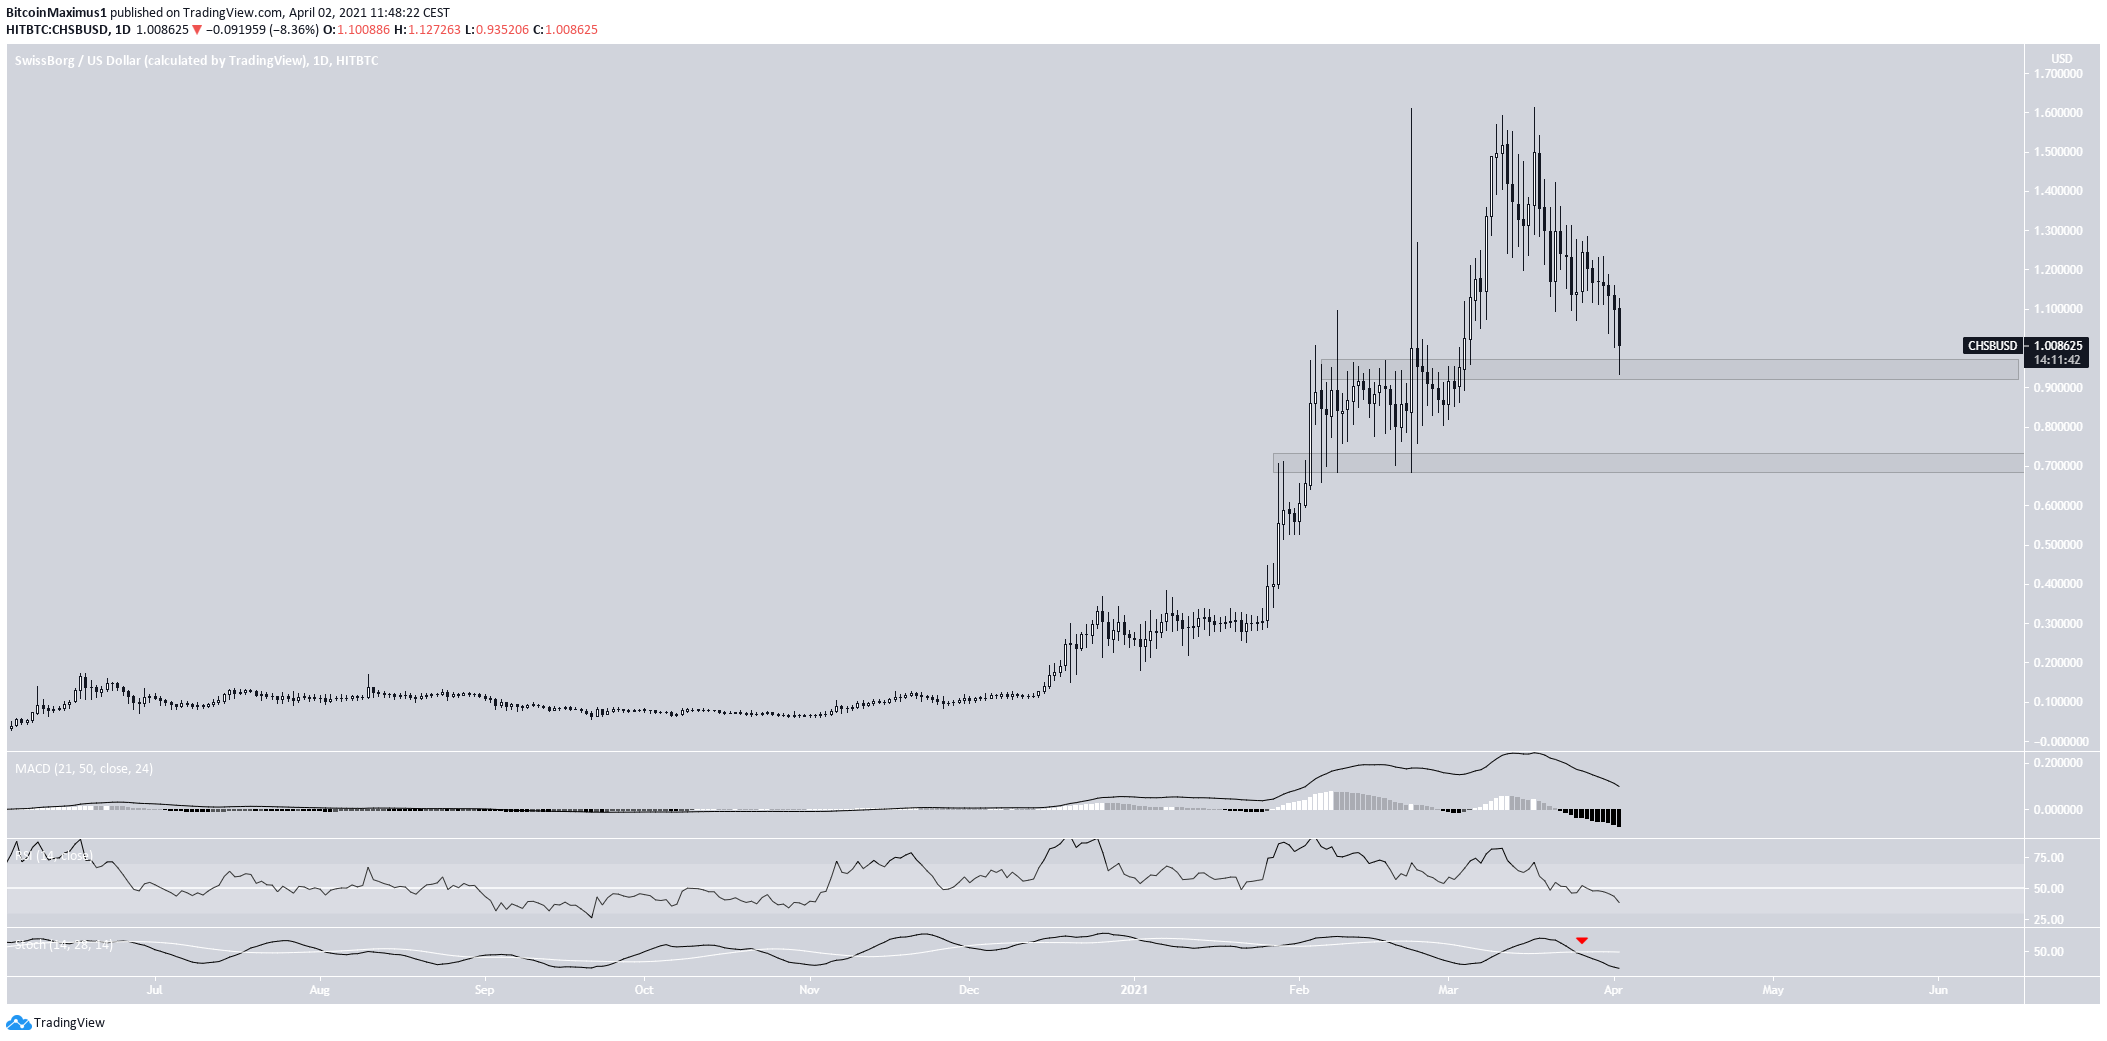
CHSB
CHSB has been moving downwards since March 17 when it reached a high of $0.161. The drop has taken it to the support area at $0.91.
While this is a strong support level, technical indicators have turned bearish.
The MACD is negative, the RSI has crossed below 50, and the Stochastic oscillator has made a bearish cross.
It’s possible that CHSB will decrease to the next support level at $0.76 but a short-term bounce is likely prior to the breakdown.
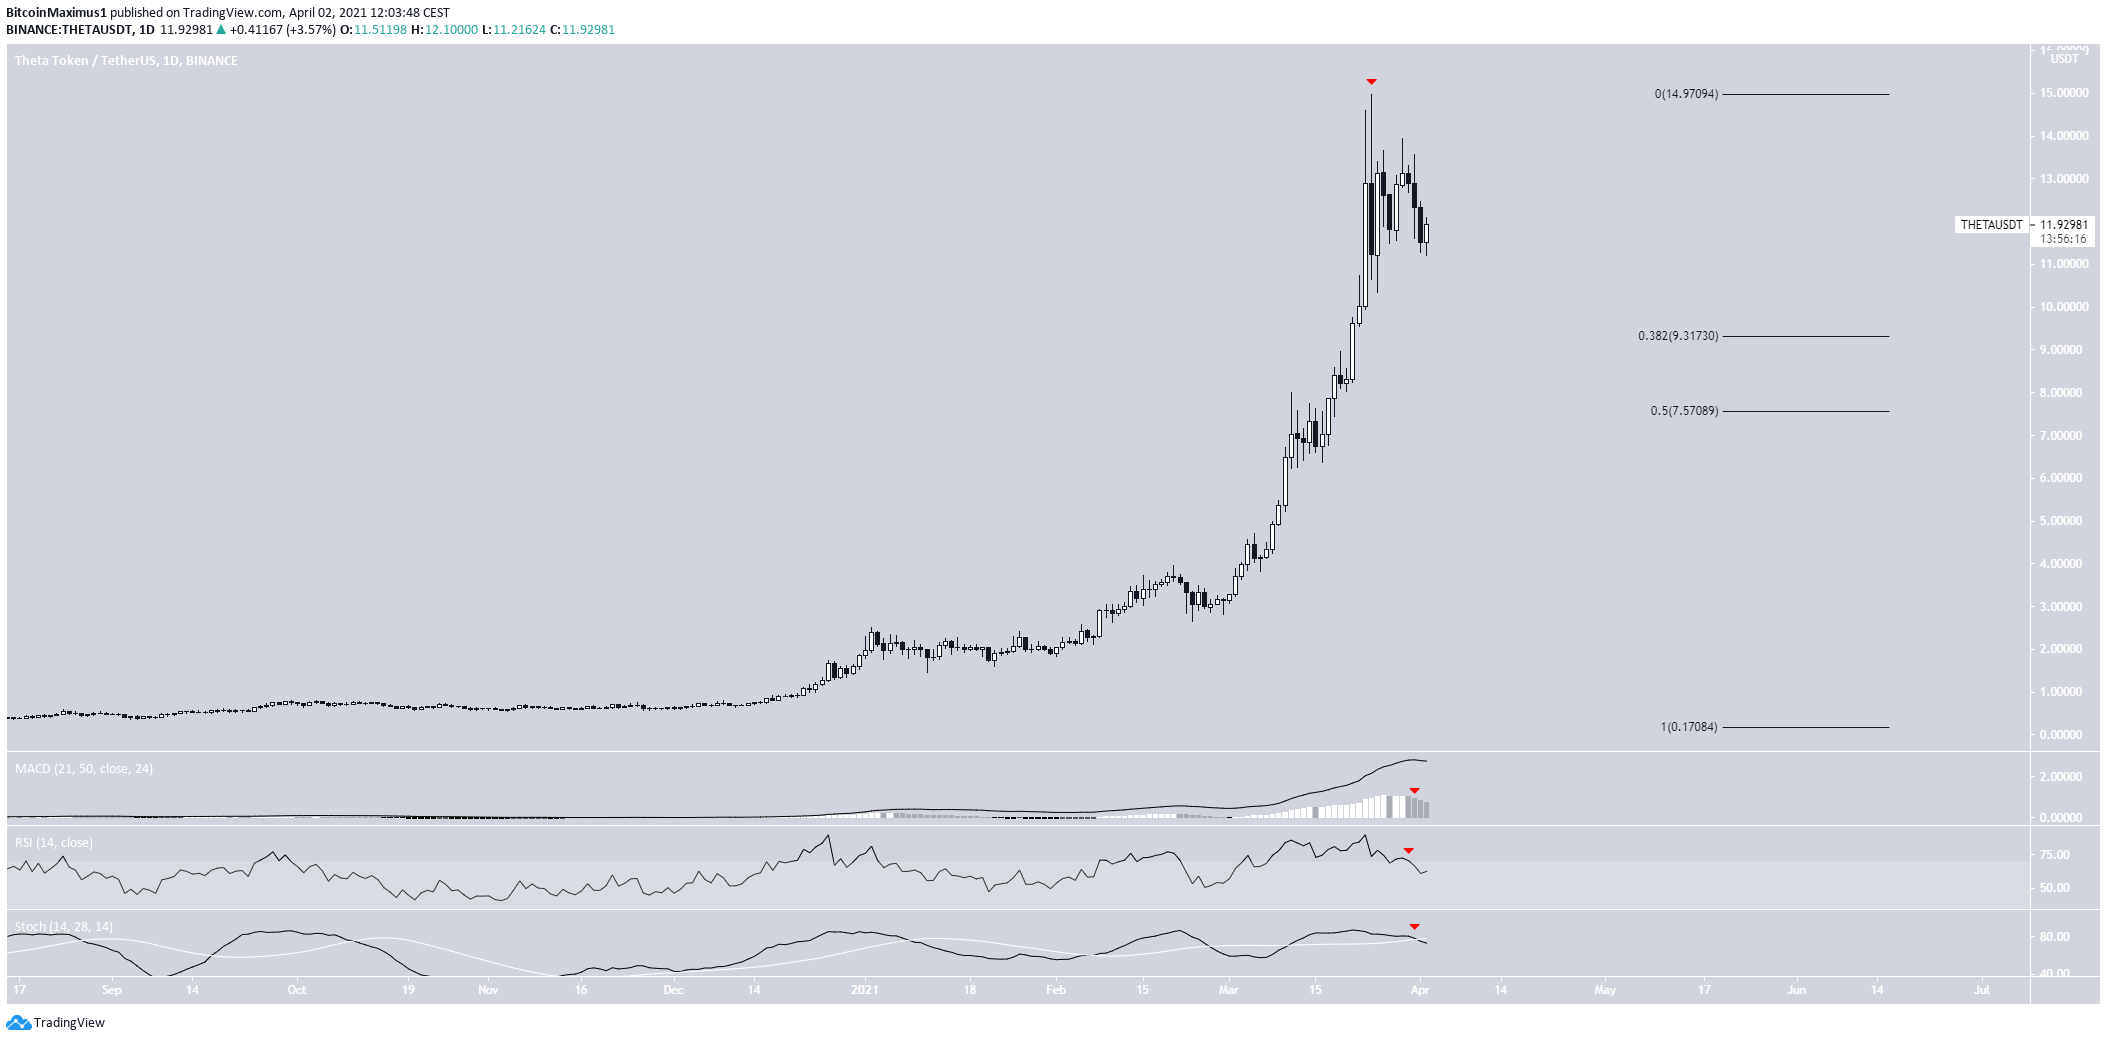
THETA
On March 24, THETA reached an all-time high price of $14.96. However, it created a long upper wick the same day and decreased considerably.
While it has made a few attempts at moving upwards, they have been weak. In addition, technical indicators have turned bearish, similar to CHSB.
The rate of increase is completely parabolic. When combined with the bearishness from technical indicators, it’s possible that THETA has reached the top of its bullish cycle.
In any case, some type of retracement is expected. The closest support levels are found at $9.31 and $7.51.
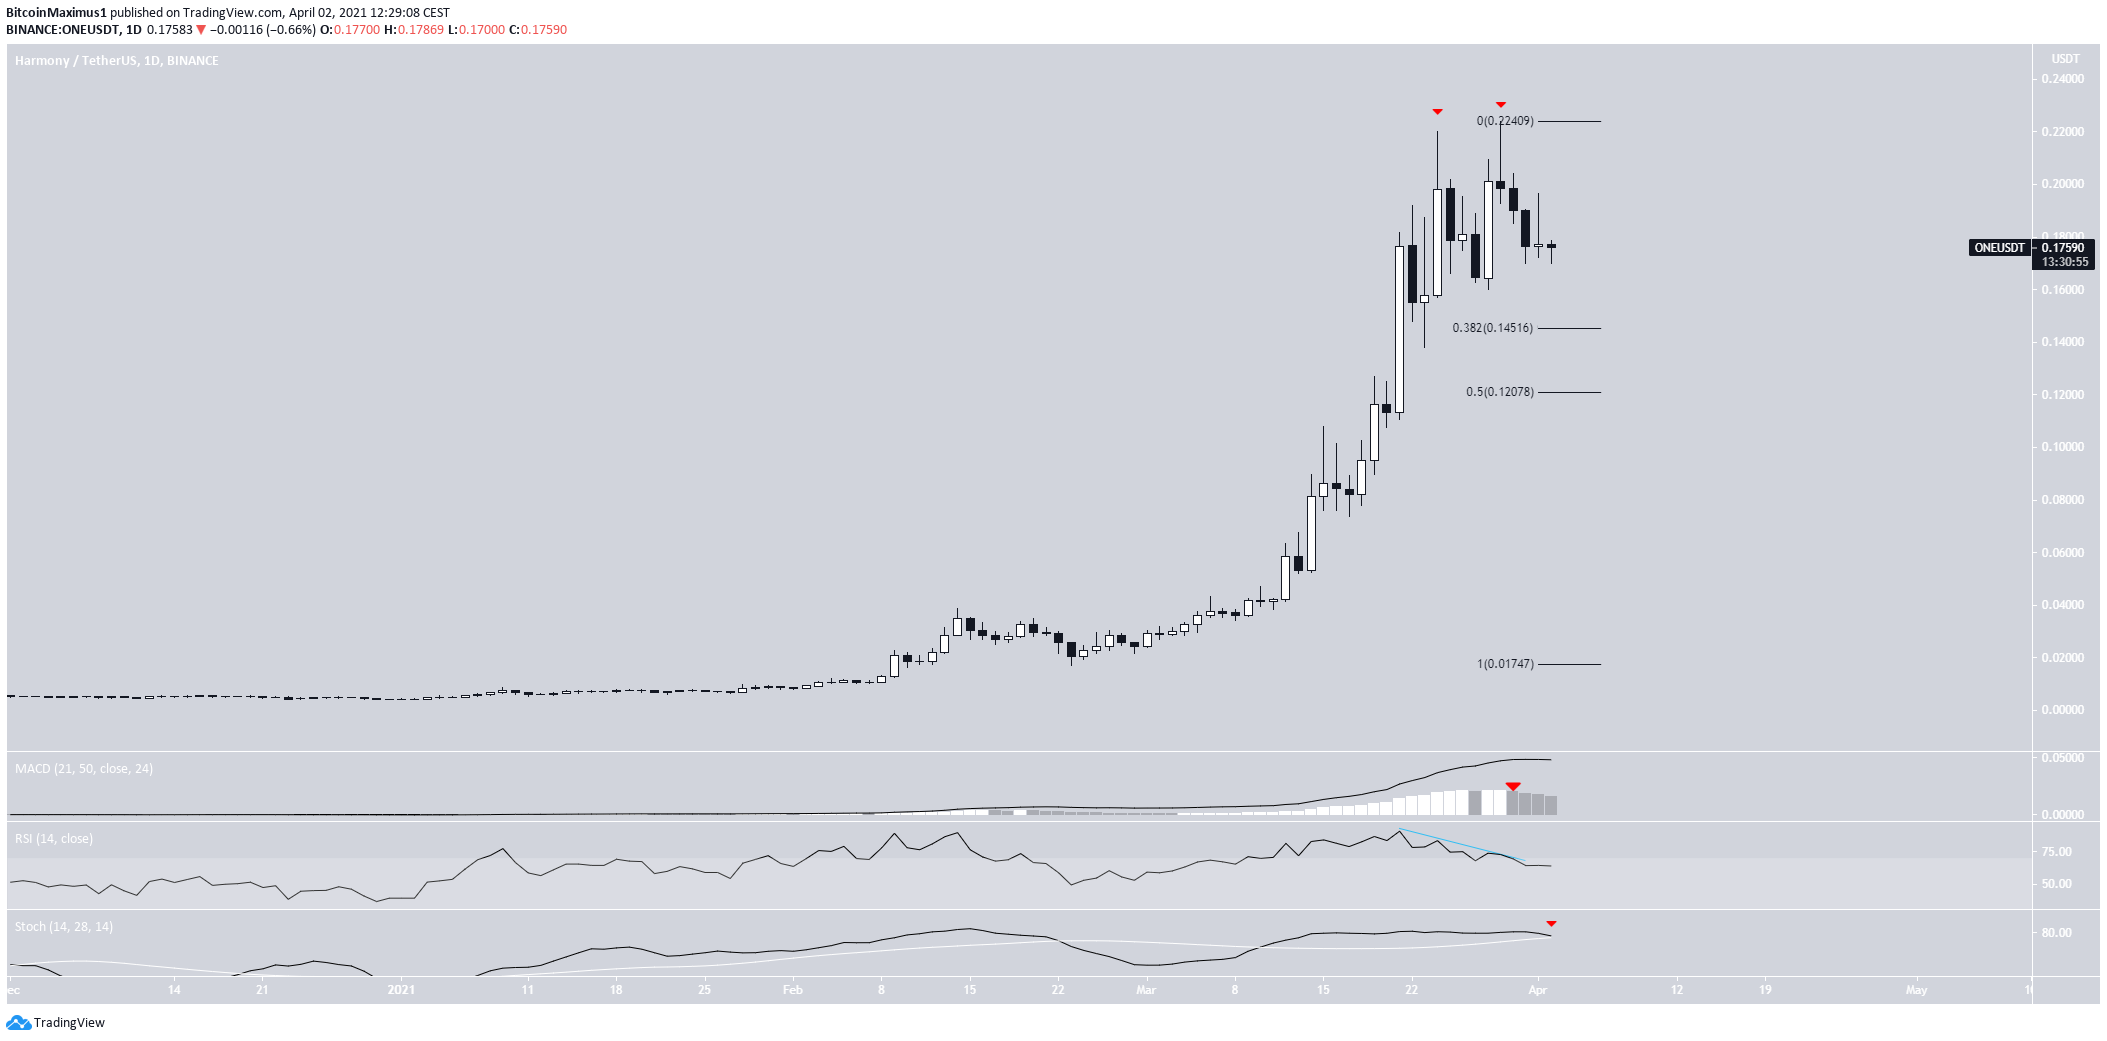
ONE
On March 24, ONE reached a high of $0.22 before decreasing. It proceeded to reach an all-time high of $0.224 on March 29, but created a shooting star candlestick.
These highs were combined with a bearish divergence in the RSI. In addition, the MACD has given a bearish reversal signal. Finally, the Stochastic oscillator has made a bearish cross.
Therefore, it’s likely that ONE decreases towards support at $0.145 and could potentially even dip back $0.12.
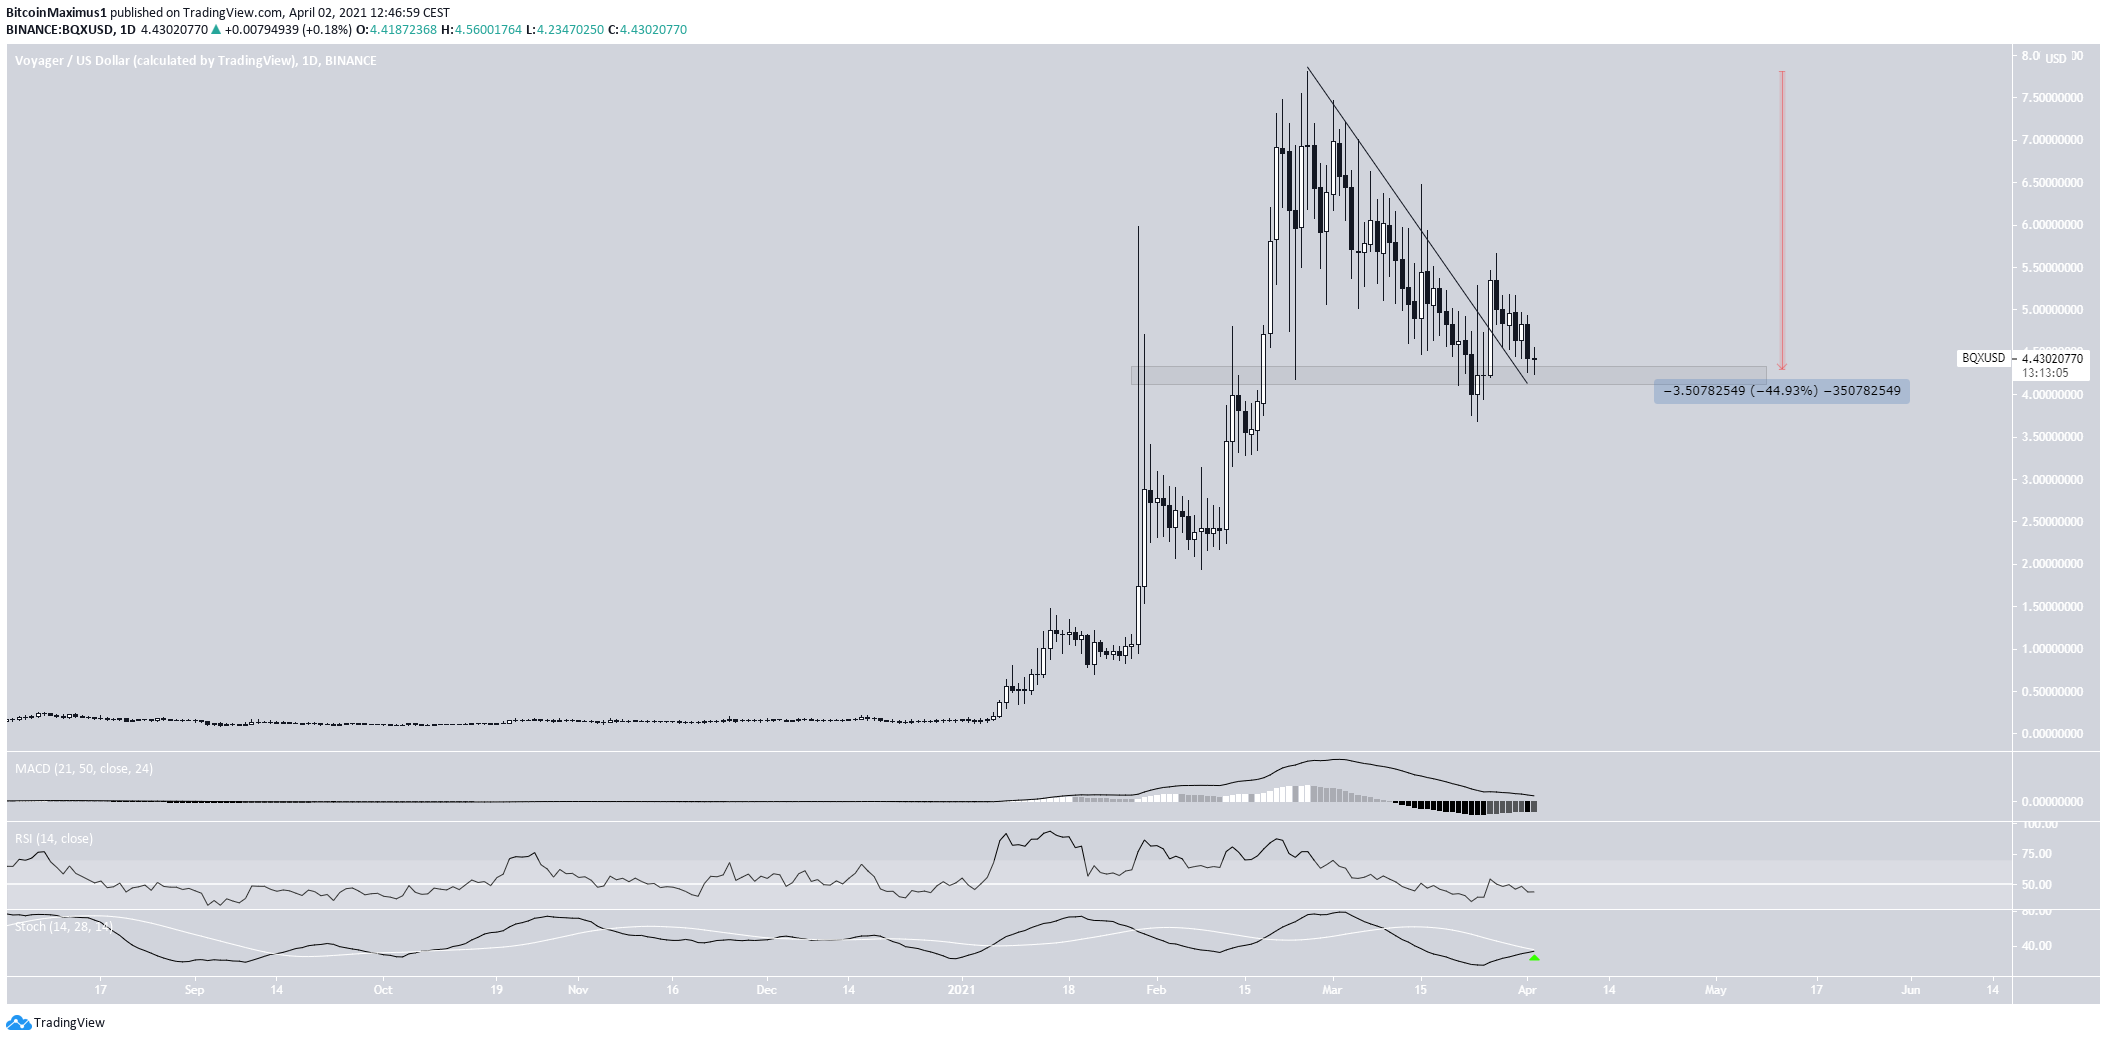
VGX
VGX has been decreasing since Feb. 25 when it reached a high of $7.81. The decrease has measured 45% and has taken VGX to the $4.25 support area.
After deviating below it, VGX reclaimed the area and broke out from a descending resistance line.
Technical indicators have begun to turn bullish, as evidenced by the potential bullish cross in the Stochastic oscillator.
Therefore, it’s possible that VGX will increase towards a new all-time high price.
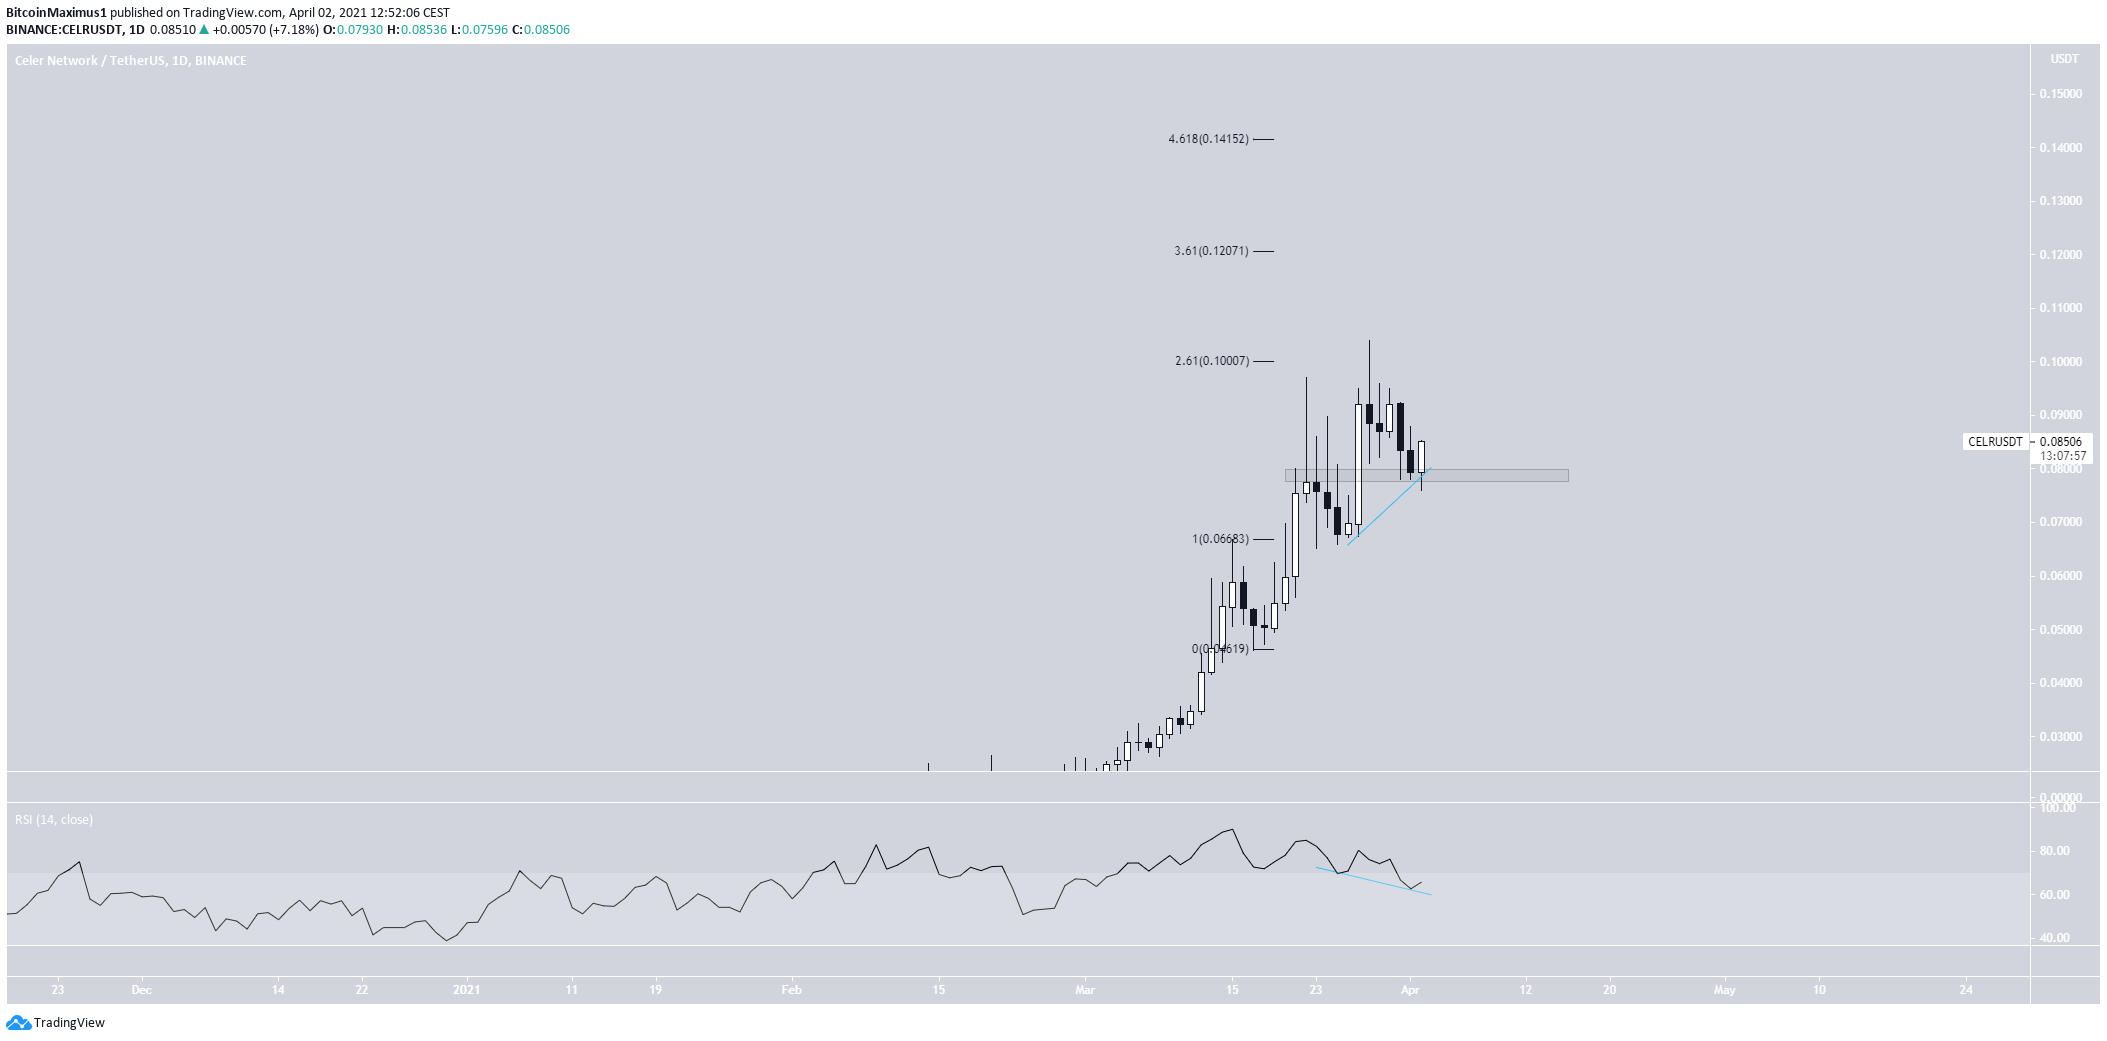
CELR
On March 22, CELR reached a then all-time high price of $0.092. This created a shooting star candlestick and the token began to decrease.
However, on March 27, CELR created a bullish engulfing candlestick, and reached another new all-time high price of $0.1034 the next day.
The token is currently bouncing at the $0.078 support area.
The RSI has generated a hidden bullish divergence — a strong sign of trend continuation.
If CELR continues increasing, the next resistance area would likely be found at $0.12
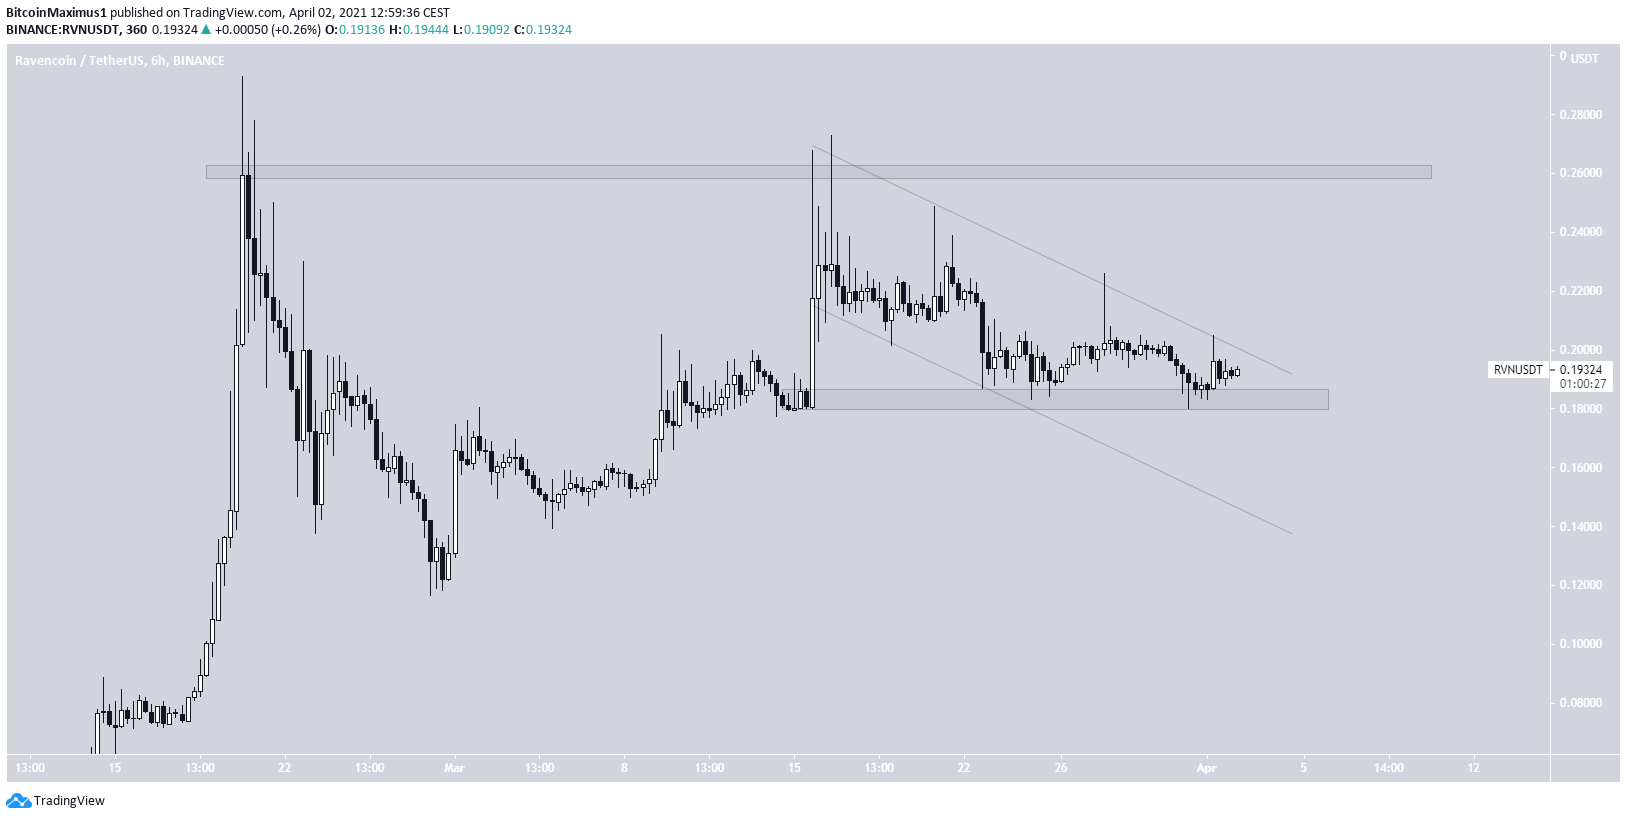
RVN
RVN had been moving upwards since bouncing on Feb. 28. It reached a high of $0.272 on March 16 and has been retracing since.
Currently, RVN is trading just above support at $0.0184, potentially being in a parallel channel.
A breakout from this channel is likely, which could take RVN back to the $0.26 resistance area.
For BeInCrypto’s latest bitcoin (BTC) analysis, click here.


