


The Graph (GRT) has broken out from two short-term resistance levels but is still trading below an important long-term resistance.
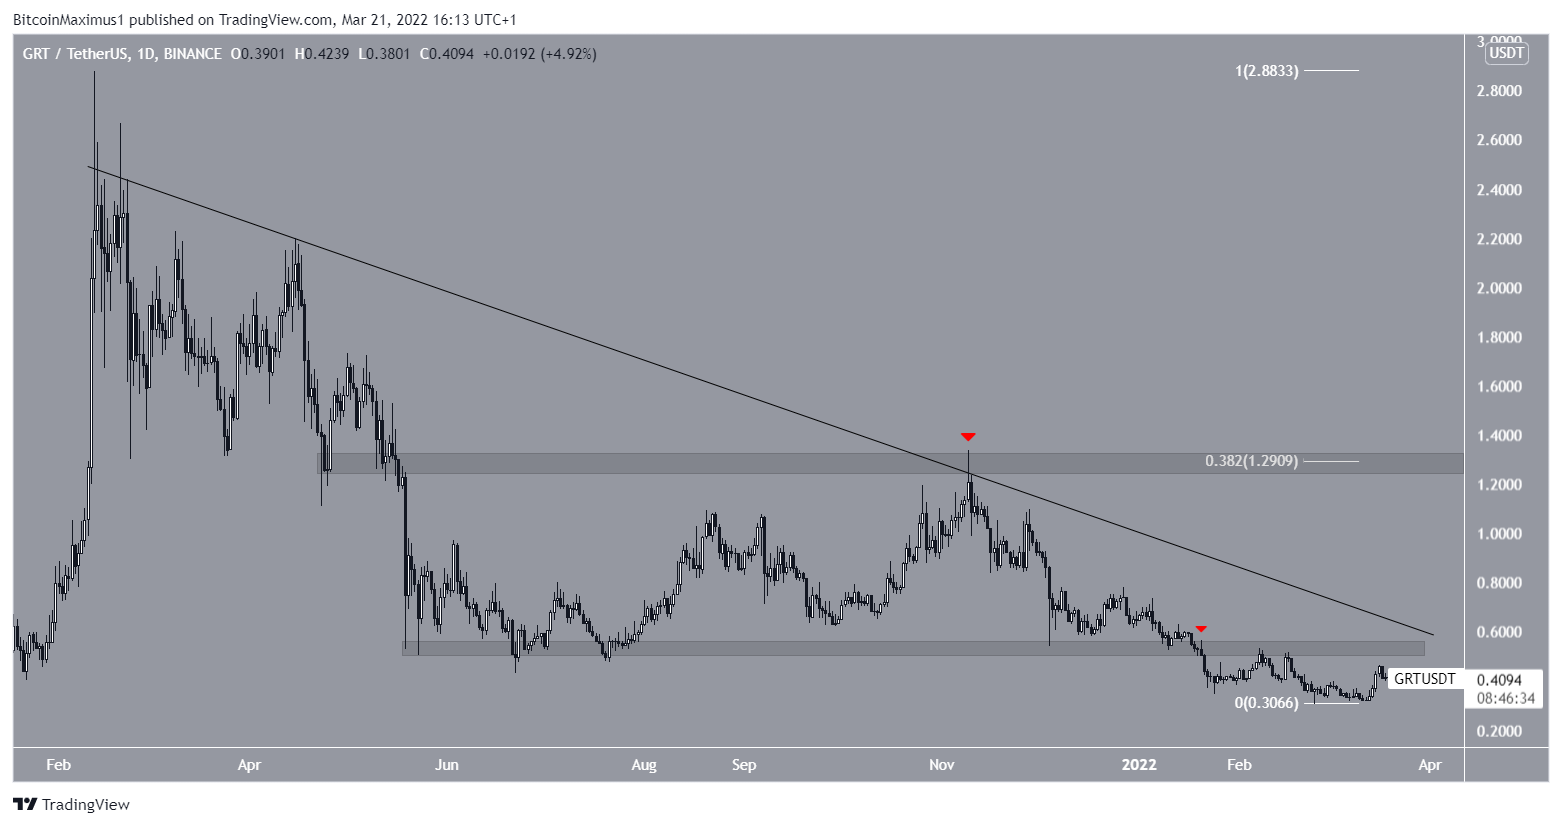
GRT has been falling since reaching an all-time high price of $2.88 on Feb 12. While it is possible that the downward movement is developing underneath a descending resistance line, its slope is not clear due to the presence of numerous long upper wicks.
However, it is clear that GRT has fallen below the $0.54 horizontal area. The area had acted as support in May but then turned to resistance once GRT broke down below it on Jan 20 (red icon). Currently, it coincides with the aforementioned descending resistance line, making it a crucial resistance level. Until GRT manages to break out, the trend cannot be considered bullish.
If GRT breaks out, the closest resistance would be at $1.29. This is the 0.382 fib retracement resistance level and a horizontal resistance area that was most recently validated on Nov 2021 (red icon).
Ongoing short-term increase
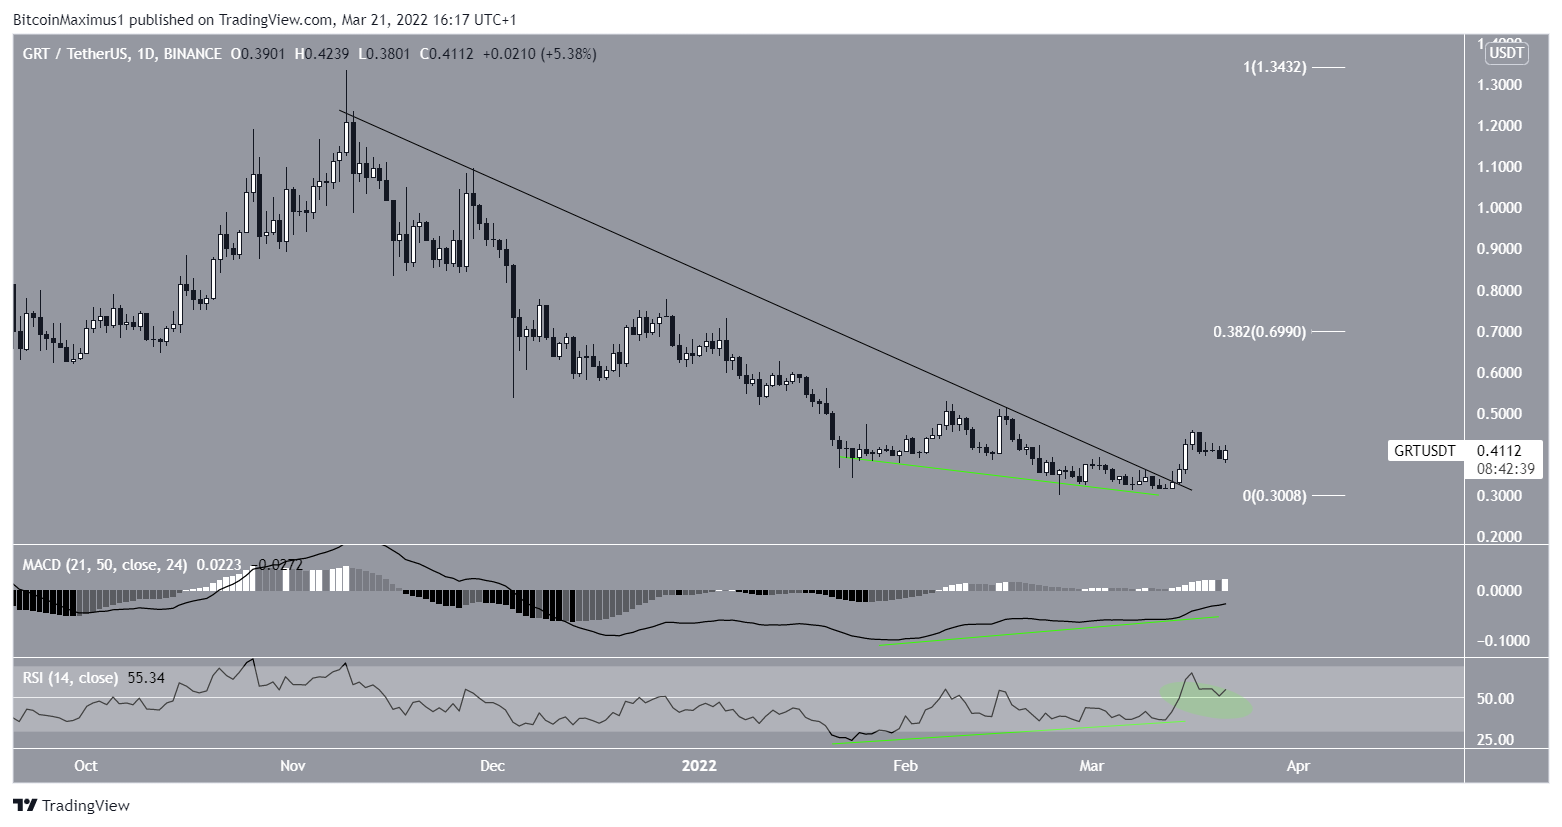
Despite the seemingly bearish price action, technical indicators in the daily time-frame are bullish. This is especially evident by the bullish divergences that have formed in both the RSI and MACD (green lines).
More importantly, the RSI has already moved above 50. The RSI is a momentum indicator and readings above 50 are considered bullish. In addition to this, the MACD is nearly positive, another sign of a bullish trend.
Furthermore, GRT has already broken out from a shorter-term descending resistance line, signaling the beginning of an upward movement.
If the move continues, the closest resistance would be at $0.70. This is the 0.382 fib retracement resistance level and a horizontal resistance area.
Short-term GRT movement
Cryptocurrency trader @rutradebtc tweeted a chart of GRT, and said it could be in the process of initiating a significant reversal.
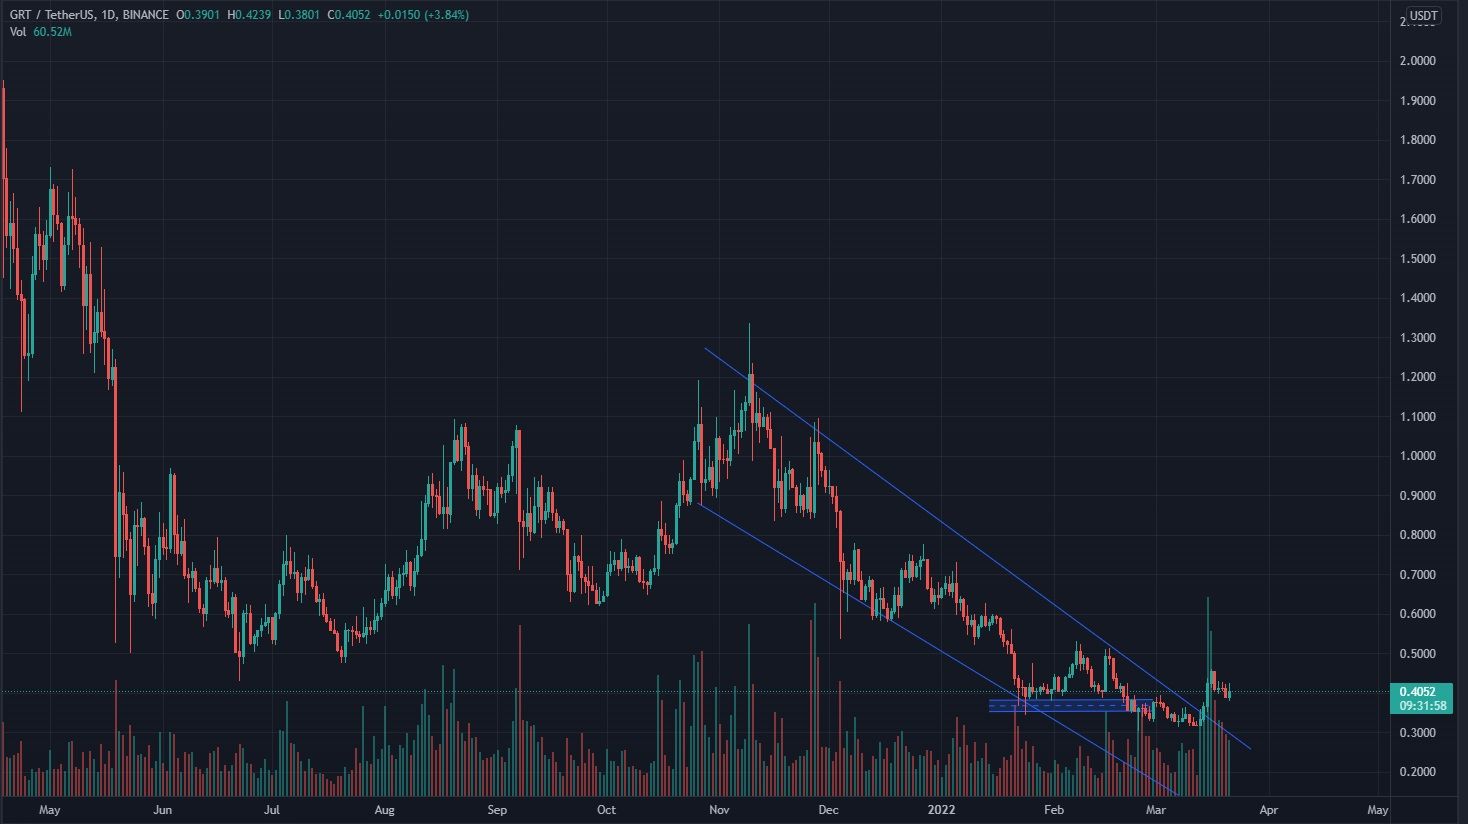
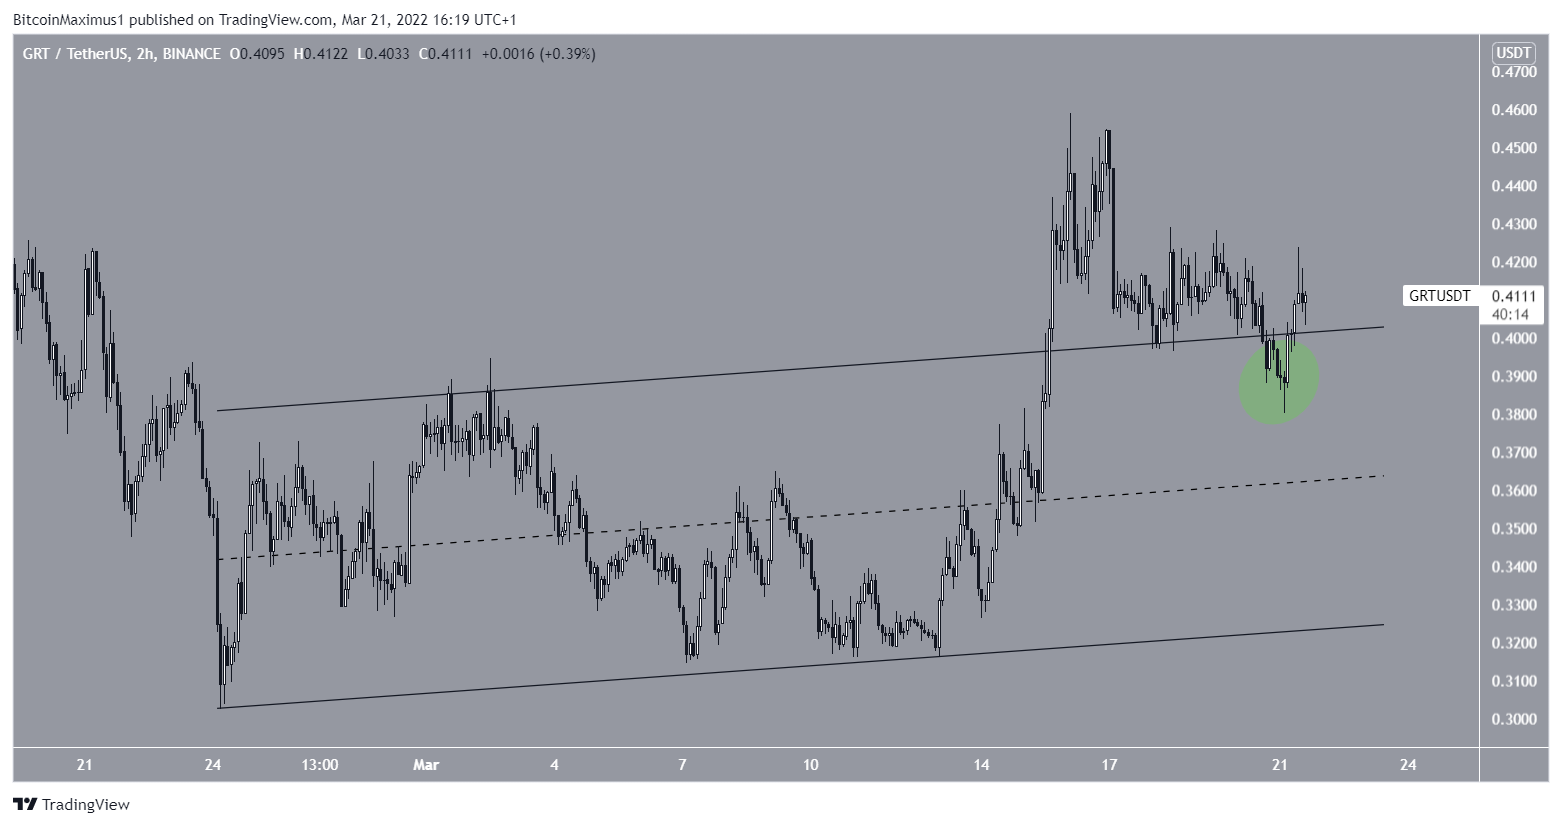
Since the tweet, GRT has broken out from an ascending parallel channel.
While it initially deviated below it (green circle), it has reclaimed its resistance line since.
In order for the upward movement to continue, GRT has to hold above this line.
A breakdown inside the channel would indicate that the upward movement is corrective and will likely not lead to new highs.
For BeInCrypto’s latest Bitcoin (BTC) analysis, click here


