


Beginning on January 7, the Ethereum price has increased by 12%. This increase caused it to reach the long-term resistance line in place for slightly more than a year.
A breakout above this line could be considered a confirmation that the downward trend is over and a new, bullish market cycle has begun.
In lower time-frames, technical analyst Loma posted an Ethereum price chart along with a long trade setup, with a target of ₿0.02 and a stop loss at ₿0.0183.
$ETH pic.twitter.com/kD1oLQDAMO
— Loma (@LomahCrypto) January 16, 2020
Will the Ethereum price reach the target or will it trigger the stop loss instead? Keep reading below and find out.
Long-Term Resistance
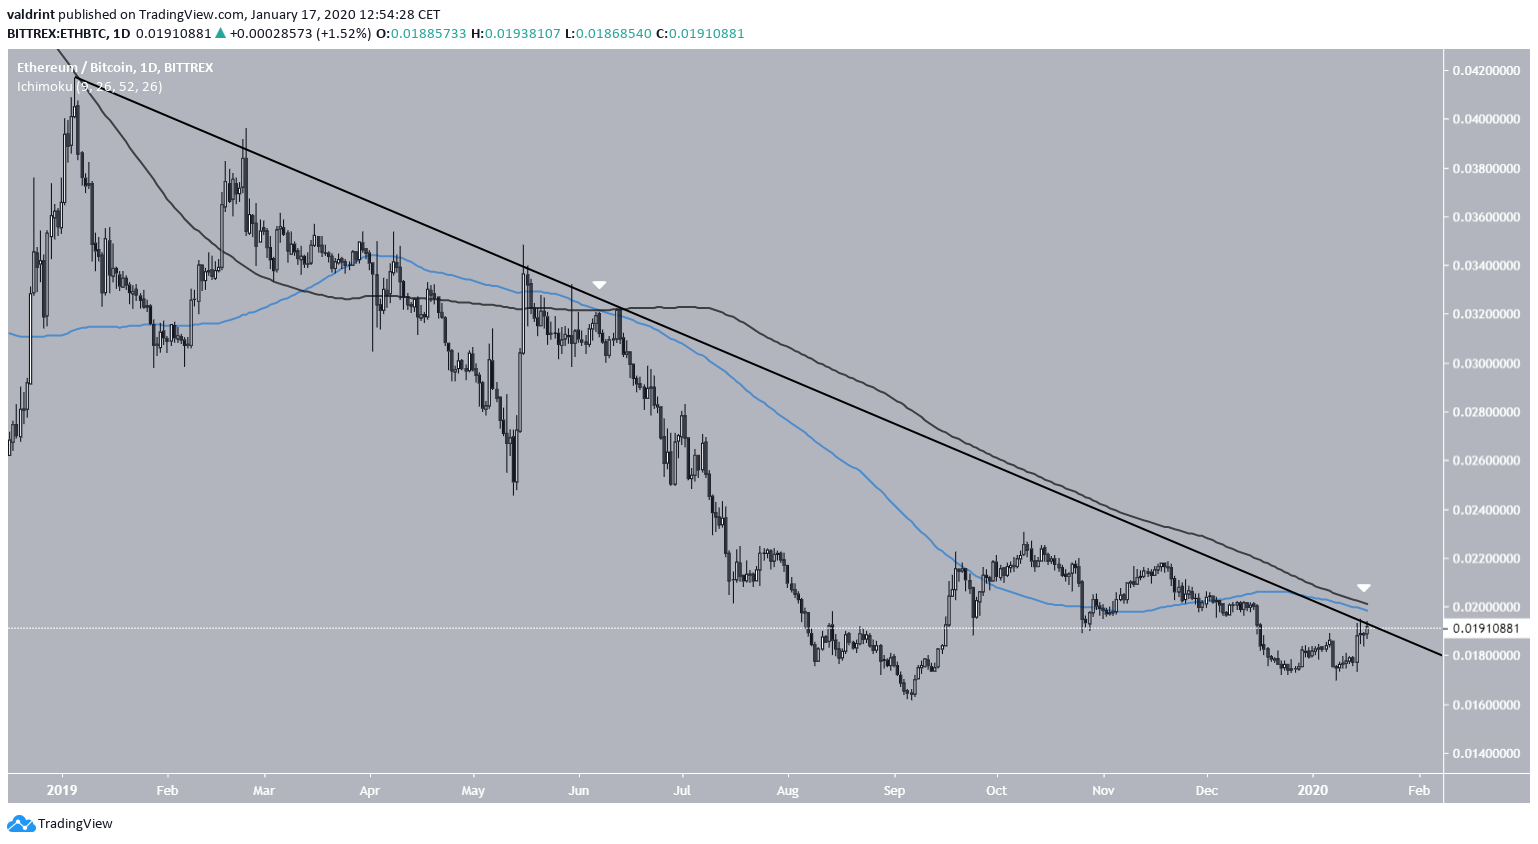
Most importantly, the Ethereum price has been following a long-term resistance line for slightly more than a year, more specifically since January 5, 2019.
At the time of writing, it was trading right at this resistance line and had yet to initiate a breakout.
The significance of this line is strengthened by the presence of the 100- and 200-day moving averages (MA), which have previously made a bearish cross and are trading right above this resistance line. This makes it difficult for the price to break out.
However, in case a breakout occurs, we would expect the rate of increase to greatly accelerate afterwards, due to the lack of overhead resistance.
Short-Term Resistance
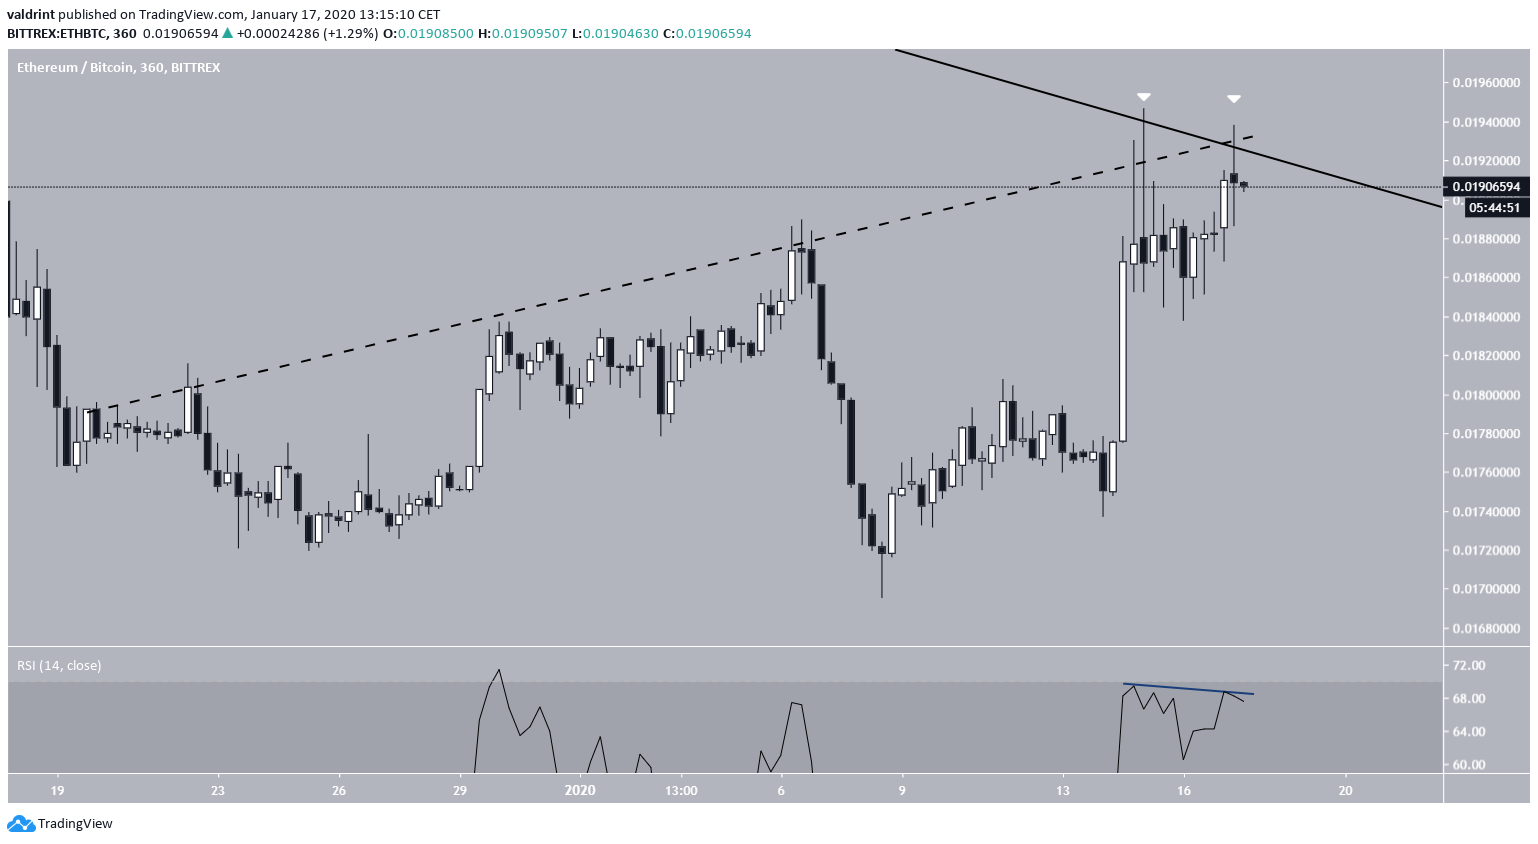
The six-hour chart reveals another resistance line, which however is ascending. At the current time, the price had validated it for the fifth time, creating a long upper wick in the process. The price created a similar wick on January 15, creating a double bottom, which is considered a reversal pattern.
In addition, there is bearish divergence in the RSI, visible up to the six-hour time-frame.
This confluence of several resistance factors makes us believe that the price will not be able to break out above the resistance line, rather will begin to decrease, find support and eventually make another attempt at a breakout.
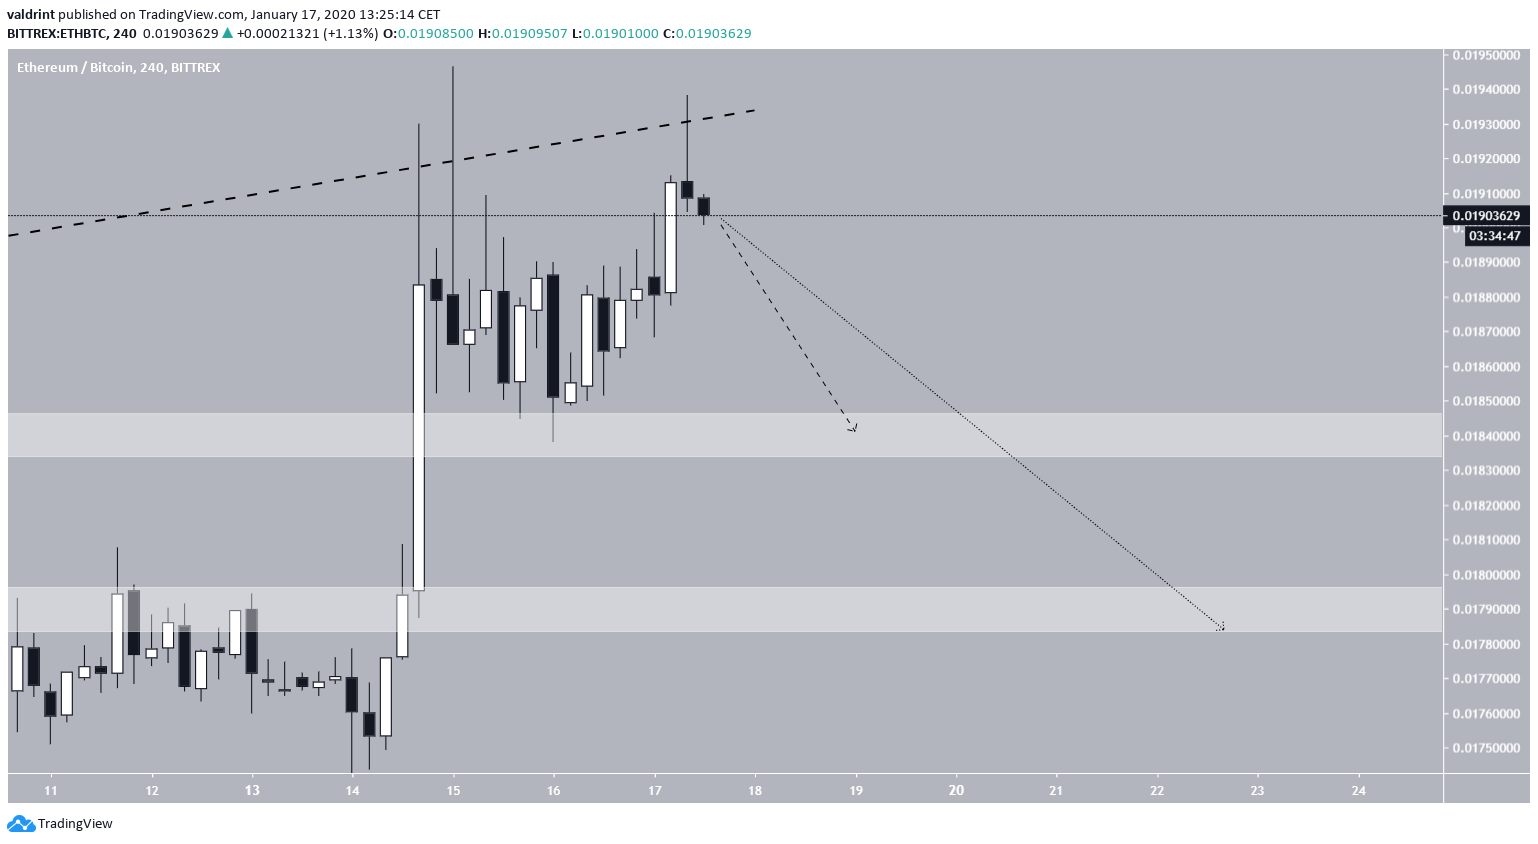
If the price begins to decrease, which we think is likely, the closest support areas are found at ₿0.0184 and ₿0.0179. Once the price gets there, it is likely to accumulate and eventually make another breakout attempt.
Going back to the trade setup posted in the tweet, we do not think the price will reach the target in the near future prior to decreasing. If the price again touches the short-term resistance, profit could be taken near ₿0.0195, only slightly below the given target.
Ethereum Future Breakout
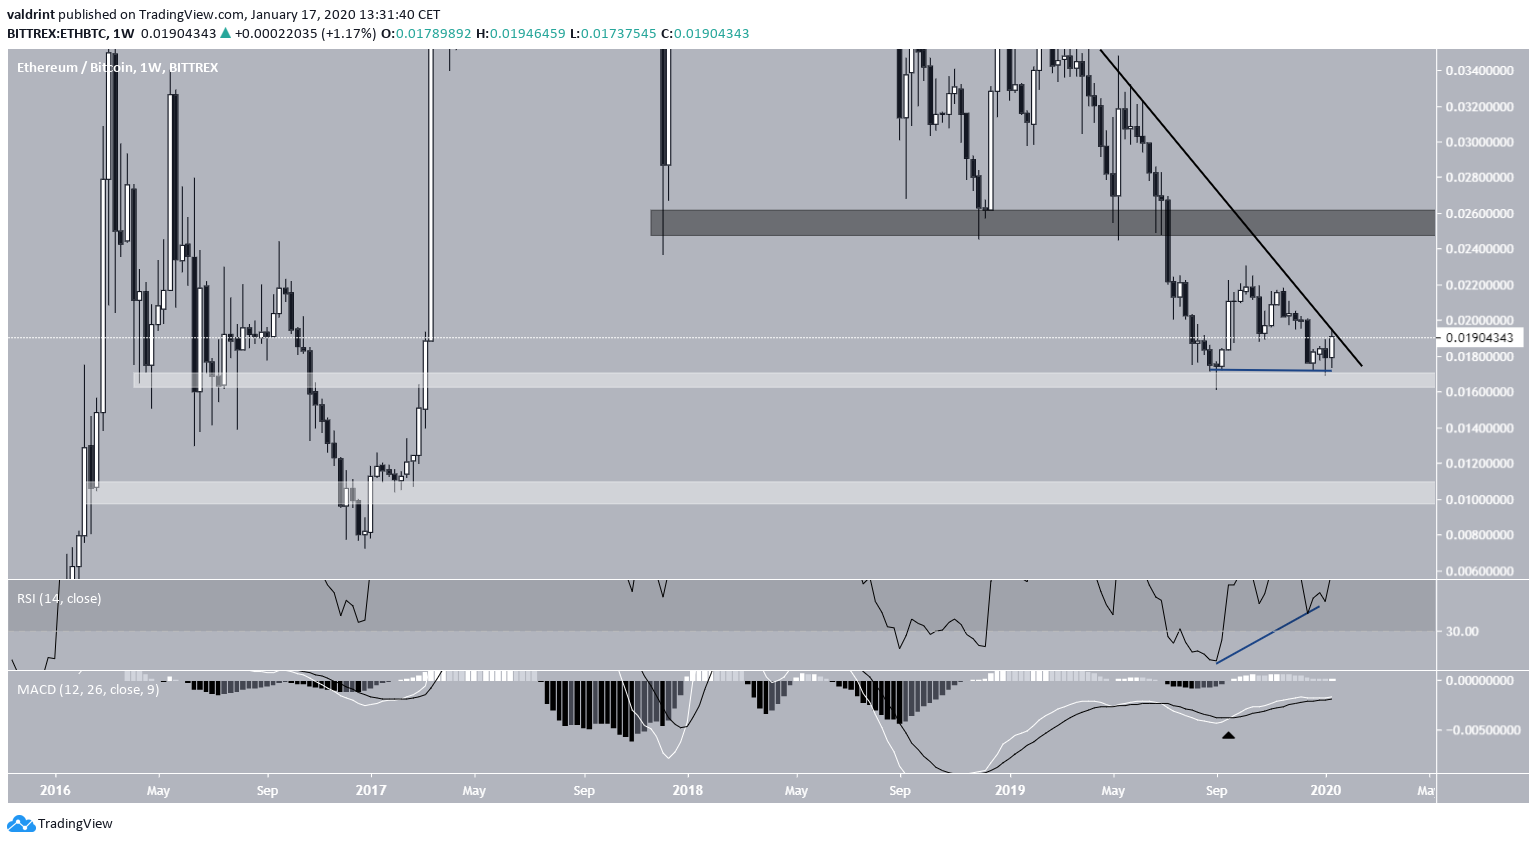
In the long-term, we think the price will eventually be successful in breaking out. This belief comes because of the double bottom combined with a bullish divergence in the oversold weekly RSI, which has previously resulted in upward movements. This is supported by the bullish cross in the weekly MACD.
If the price breaks out, a likely target is ₿0.025. On the other hand, a breakdown below ₿0.017 could take the price to ₿0.01, a movement which we believe is unlikely.
To conclude, the Ethereum price has reached a significant long-term resistance area. While we believe it will be eventually successful in breaking out, a short-term retracement is likely prior to the breakout. The closest support areas are found at ₿0.0184 and ₿0.0179.
