The Bitcoin dominance rate (BTCD) has broken down from a minor support area. The closest support area is found at 64.2%, but BTCD has yet to show any signs of reversal.
Ongoing Decline
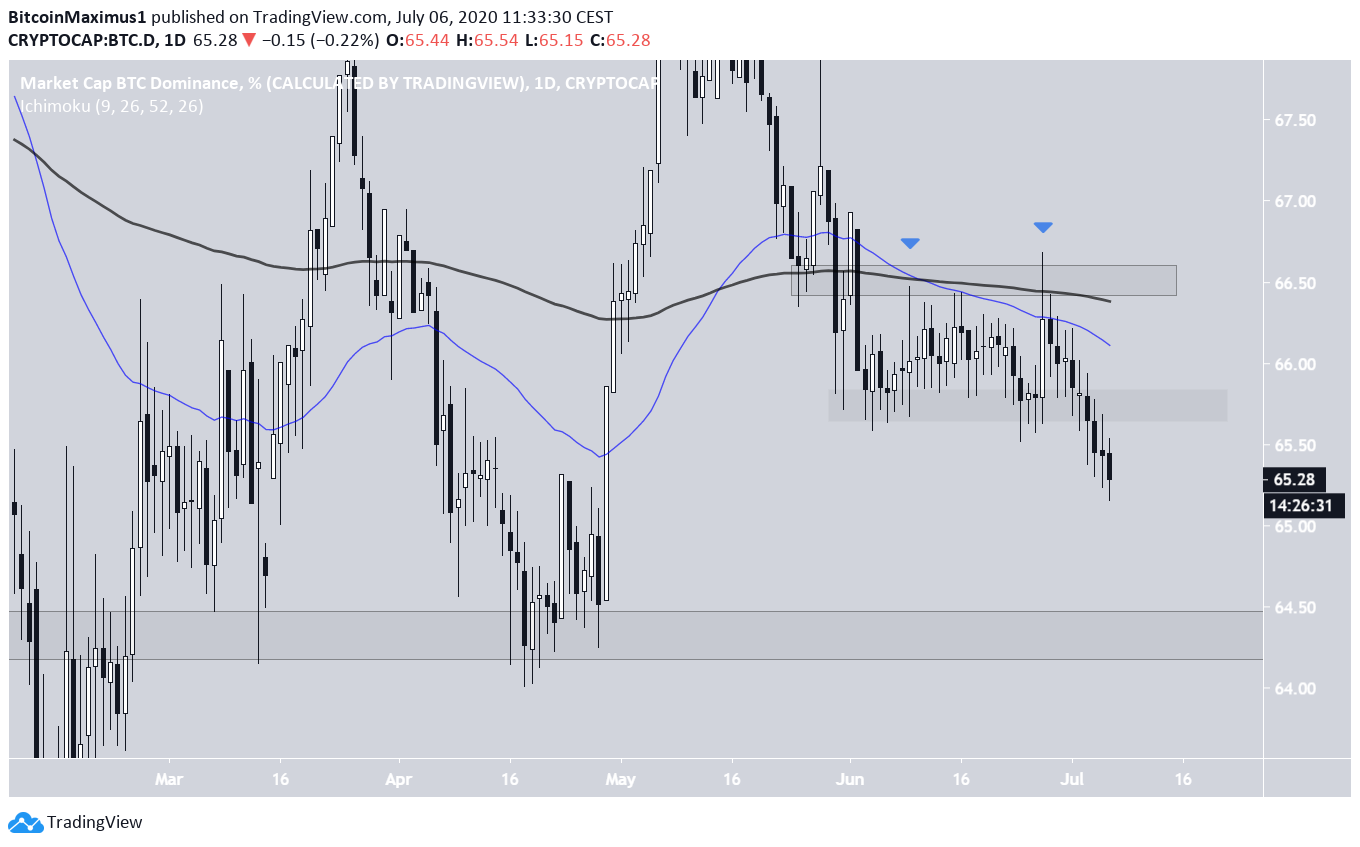
The Bitcoin dominance rate has been decreasing since reaching a high of 66.68% on June 27. This decline validated the 66.5% area as resistance. Furthermore, the same area is strengthened by the presence of the 50-and 200-day moving averages (MA), which have made a bearish cross and are above the current price.
After this decline, BTCD fell below the 65.75% support area, which is now likely to act as resistance in the future. If the rate continues to fall, the closest support area would be found at 64.2%.
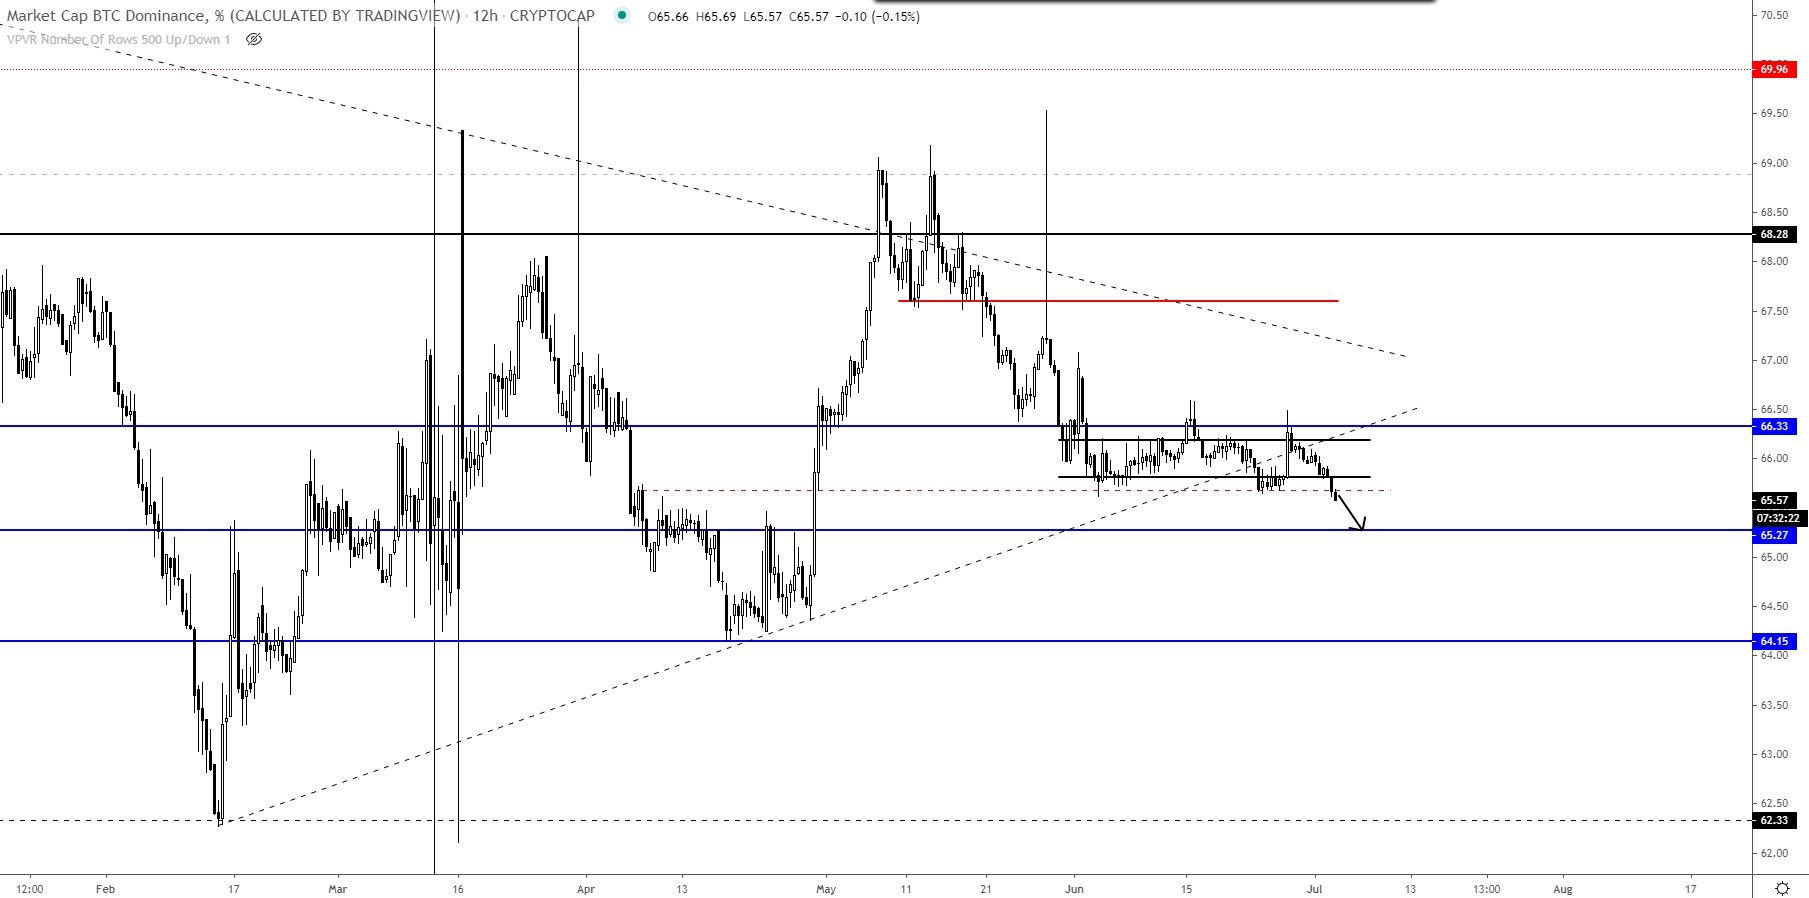
Cryptocurrency trader @TheEurosniper explains that the Bitcoin dominance rate is likely to continue falling a little more towards 65.2%. This is a minor support area where the price is currently trading and is above the previously mentioned 64.2% major support area.
Wave Count
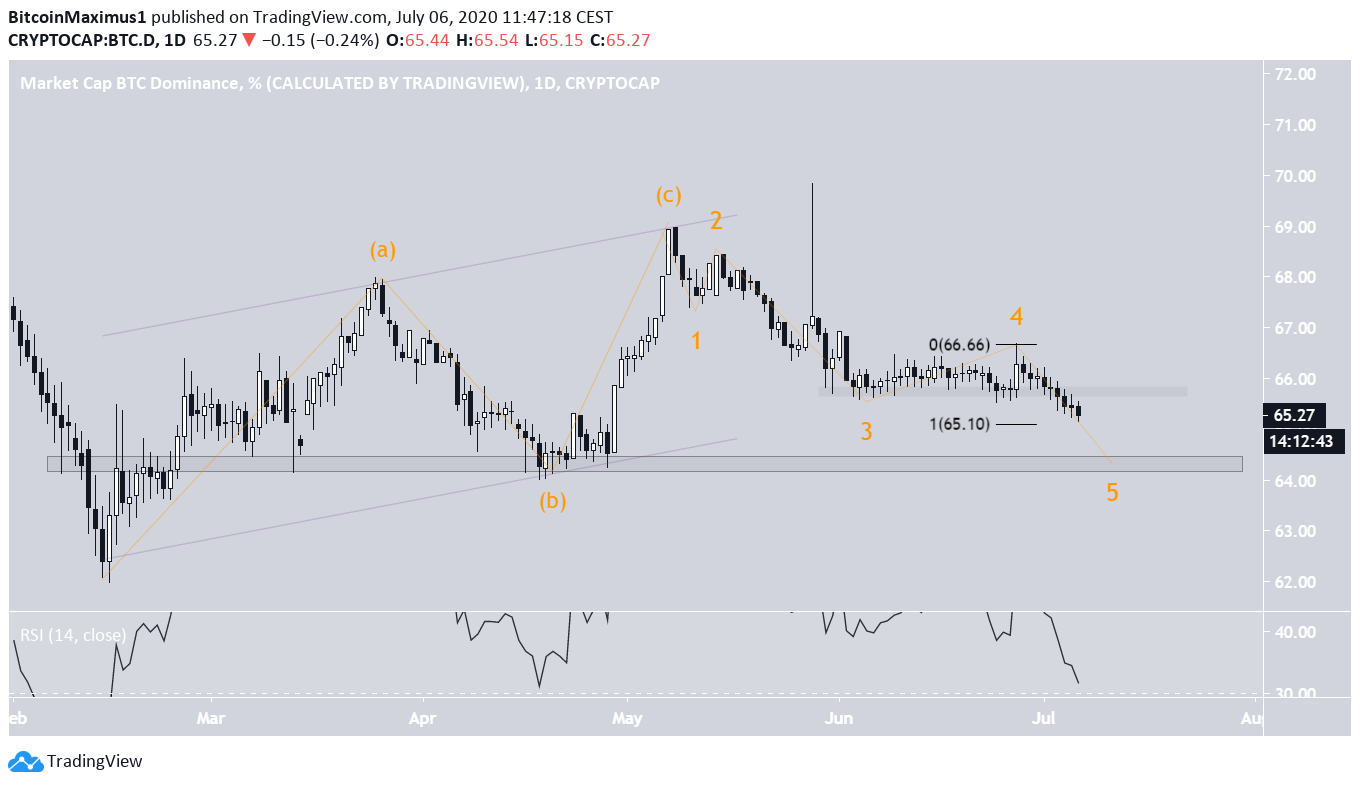
As for the wave count, it seems that BTCD is currently in the process of finishing a five-wave downward formation. While this is not yet confirmed, the previous A-B-C from February to May is confirmed, since the move was contained inside a parallel channel. The wavelengths of A and C are very similar.
The current formation should take BTCD towards 64.2% but it’s possible that the price will make a low slightly higher, more specifically at 65.1% since that is the length of wave 1 projected to the top of wave 4.
The daily RSI is moving towards the oversold area but has not yet touched. It has also not generated any meaningful bullish divergence yet.
Relationship To Bitcoin
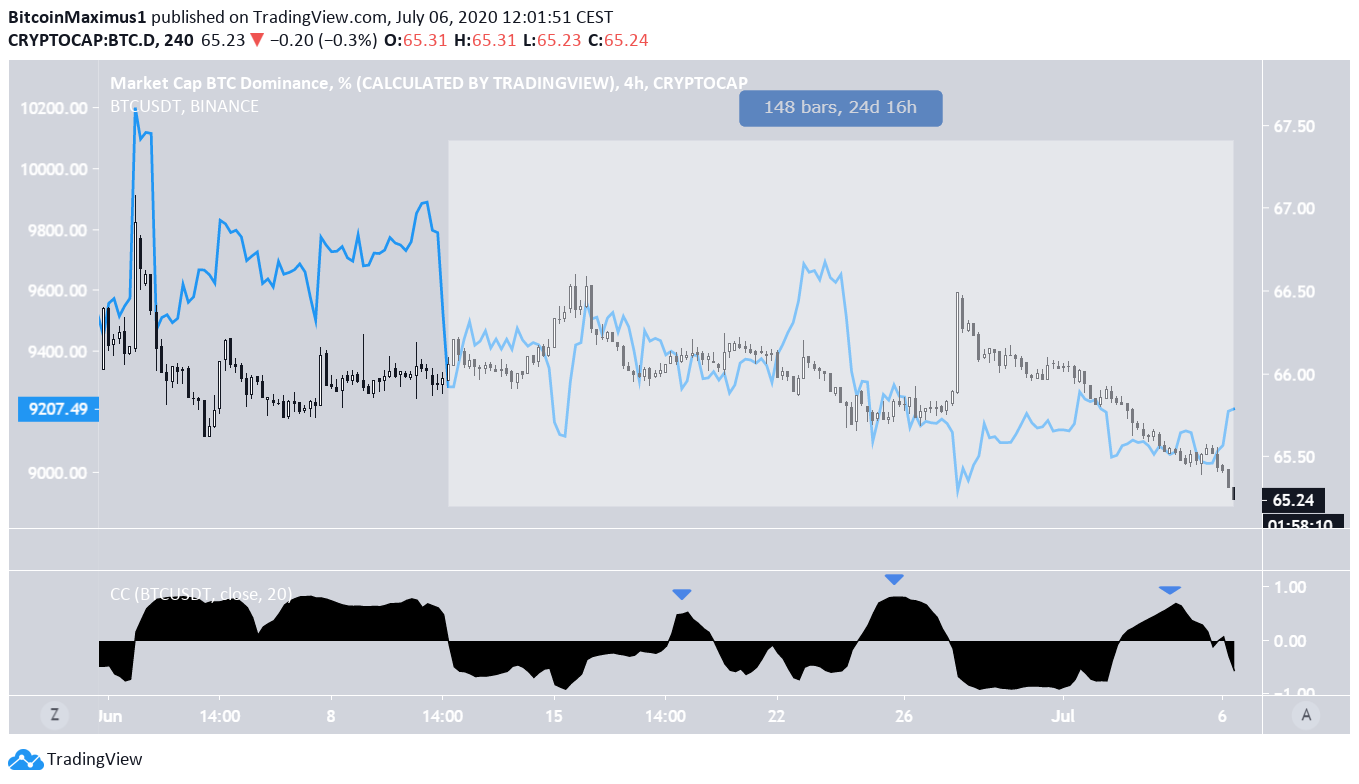
The relationship between the Bitcoin price and BTCD has usually been positive. In other words, an increase in the Bitcoin price usually causes an increase in BTCD.
However, since June 11 there has been a distinct shift, as is also visible by the correlation coefficient in the image below. Values below 0 indicate that there was a negative relationship between the two.
Therefore, for the past 25 days, with the exception of three short periods, BTC price rallies have caused a decline in BTCD, and vice versa.