


![The BAT Price Has The Potential For a 300%+ Upward Move [Premium Analysis]](/_mfes/post/_next/image/?url=https%3A%2F%2Fassets.beincrypto.com%2Fimg%2F52ydbzvlCSdZTtfZyha7ZoLy2eU%3D%2Fsmart%2F8a94b2a8260045ec80f4ac340f518535&w=1920&q=75)
The BAT price has increased by 15 percent since December 26.
On August 2, the BAT price broke down below a significant support area — possibly hinting that it was headed for new all-time lows. However, the price reversed at the beginning of September and has been increasing since.
Cryptocurrency trader @postyxbt outlined the BAT price chart, showing that the price has just moved above two significant moving averages (MAs). He asked the question: “What does this chart say to you?”
What does this $BAT chart say to you? pic.twitter.com/bk1YDPwsMX
— Posty (@PostyXBT) December 30, 2019
Let’s dive deep into the price action and try to answer this question.
New Market Cycle
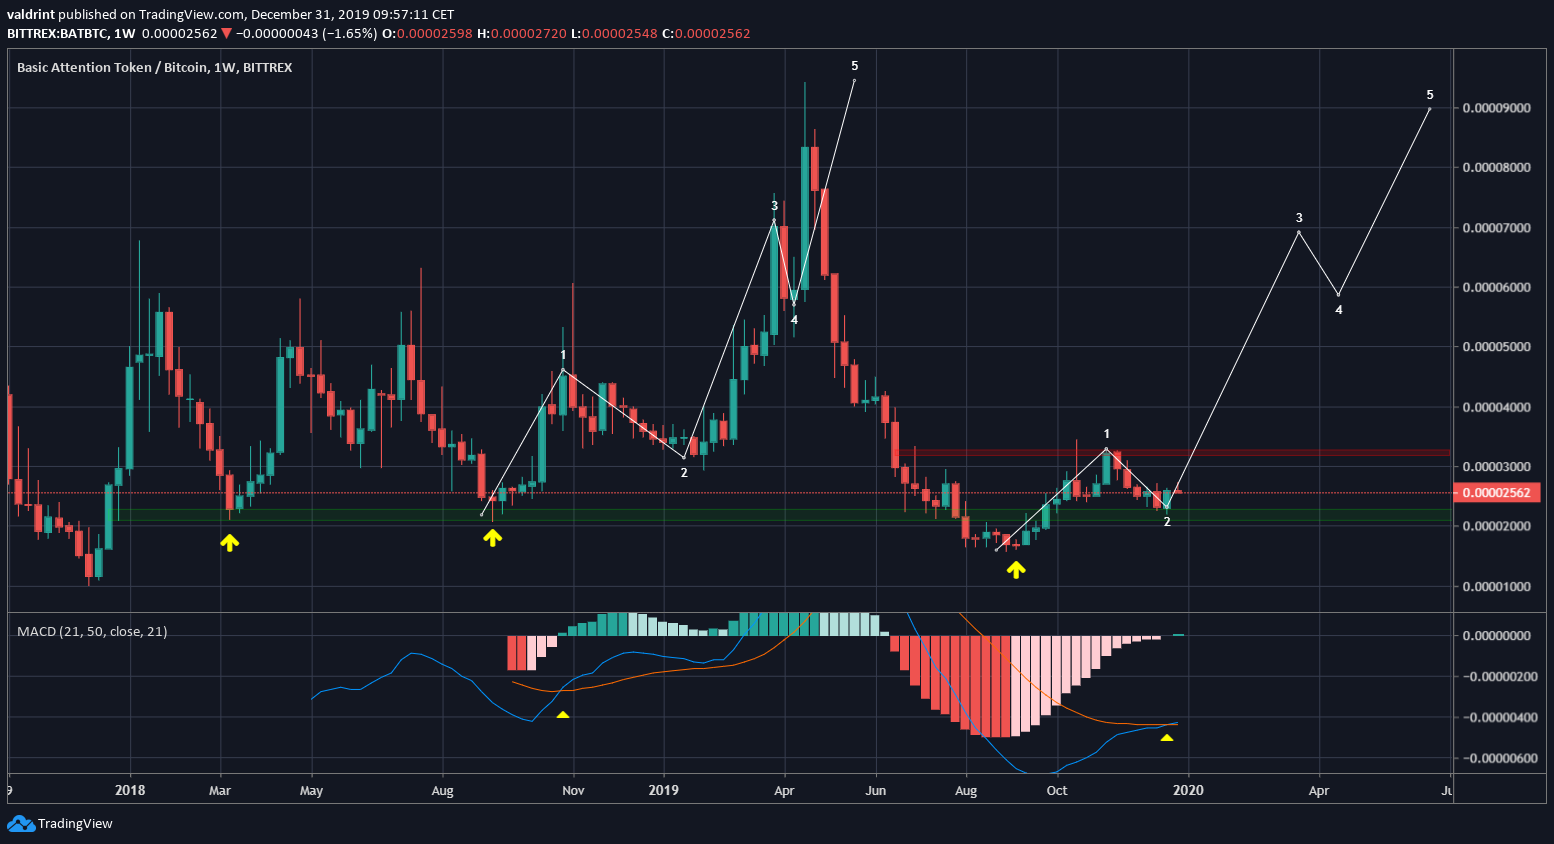
The long-term chart suggests that the BAT price has possibly begun a new upward cycle.
Firstly, the Basic Attention Token price had created a support area at 2000 satoshis that held throughout 2018. The price broke down below it in August 2019. However, instead of falling to the next support area, BAT reversed and reclaimed the range.
Secondly, the weekly MACD has just made a bullish cross. The previous time this occurred was in October 2018, leading to an eventual 350 percent increase.
Therefore, it is entirely possible that the upward move from September-November was the first wave of a five-wave Elliott formation and the price is currently correcting. The rate of increase should accelerate once BAT breaks out above 3200 satoshis.
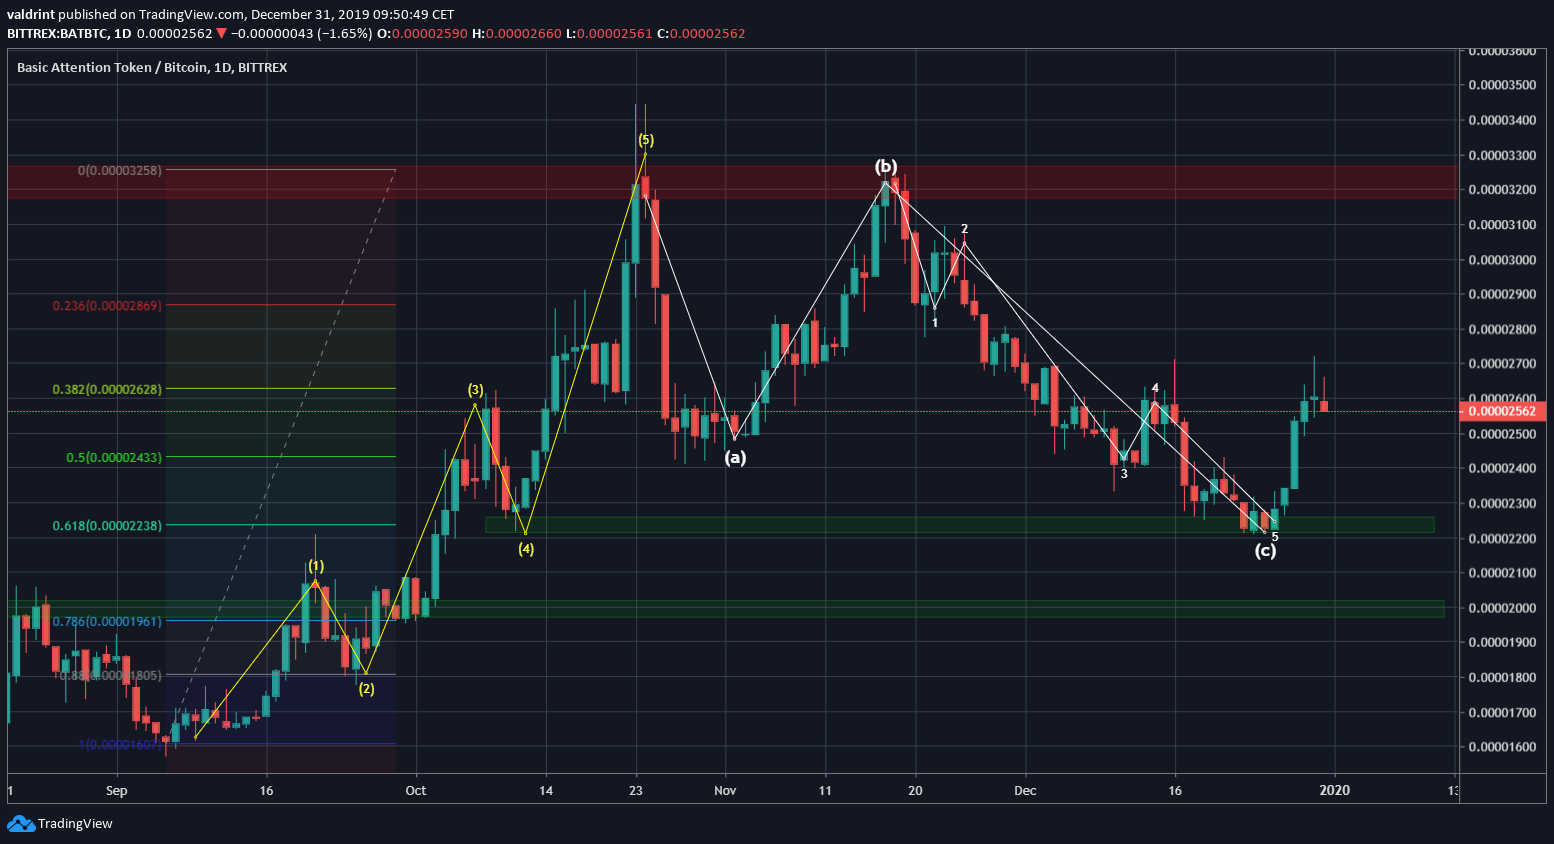
Isolating the upward move from September, several features are revealed.
The Basic Attention Token price has possibly finished both a five-wave of the upward move and an A-B-C correction with an extended C wave.
The correction ended inside the 2200 satoshis support area, which coincides with the 0.618 Fib level, making it a very suitable place to initiate a reversal.
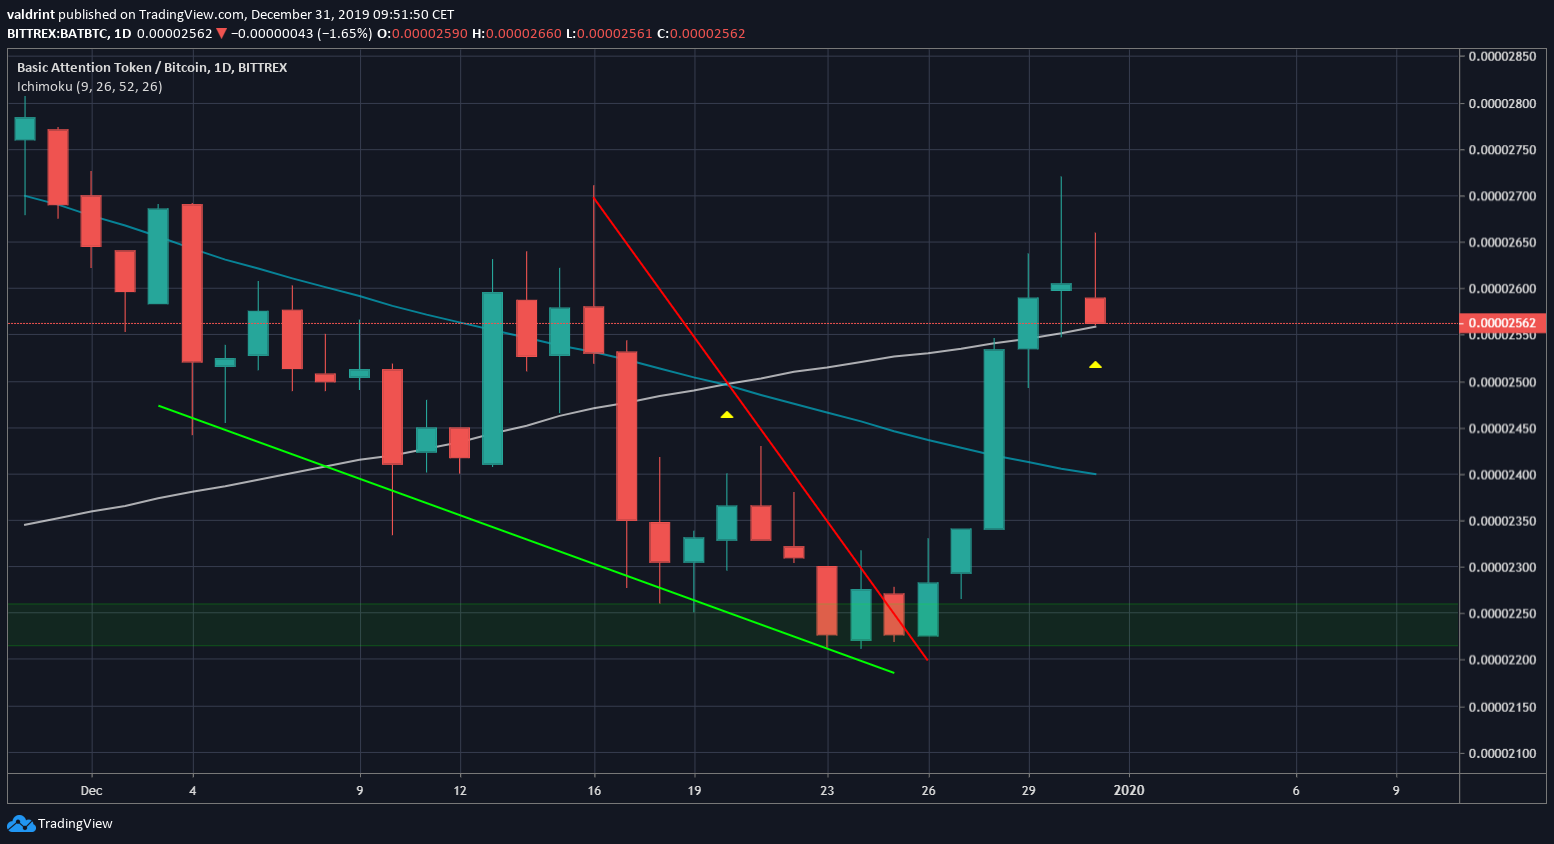
The breakout transpired after the BAT price created a descending wedge. Additionally, it has moved above the 100- and 200-day moving averages (MAs) — which have made a bullish cross. The price has possibly found support above the 100-day MA.
Short-Term Movement
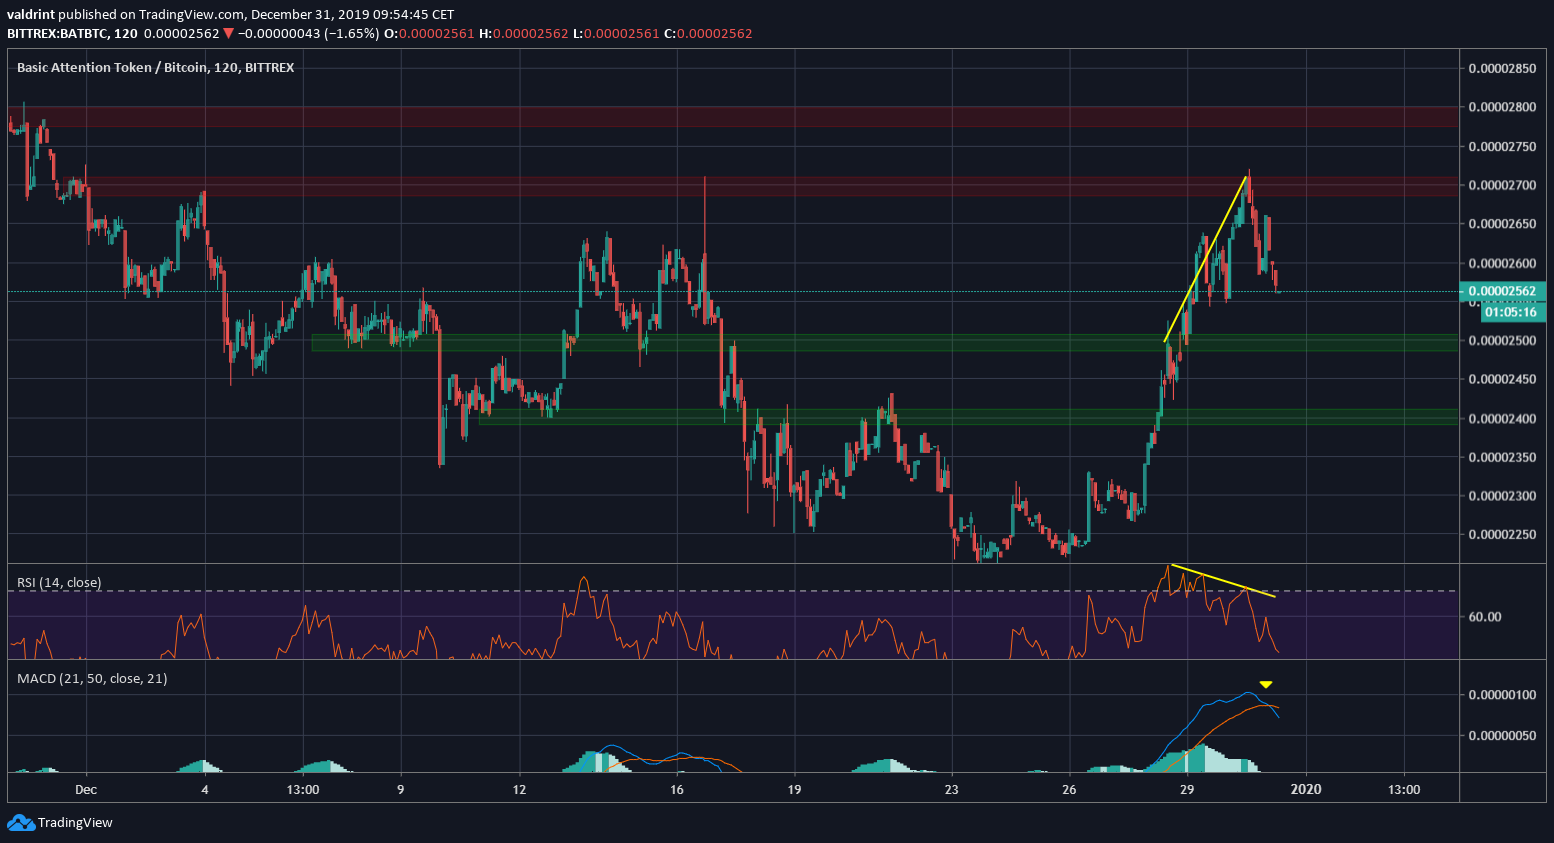
In the short-term, the price movement was perfectly outlined by another cryptocurrency trader, @devchart, who stated that the price has broken out and retested both the 2400 and 2600 satoshi resistance area and is heading for 2800.
https://twitter.com/devchart/status/1211567785618427904?s=19
Since the tweet, the BAT price made an unsuccessful attempt at reaching 2800 satoshis, topping out near 2750.
The movement was combined with a bearish divergence in both the RSI & the MACD, suggesting that the price will head downwards. Therefore, we can expect it to reach at least one of the support areas at 2500 and 2400 satoshis, respectively.
To conclude, the BAT price has likely begun a new market cycle. Since the correction is finished, we can expect the price to move upward and the rate of increase to accelerate after it breaks out above 3200 satoshis. While the short-term outlook is bearish, both the medium- and long-term ones are bullish.
