


Tezos (XTZ) has rallied considerably since March 2020 but has largely traded sideways since its August high. Is it time for another breakout?
This article will compare the previous market cycles for XTZ and see how the current movement measures up to them. We’ll also see what the future has in store for XTZ.
Initial Rally
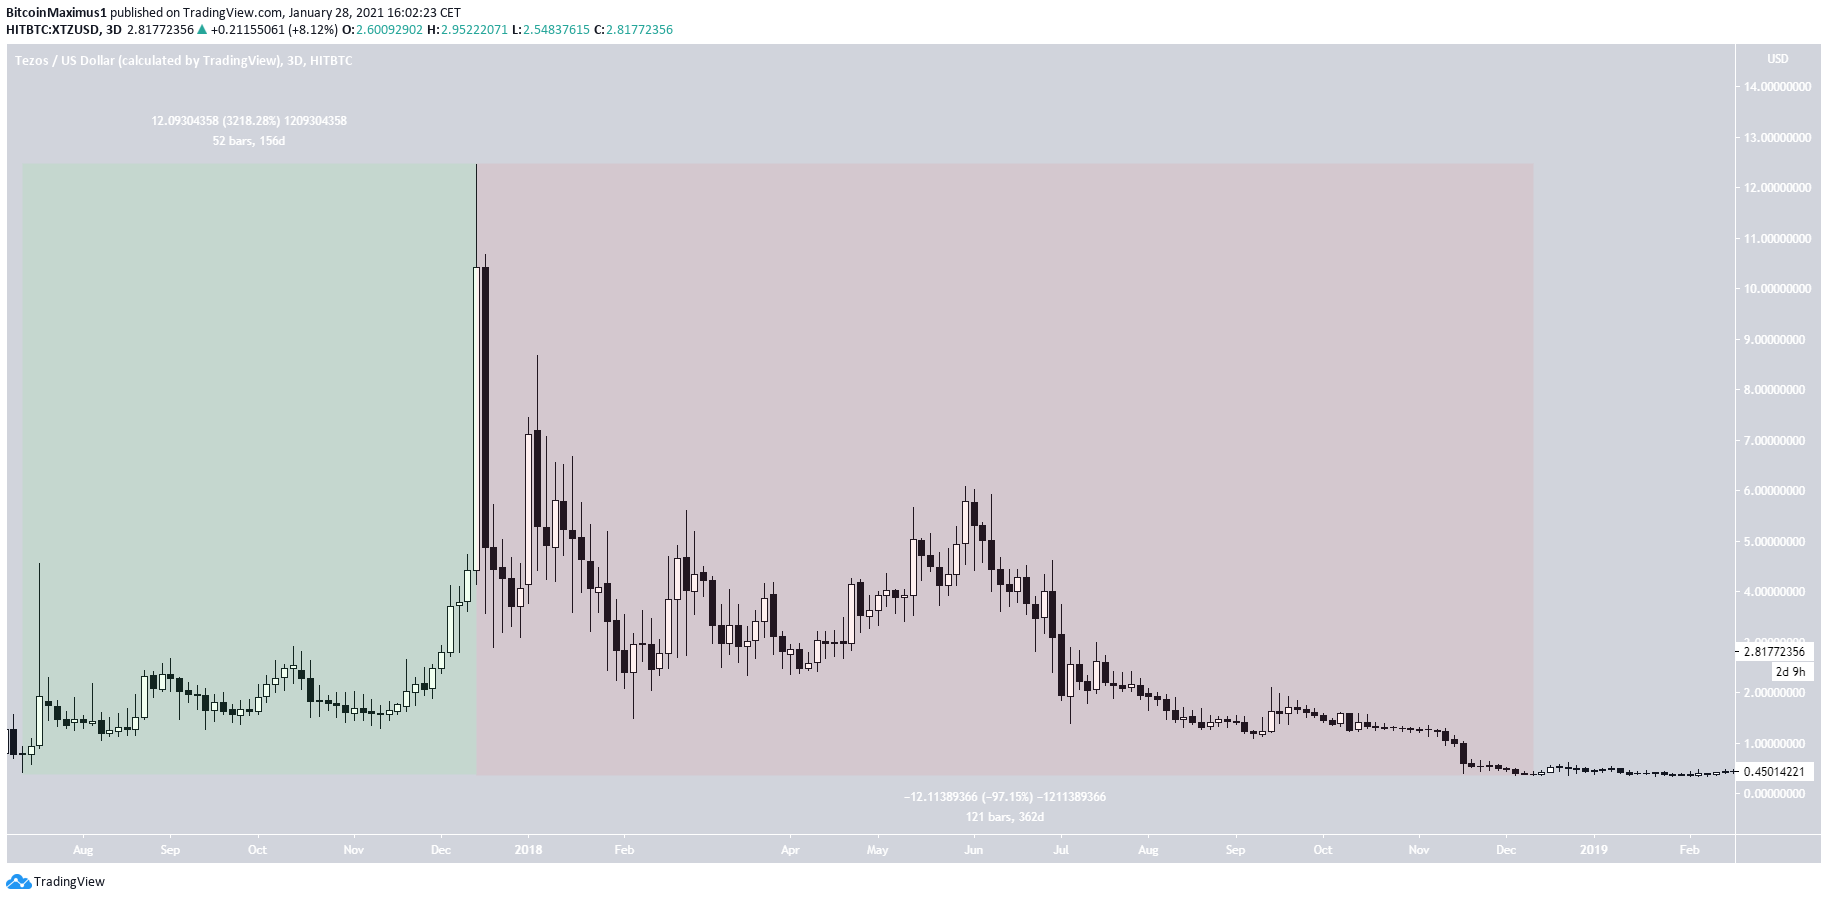
The initial rally for XTZ began in July 2017, when it was trading at a low of $0.423. The upward move occurred over a period of 156 days, leading to an all-time high price of $12.46 on Dec. 16, 2018. This measured an increase of 3,218%.
It’s worth noting that while this high was recorded on HITBTC, other exchanges recorded different all-time high prices. Several exchanges have the all-time high near $4.50 on Aug. 2020 since their price history began later.
Following this all-time high was a 362-day corrective period, ending with a low of $0.363. This still stands as XTZ’s all-time low price. The downward move amounted to a staggering decline of 97%.
Current Movement
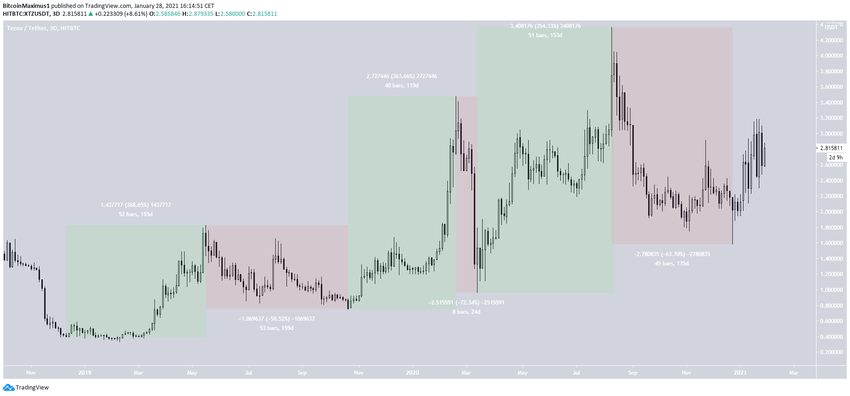
The move since the Dec. 2018 low can best be explained in three cycles.
The first cycle took place between Dec. 2018 – May 2019, with the upward move recording an increase of 368% in 155 days. Afterward, XTZ corrected by 58% over the next 59 days.
The second cycle occurred between Oct.2019 – Mar. 2020, with the upward move recording a rally of 363% in 119 days. The ensuing downward move was swifter, falling 72% in 24 days.
Finally, the third cycle took place between Mar – Dec. 2020, with the upward move recording a 354% gain in 33 days. The subsequent decline saw a 64% loss in 135 days.
While it’s possible that the downward move hasn’t ended, it’s more likely that it has given the lengthy time of consolidation.
All three of these cycles had daily rates of increases and decreases, measuring 2-3% per day. Therefore, they pale compared to the original cycle. In other words, if history were to repeat, XTZ could see increased volatility to the upside.
Future All-Time High?
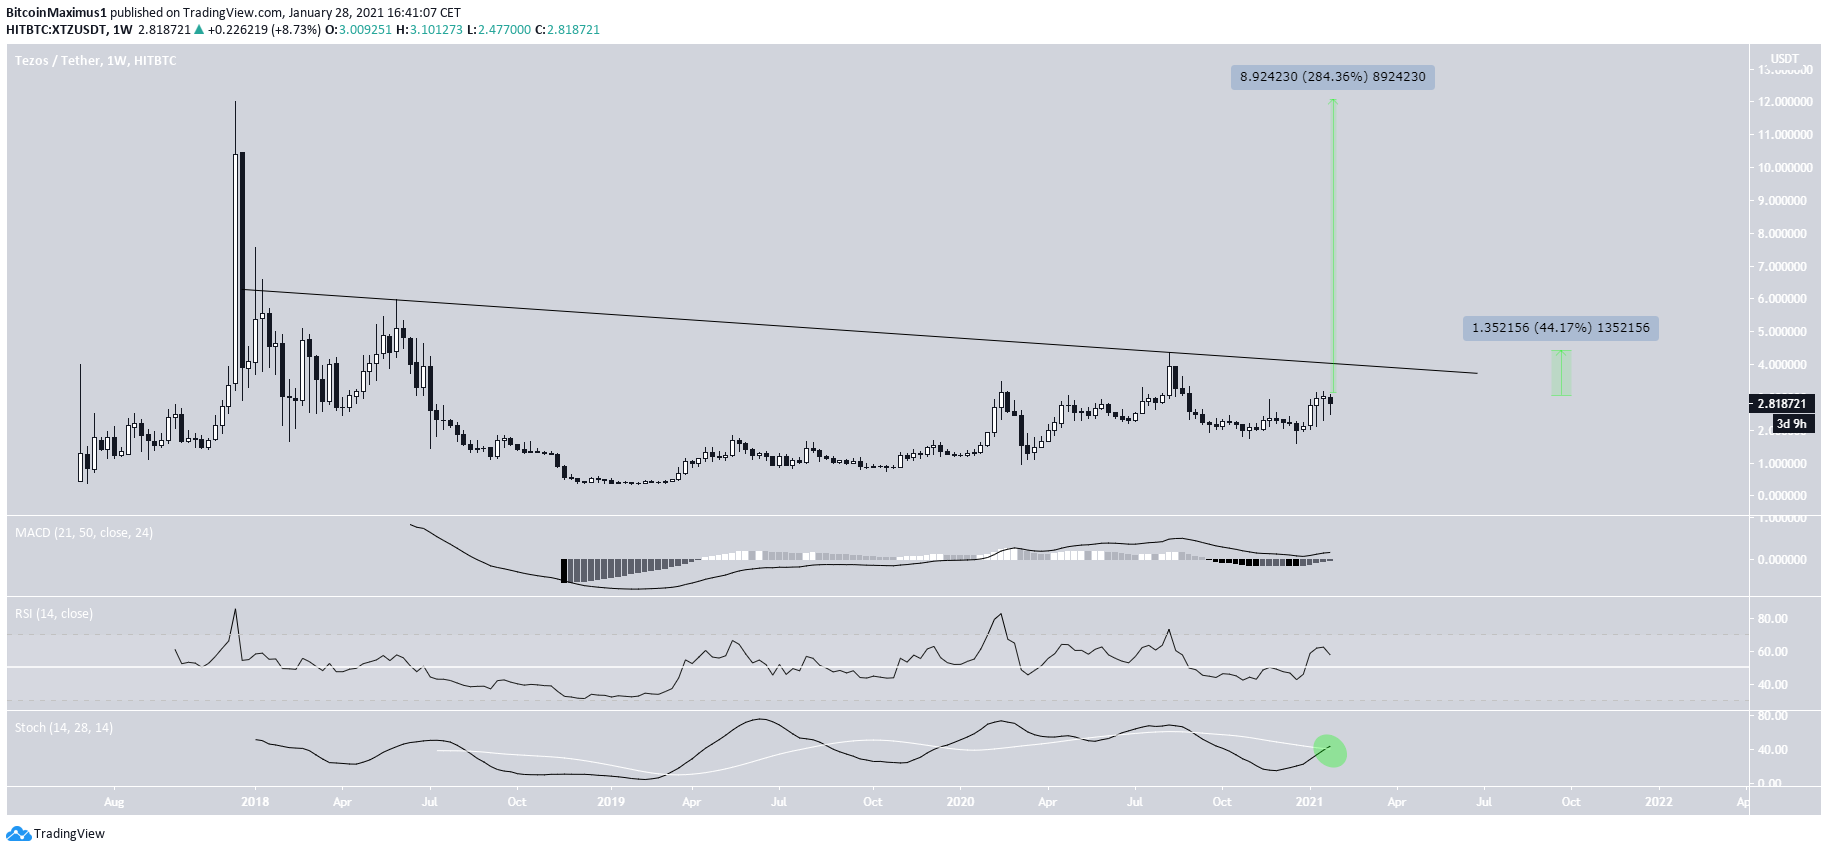
To break the $12.46 all-time high price, XTZ would have to increase by 284%. On the other hand, it would only have to increase by 44% to break the $4.50 high recorded on other exchanges.
While technical indicators are bullish, supporting the possibility of an increase, XTZ is still trading below a long-term descending resistance line. Once it manages to break out above, the rate of increase is likely to greatly accelerate.
For BeInCrypto’s latest Bitcoin (BTC) analysis, click here!


