
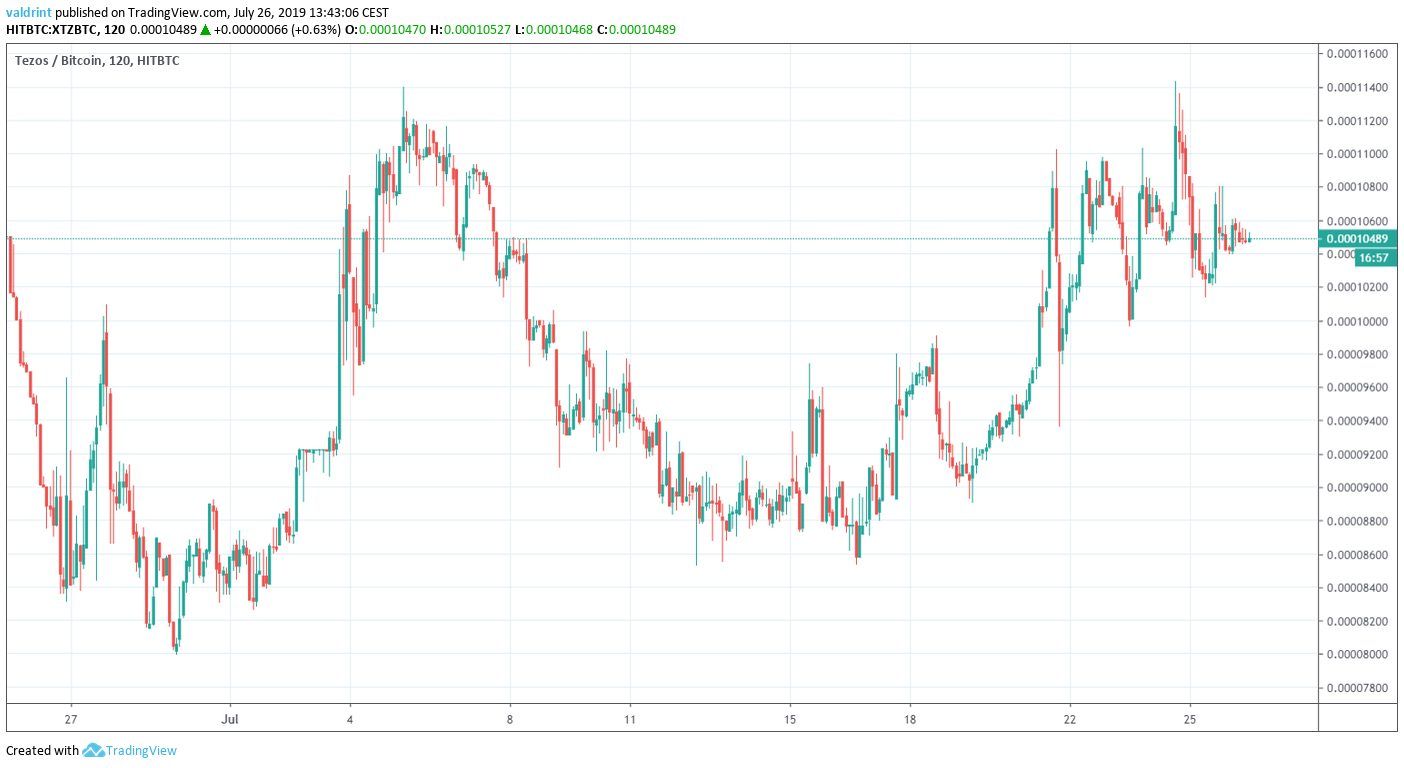
On June 29, 2019, the Tezos (XTZ) price reached a low of 8000 satoshis. An upward move ensued. On July 15, XTZ reached a high of 11,200 satoshis. After a downtrend that lasted for about ten days, the price began an upward move and reached similar highs on July 24.
Will XTZ continue to increase? In order to answer this question, we are going to analyze XTZ in different time-frames alongside technical indicators.
If you are interested in trading cryptocurrencies with a multiplier of up to 100x on our new partner exchange with the lowest fees, follow this link to get a free StormGain account!
Tezos Price: Trends and Highlights for July 26
- XTZ/BTC is trading close to a very significant resistance area.
- It is trading inside an ascending triangle.
- There is short-term bearish divergence developing in the RSI.
- Moving averages give a bearish outlook.
Significant Resistance
A look at the daily time-frame shows that the XTZ price is trading inside a very significant resistance area.
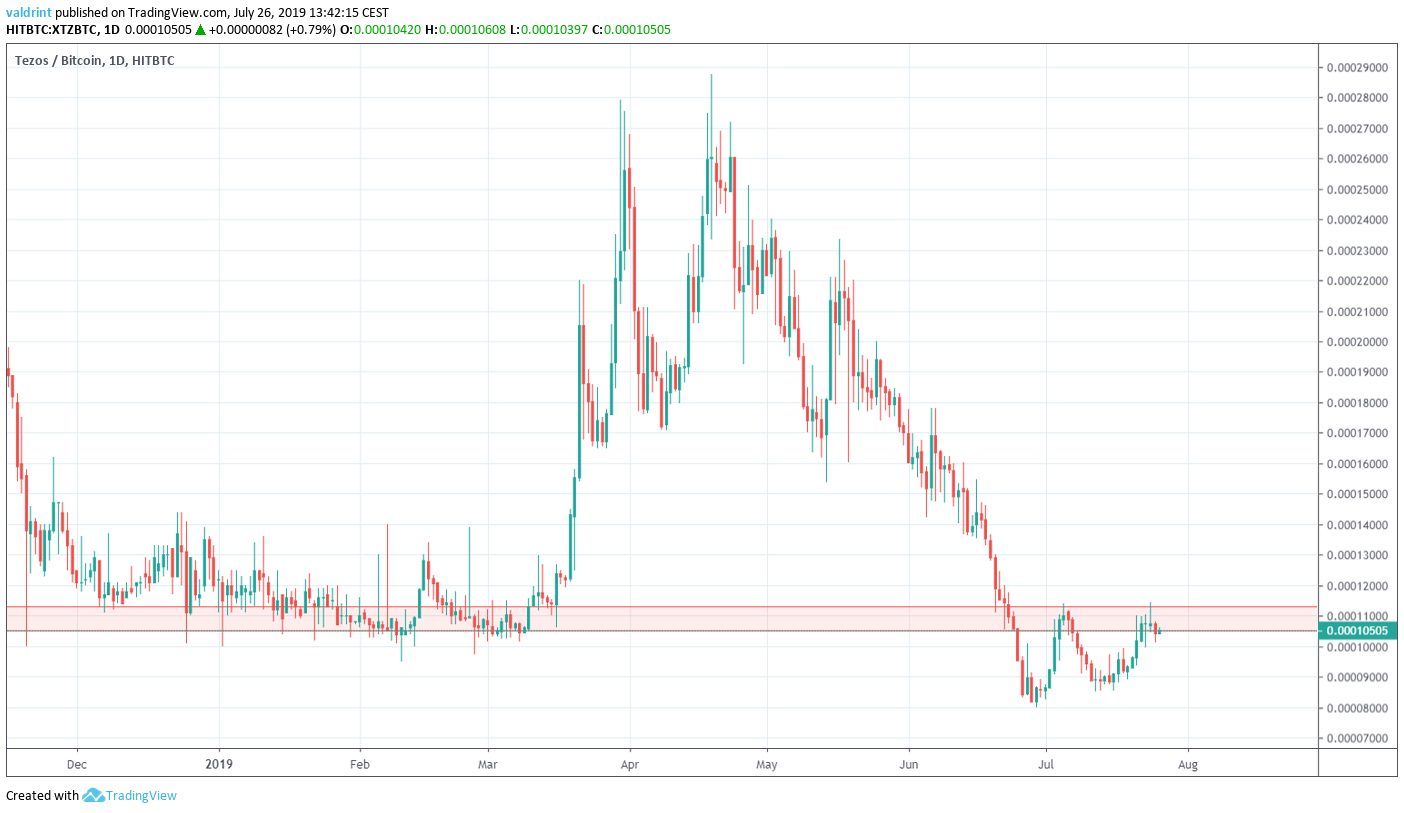
In the period from November 2018 to March 2019, the price created a support area very close to 11,000.
An upward move ensued.
On June 2019, the price broke down from this support.
Afterward, when it reached it again, it immediately decreased.
This effectively validated it as a resistance area.
Ascending Triangle
A closer look shows that since the beginning of July, the XTZ price has been trading inside an ascending triangle.
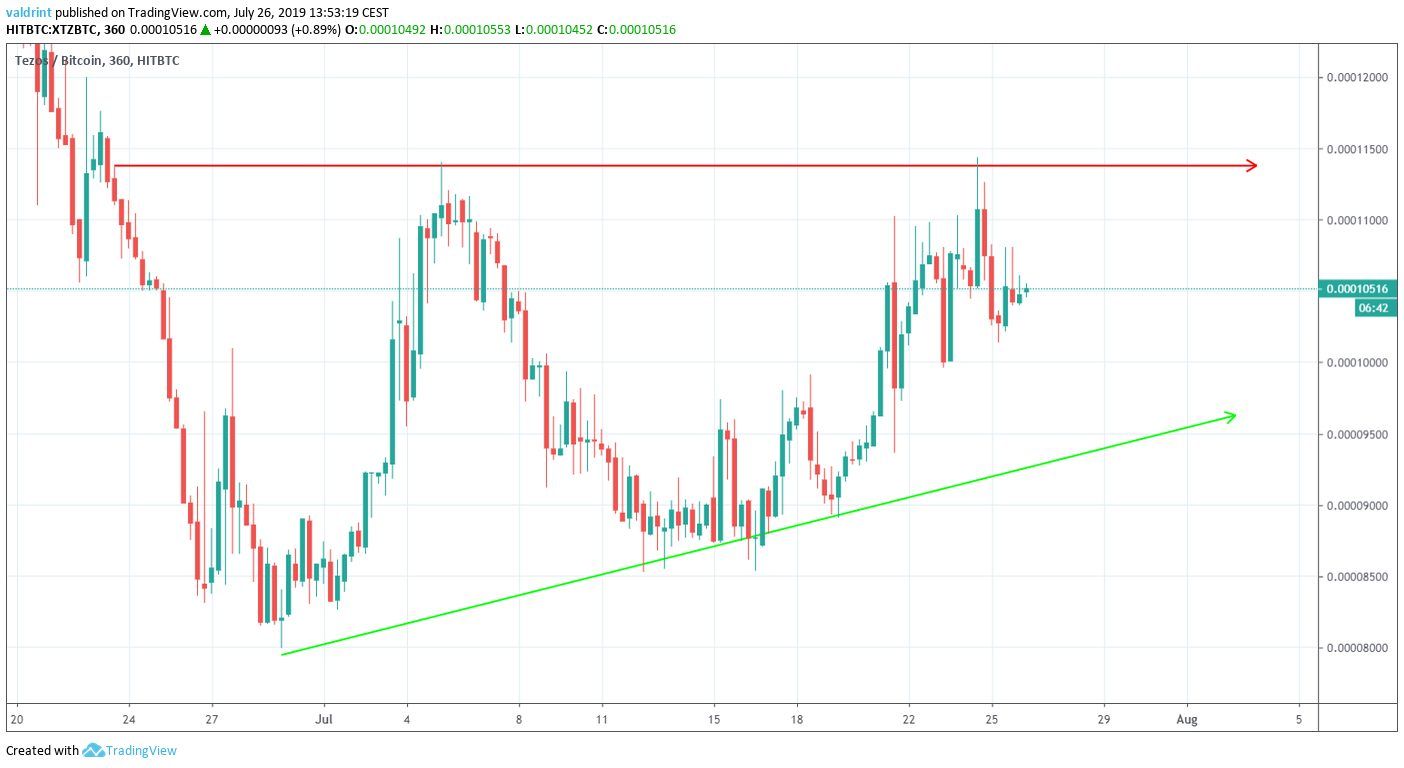
The ascending triangle is considered a bullish pattern, making a price breakout more likely.
Let’s take a closer look and see if that is likely to occur.
Tezos Price Technical Indicators
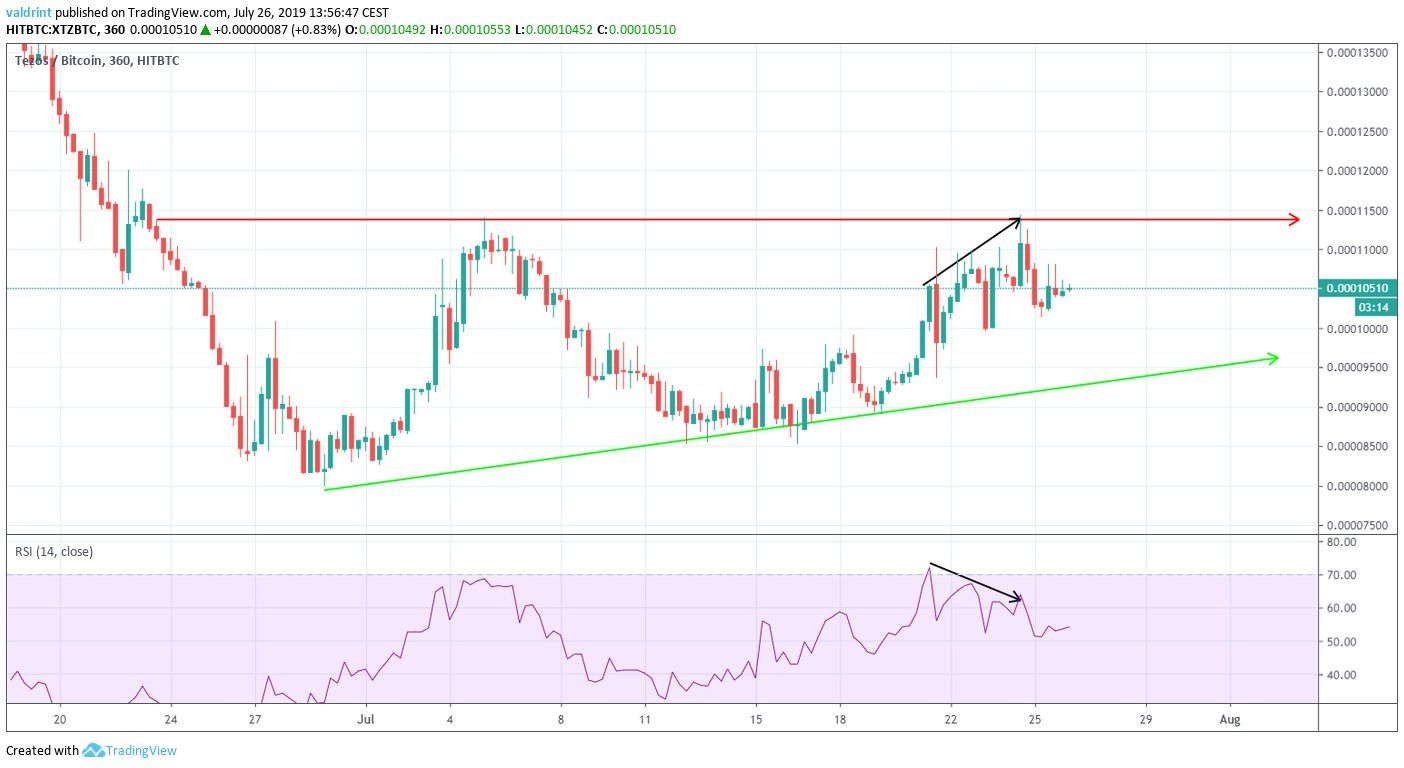
Bearish divergence has been developing since July 20. It culminated in the high that was reached on July 24.
Similarly, a look at the moving averages (MA) gives a bearish outlook.
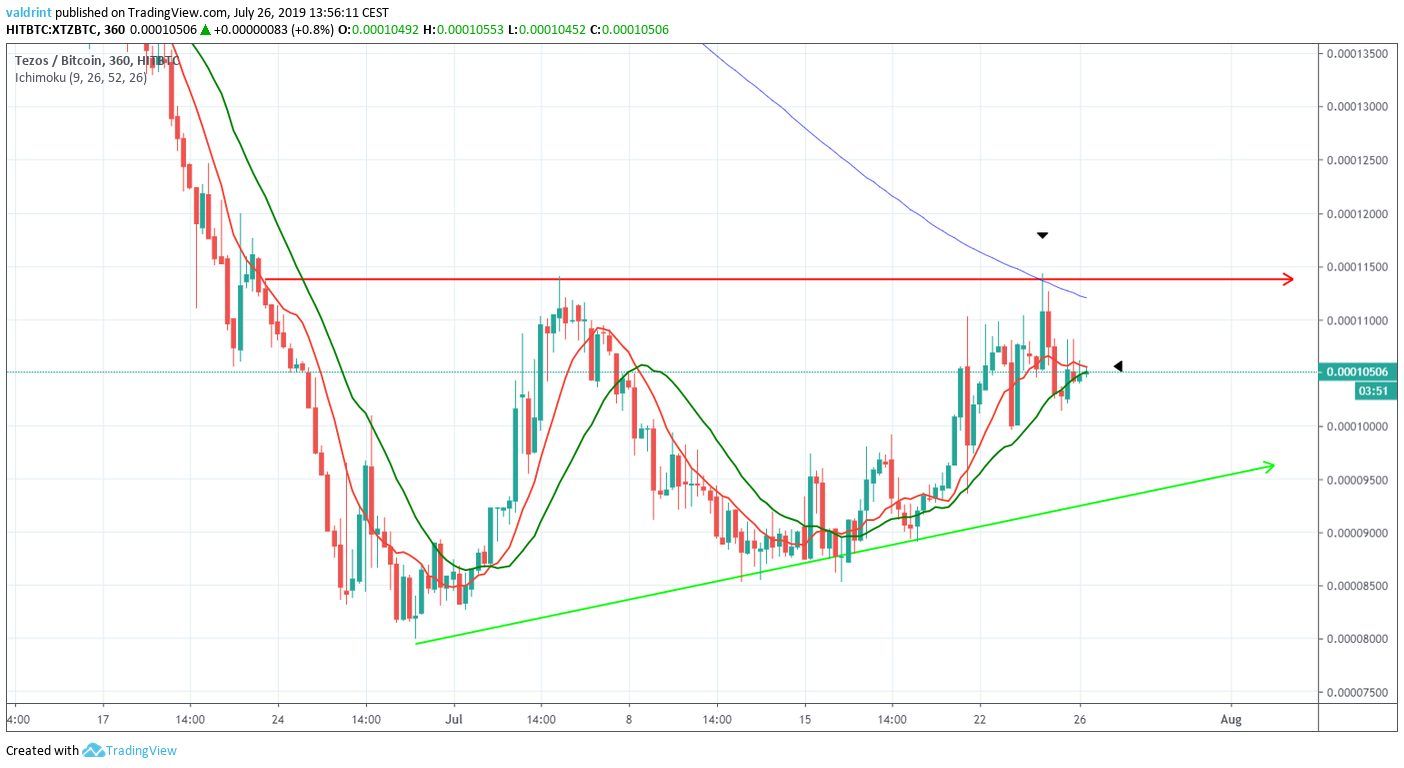
The price reached the 200-period MA on July 24. However, it immediately began to decrease.
Additionally, the price is trading slightly below the 10- and 20-period MAs.
They are very close to making a bearish cross.
These indicators suggest that the XTZ price is likely to decrease towards the support line of the triangle.
This does not necessarily mean that it will not break out.
However, a short-term decrease is likely before it does.
Summary
The XTZ price is trading inside an ascending triangle and is very close to a significant resistance area.
According to our analysis, the current breakout attempt will be unsuccessful, and the price will decrease towards the support line of the triangle.
A future breakout is not ruled out.
Do you think the XTZ price will break out from the triangle? Let us know in the comments below.
Disclaimer: This article is not trading advice and should not be construed as such. Always consult a trained financial professional before investing in cryptocurrencies, as the market is particularly volatile.
Images are courtesy of Shutterstock, TradingView.
