
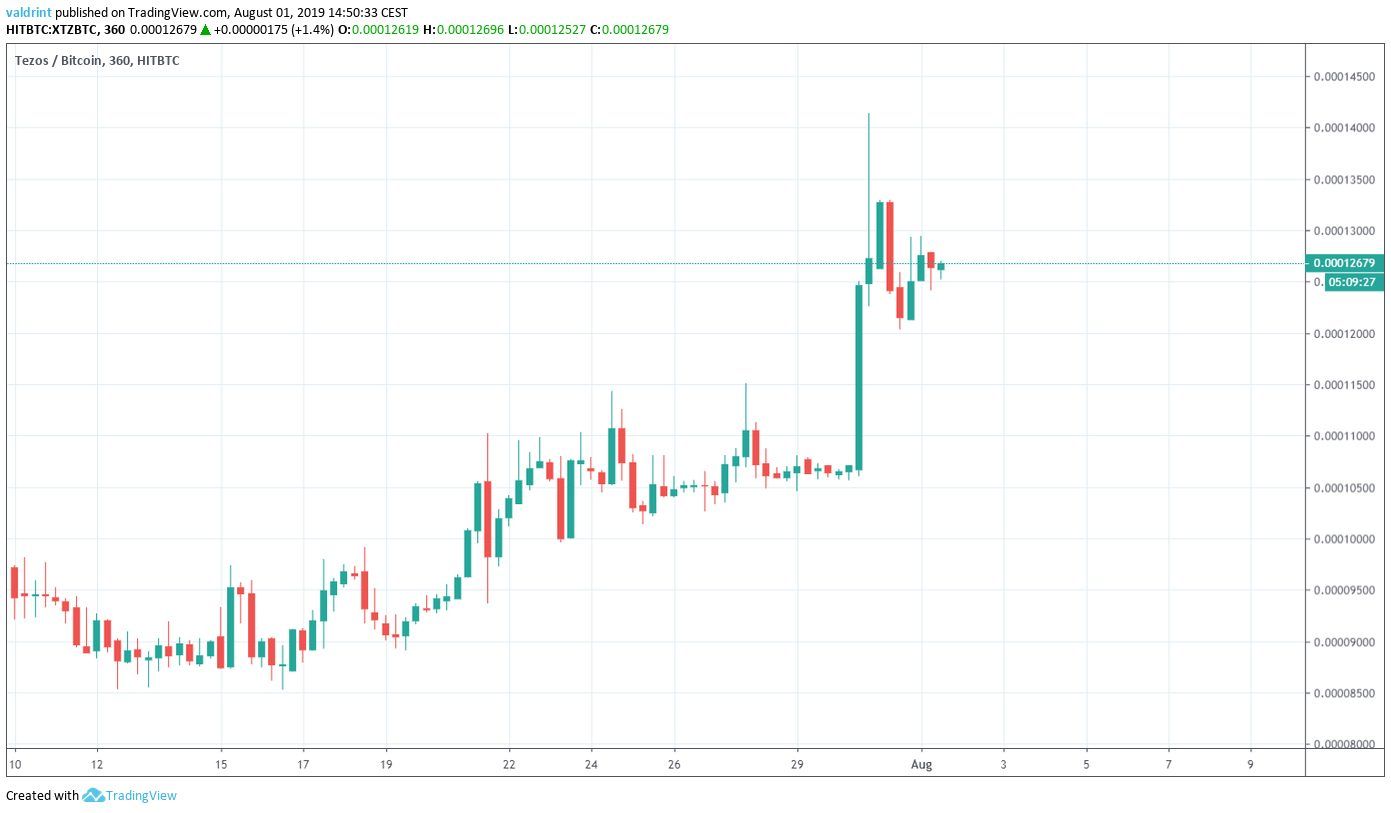
On July 16, 2019, the Tezos price reached a low of 8533 satoshis. An upward move ensued. Over the next week, XTZ made several unsuccessful attempts at breaking out above 11,500 satoshis. However, it finally did so on July 30 and reached a high above 14,000 satoshis. It has been decreasing since.
Where will XTZ begin to reverse? Continue reading if you want to find out.
Create a free account with our partner exchange, Xcoex, for an accessible, secure way to trade cryptocurrencies like Tezos (XTZ).
For our previous analysis, click here.
Tezos Price: Trends and Highlights for August 1
- XTZ/BTC broke out from an ascending triangle.
- Momentum indicators provide a very bullish sentiment.
- Daily moving averages have made a bullish cross.
- There is resistance at 14,000 satoshis.
Previous Movement
A look at the six-hour time-frame shows that the XTZ price has been trading inside an ascending triangle since June 23.
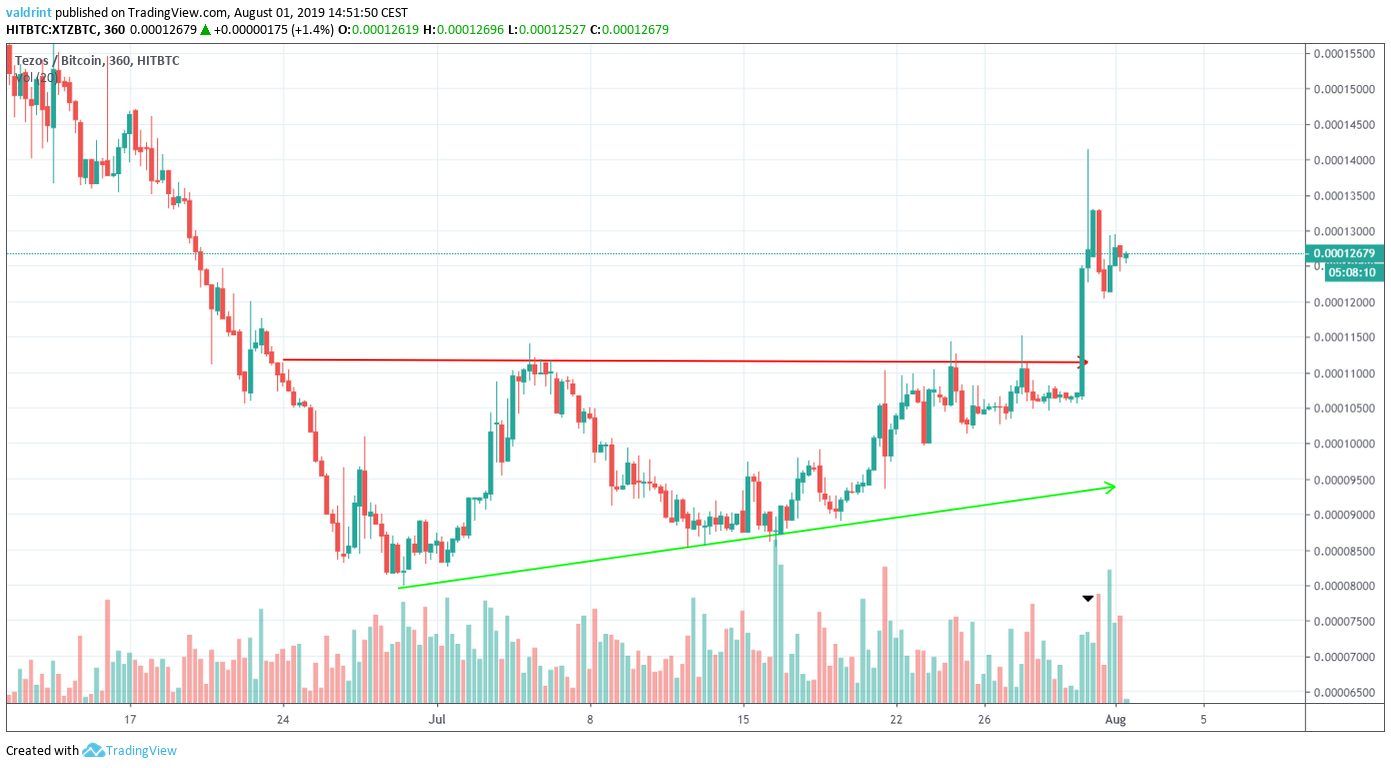
On July 30, the price broke out.
The breakout occurred with average volume, somewhat reducing its significance.
Where will the price go next?
Let’s take a look at the weekly time-frame to put this breakout into perspective.
Long-Term Outlook
A look at the weekly time-frame gives us two developments
- There is very significant bullish divergence developing in the RSI and the MACD
- The divergence occurred very close to the all-time low price.
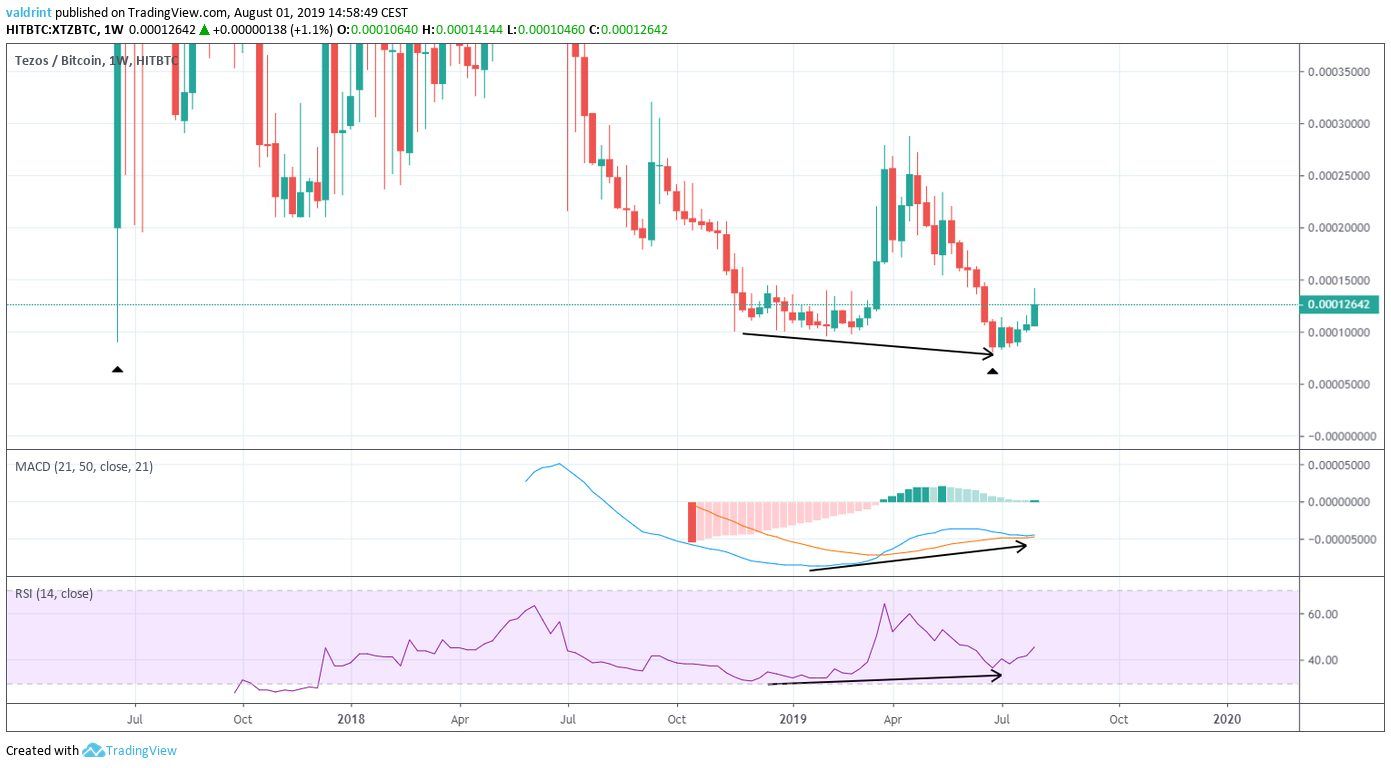
The RSI has been generating divergence since December 2018, while the MACD has been doing the same since January 2019.
A divergence of this magnitude in such a long-term time-frame is uncommon.
Additionally, it occurred very close to the previous all-time low reached on June 19, 2017.
A look at the daily moving averages (MA) confirms this uptrend.
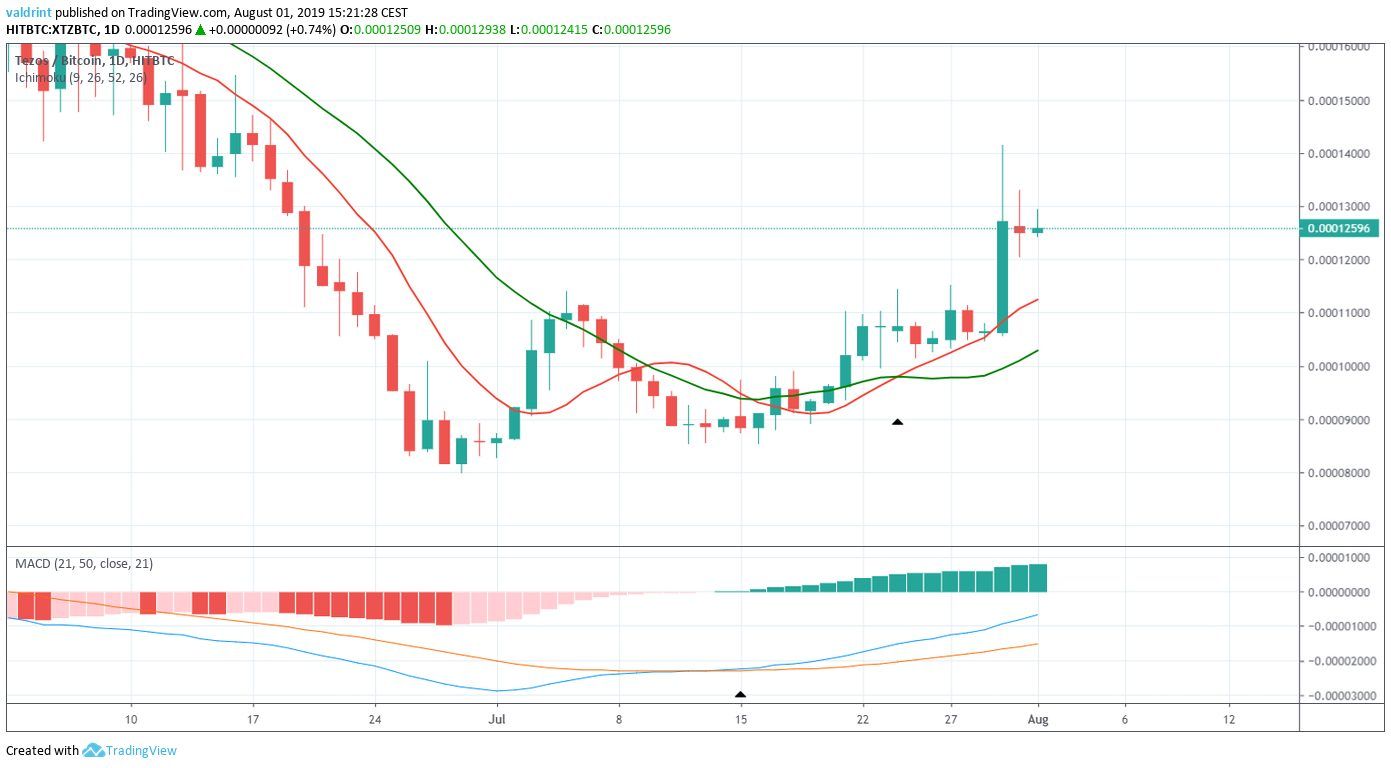
A bullish cross between the 10- and 20-day MAs occurred on July 22.
It was preceded by a bullish cross in the MACD on July 15.
Additionally, the MACD is almost into positive territory.
The use of these indicators suggests that the XTZ price has likely begun an uptrend and will continue to increase.
Future Movement
In order to predict future movement, we have outlined one resistance and one support area below.
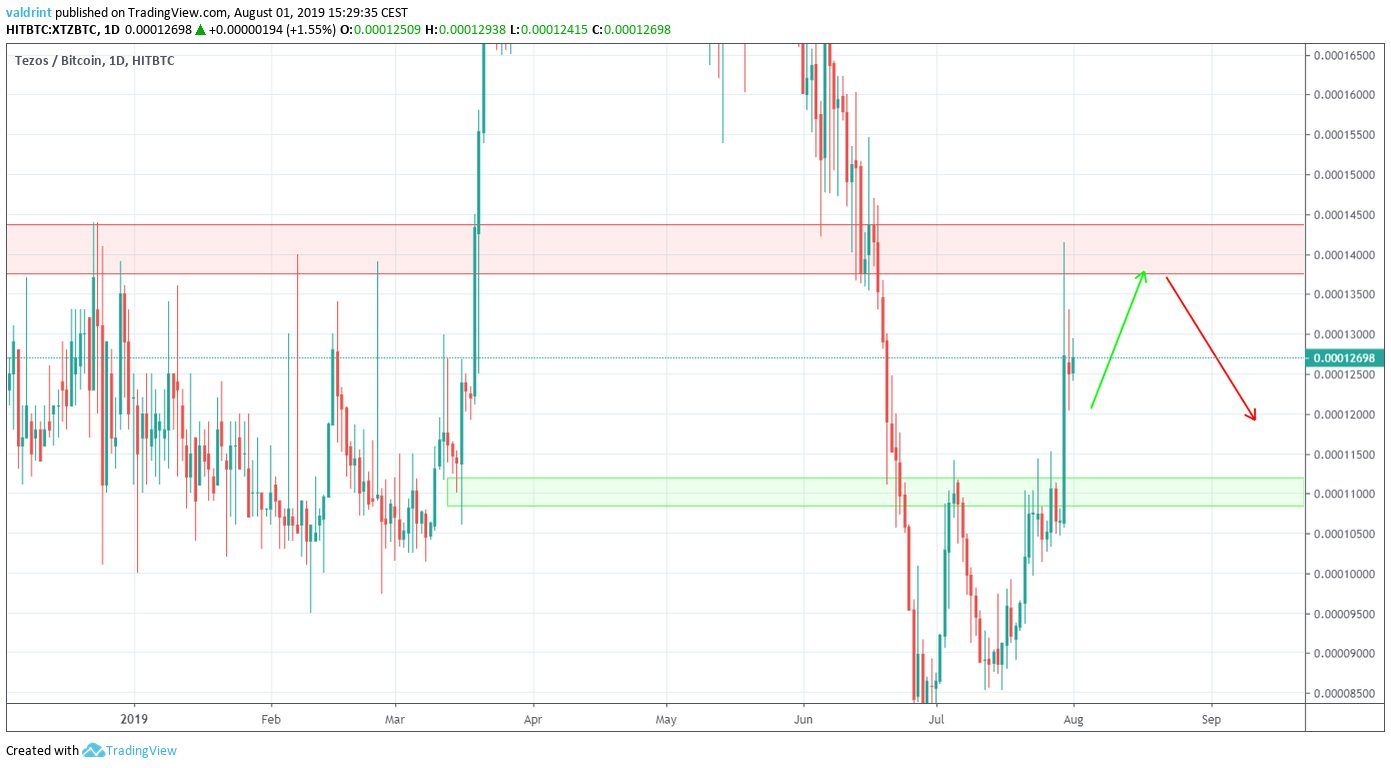
The resistance area is found at 14,000 satoshis, while the support at 11,000 satoshis.
According to our analysis, the Tezos price is likely to trade inside this range and create a continuation pattern.
Afterward, a breakout is likely.
Tezos Price Summary
The XTZ price recently broke out from an ascending triangle.
It reached a resistance area at 14,000 satoshis.
According to our analysis, it is likely to eventually break out above this resistance.
However, short-term decreases are possible before the price breaks out.
Do you think XTZ will increase above the resistance area? Let us know in the comments below.
Disclaimer: This article is not trading advice and should not be construed as such. Always consult a trained financial professional before investing in cryptocurrencies, as the market is particularly volatile.
Images are courtesy of Shutterstock, TradingView.
