
On September 7, 2019, the Tezos price reached a low of 9320 satoshis. An upward move followed, materializing in three waves. XTZ reached a high of 10,698 satoshis on September 9. It has been decreasing since.
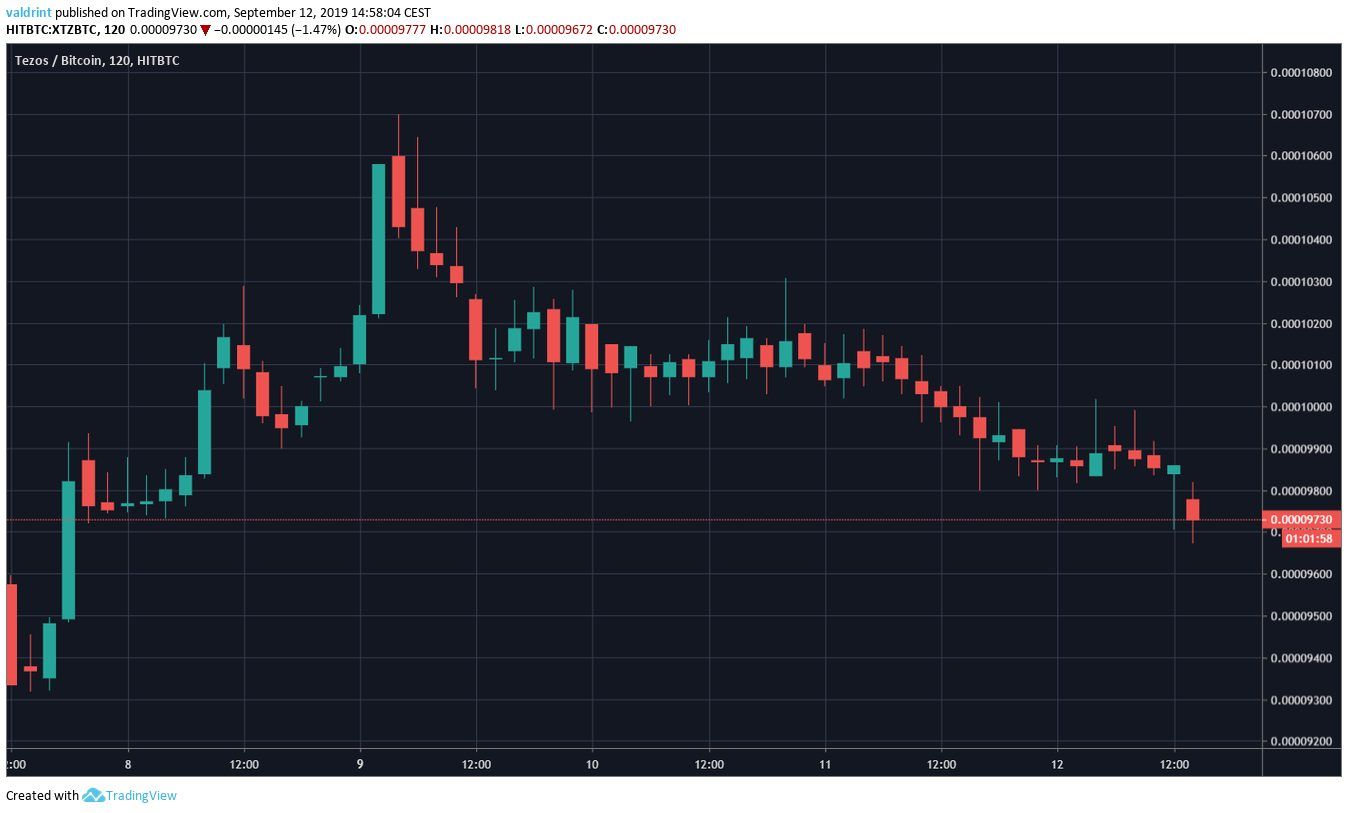
How long will the downtrend continue for XTZ? Keep reading below to find out.
For our previous analysis, click here.
Tezos Price: Trends and Highlights for September 12
- XTZ/BTC is trading inside a descending channel.
- It is trading below the daily moving averages.
- The MACD has rejected a bullish cross.
- There is support at 8550 satoshis.
Descending Channel
A look at the daily time-frame shows that XTZ has been trading inside a descending channel since August 7.
The period discussed in the introduction is highlighted below.
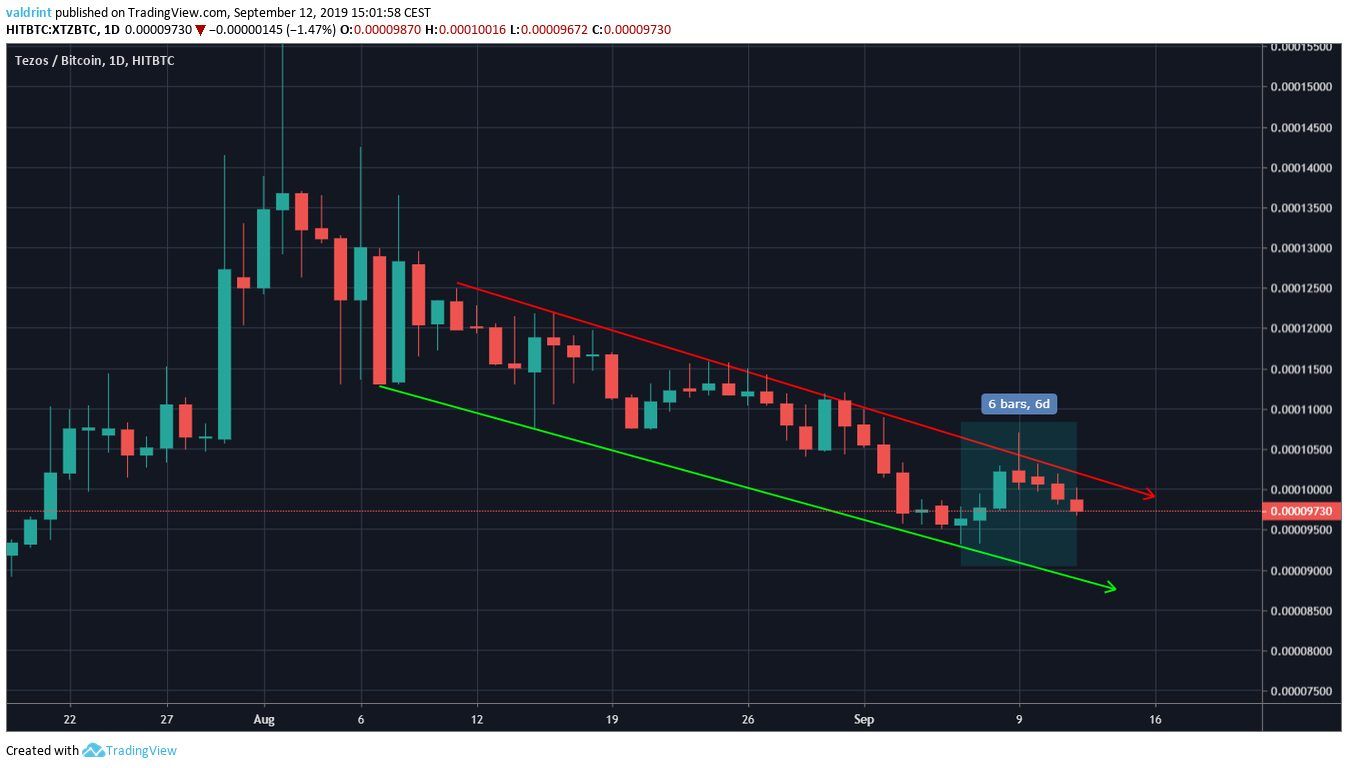
The descending channel is a neutral pattern, making a price breakout and breakdown equally likely.
Let’s take a look at technical indicators to determine which is more likely.
The Downtrend Will Continue?
A look at the daily moving averages (MA) suggests that XTZ is not yet done decreasing.
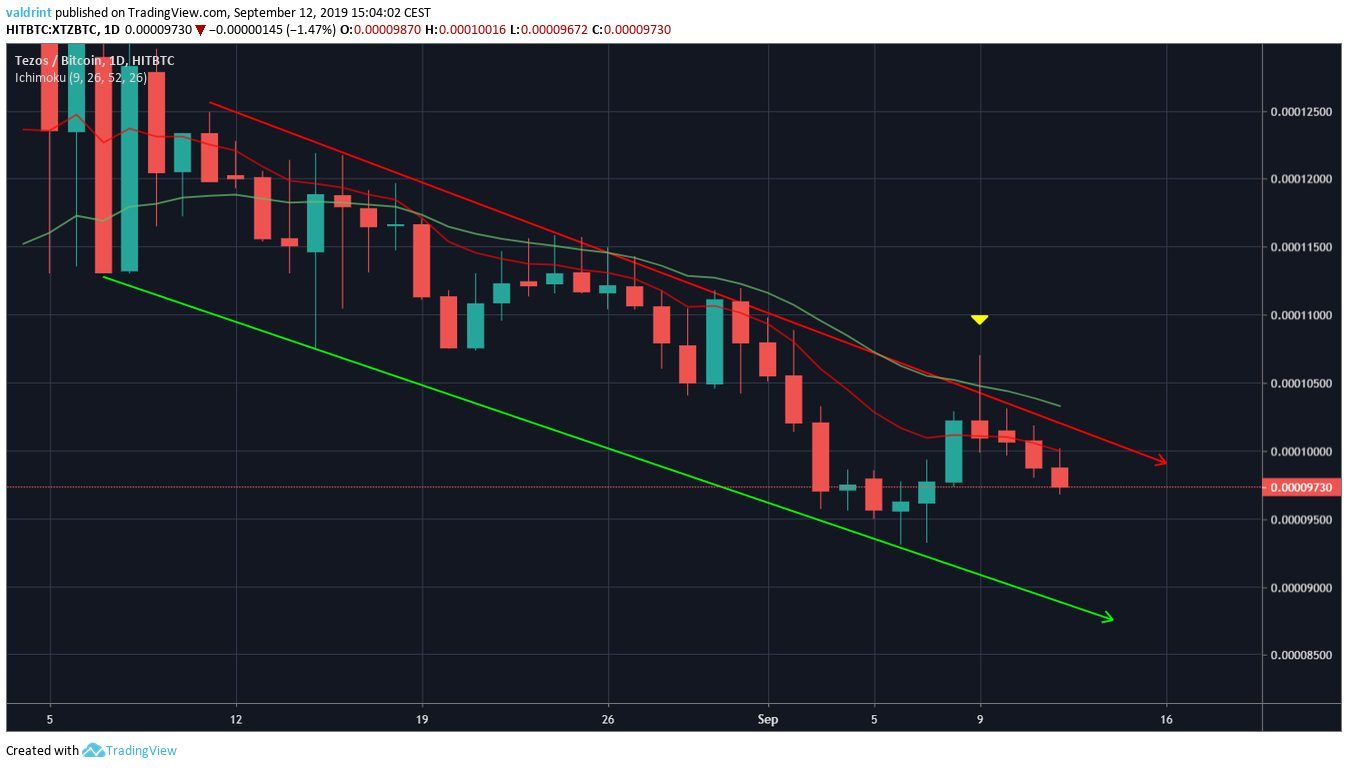
A bearish cross between the 10- and 20-day MAs transpired on August 19.
Since then, XTZ has been trading below both MAs.
Additionally, on September 9, it made an unsuccessful attempt at moving above the 20-day MA.
This created a bearish shooting star, which is often a reversal sign.
Furthermore, the MACD has just rejected a bullish cross and has begun to slope downward.
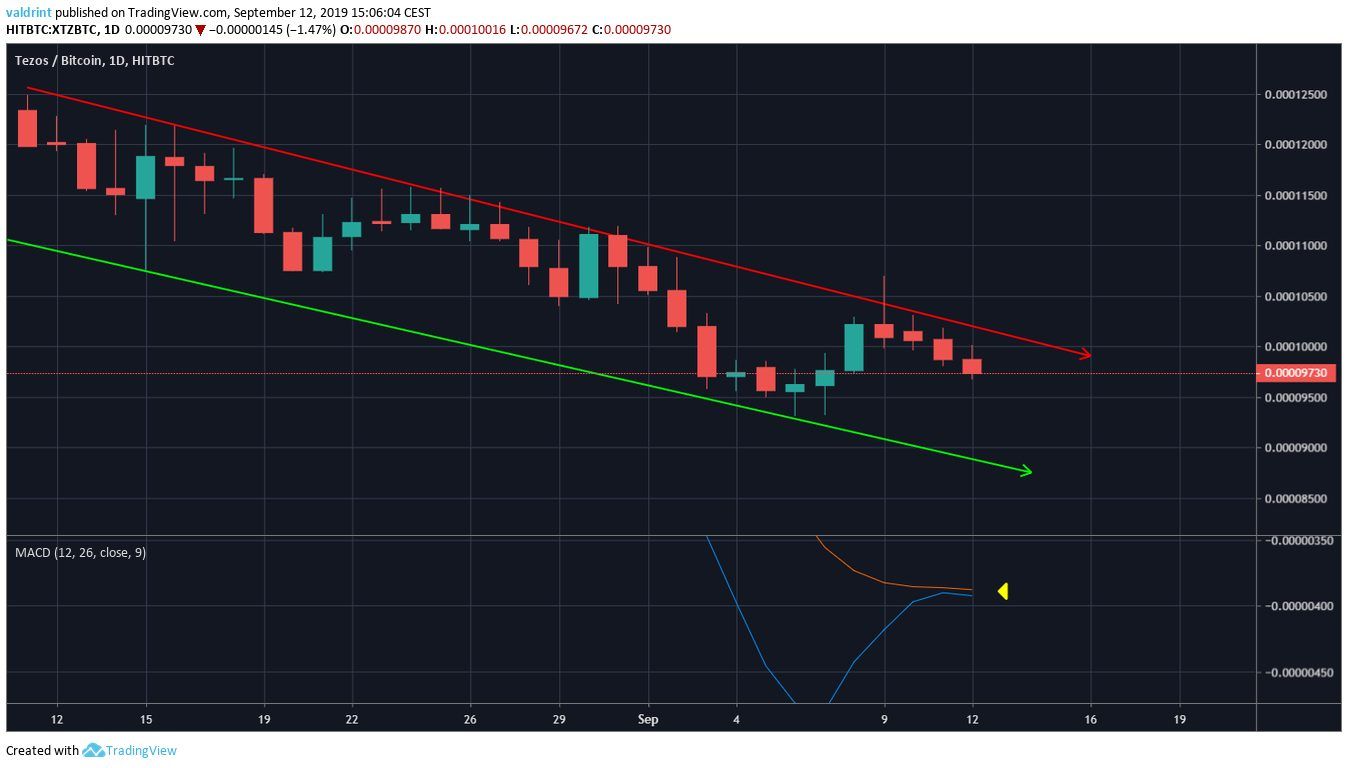
These two indicators and the creation of a bearish candle make us believe that the price will continue to decrease at the rate predicted by the channel.
If it does, where will it find support?
Support Areas
One support area is traced below:
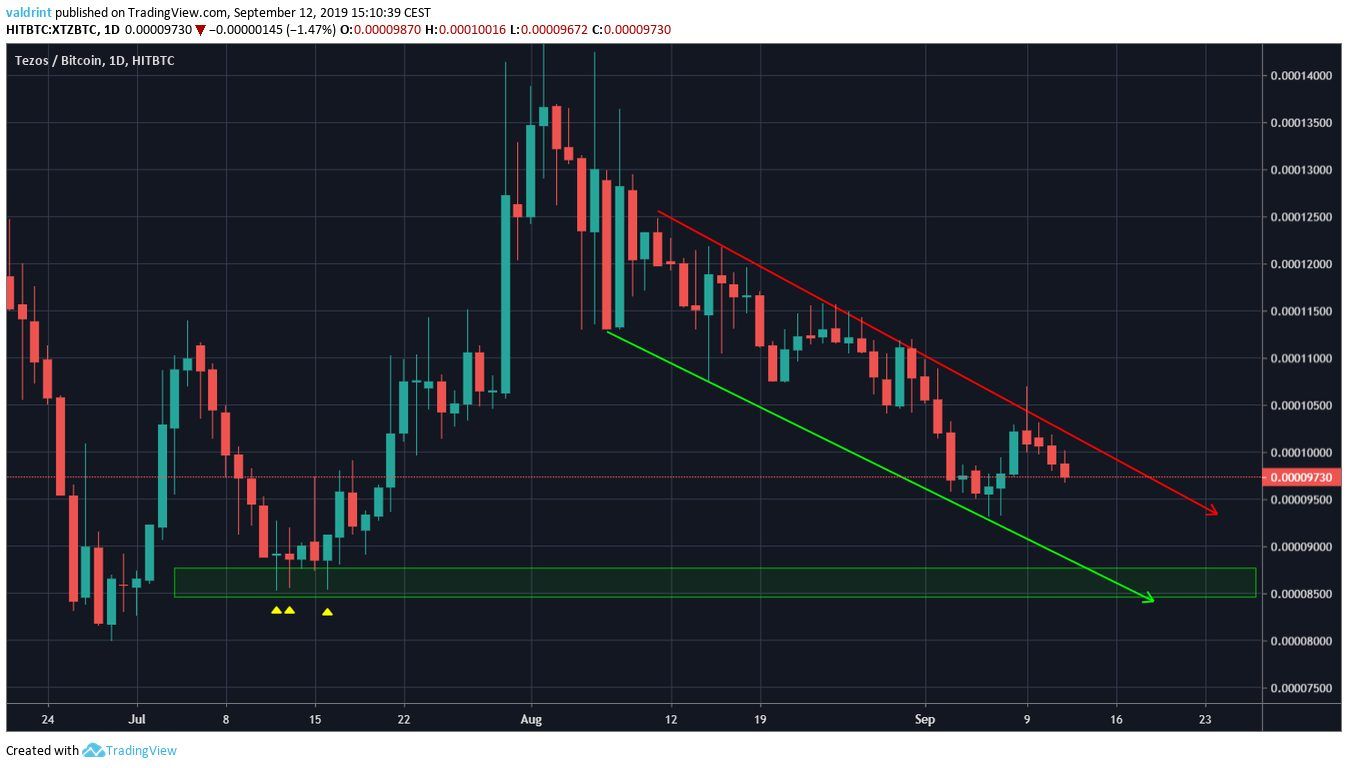
It is found at 8550 satoshis.
As is visible by the three long lower wicks, this level was the catalyst of the upward movement in July, which eventually caused XTZ to reach levels above 14,000 satoshis.
If the price continues to decrease at the rate predicted by the channel, it should reach it on September 18-20.
Tezos Price Summary
XTZ has been trading inside a descending channel.
According to our analysis, it is likely to continue decreasing within the confines of the channel.
For hypothetical trading purposes, we have a neutral view towards XTZ.
If the price reaches 8500 satoshis, the possibility of buying could be considered depending on the presence of reversal signs.
Do you think XTZ will reach the support area? Let us know in the comments below.
Disclaimer: This article is not trading advice and should not be construed as such. Always consult a trained financial professional before investing in cryptocurrencies, as the market is particularly volatile.
Images are courtesy of Shutterstock, TradingView
