

Tellor (TRB) and Waltonchain (WTC) have both just broken out from important resistance areas. The latter is slightly ahead in its breakout cycle.
Technical indicators are bullish for both Tellor and Waltonchain, suggesting that their upward movements are expected to continue in the near future.
Tellor (TRB)
TRB had been following a descending resistance line since September 2020. Previously, it made four unsuccessful breakout attempts before finally moving above it on Jan. 12, 2021.
Afterward, TRB validated the line as support (shown with the green arrow below) and has been moving upwards since.
TRB has also reclaimed the horizontal $34.50 resistance area, which is now likely to act as support.
Technical indicators are bullish, supporting the continuation of the upward move.
If so, the closest resistance areas would be found at $56 and $66.50 (0.5 and 0.618 Fib retracement levels).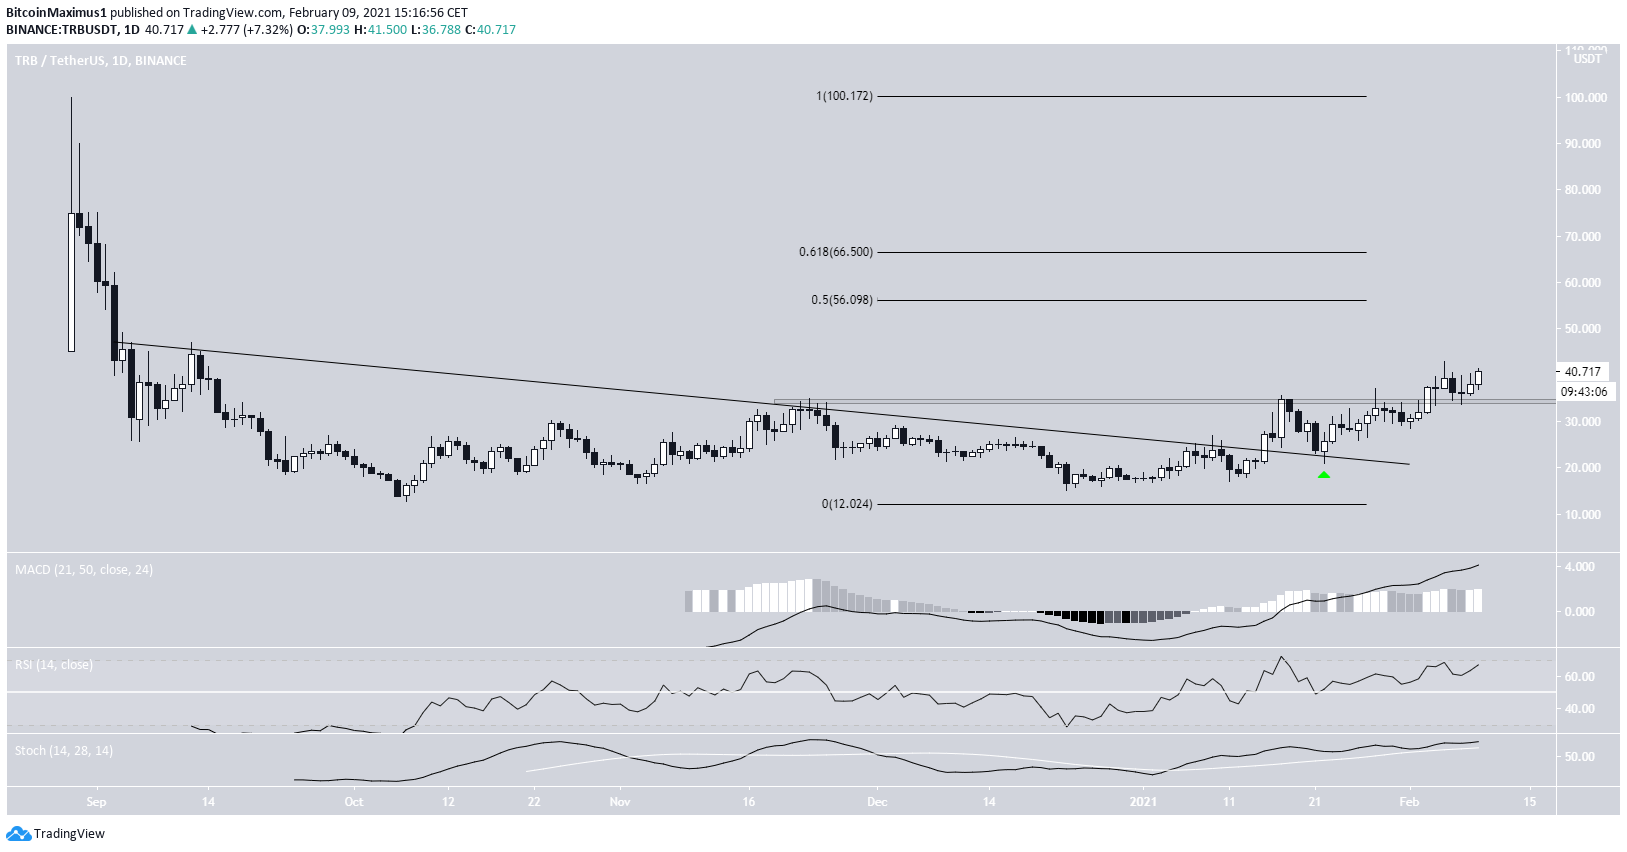 TRB Chart By TradingView
Cryptocurrency trader @jjcycles outlined a TRB/BTC chart, stating that it’s likely to move upwards towards 2,200 satoshis once it breaks out from the current resistance area.
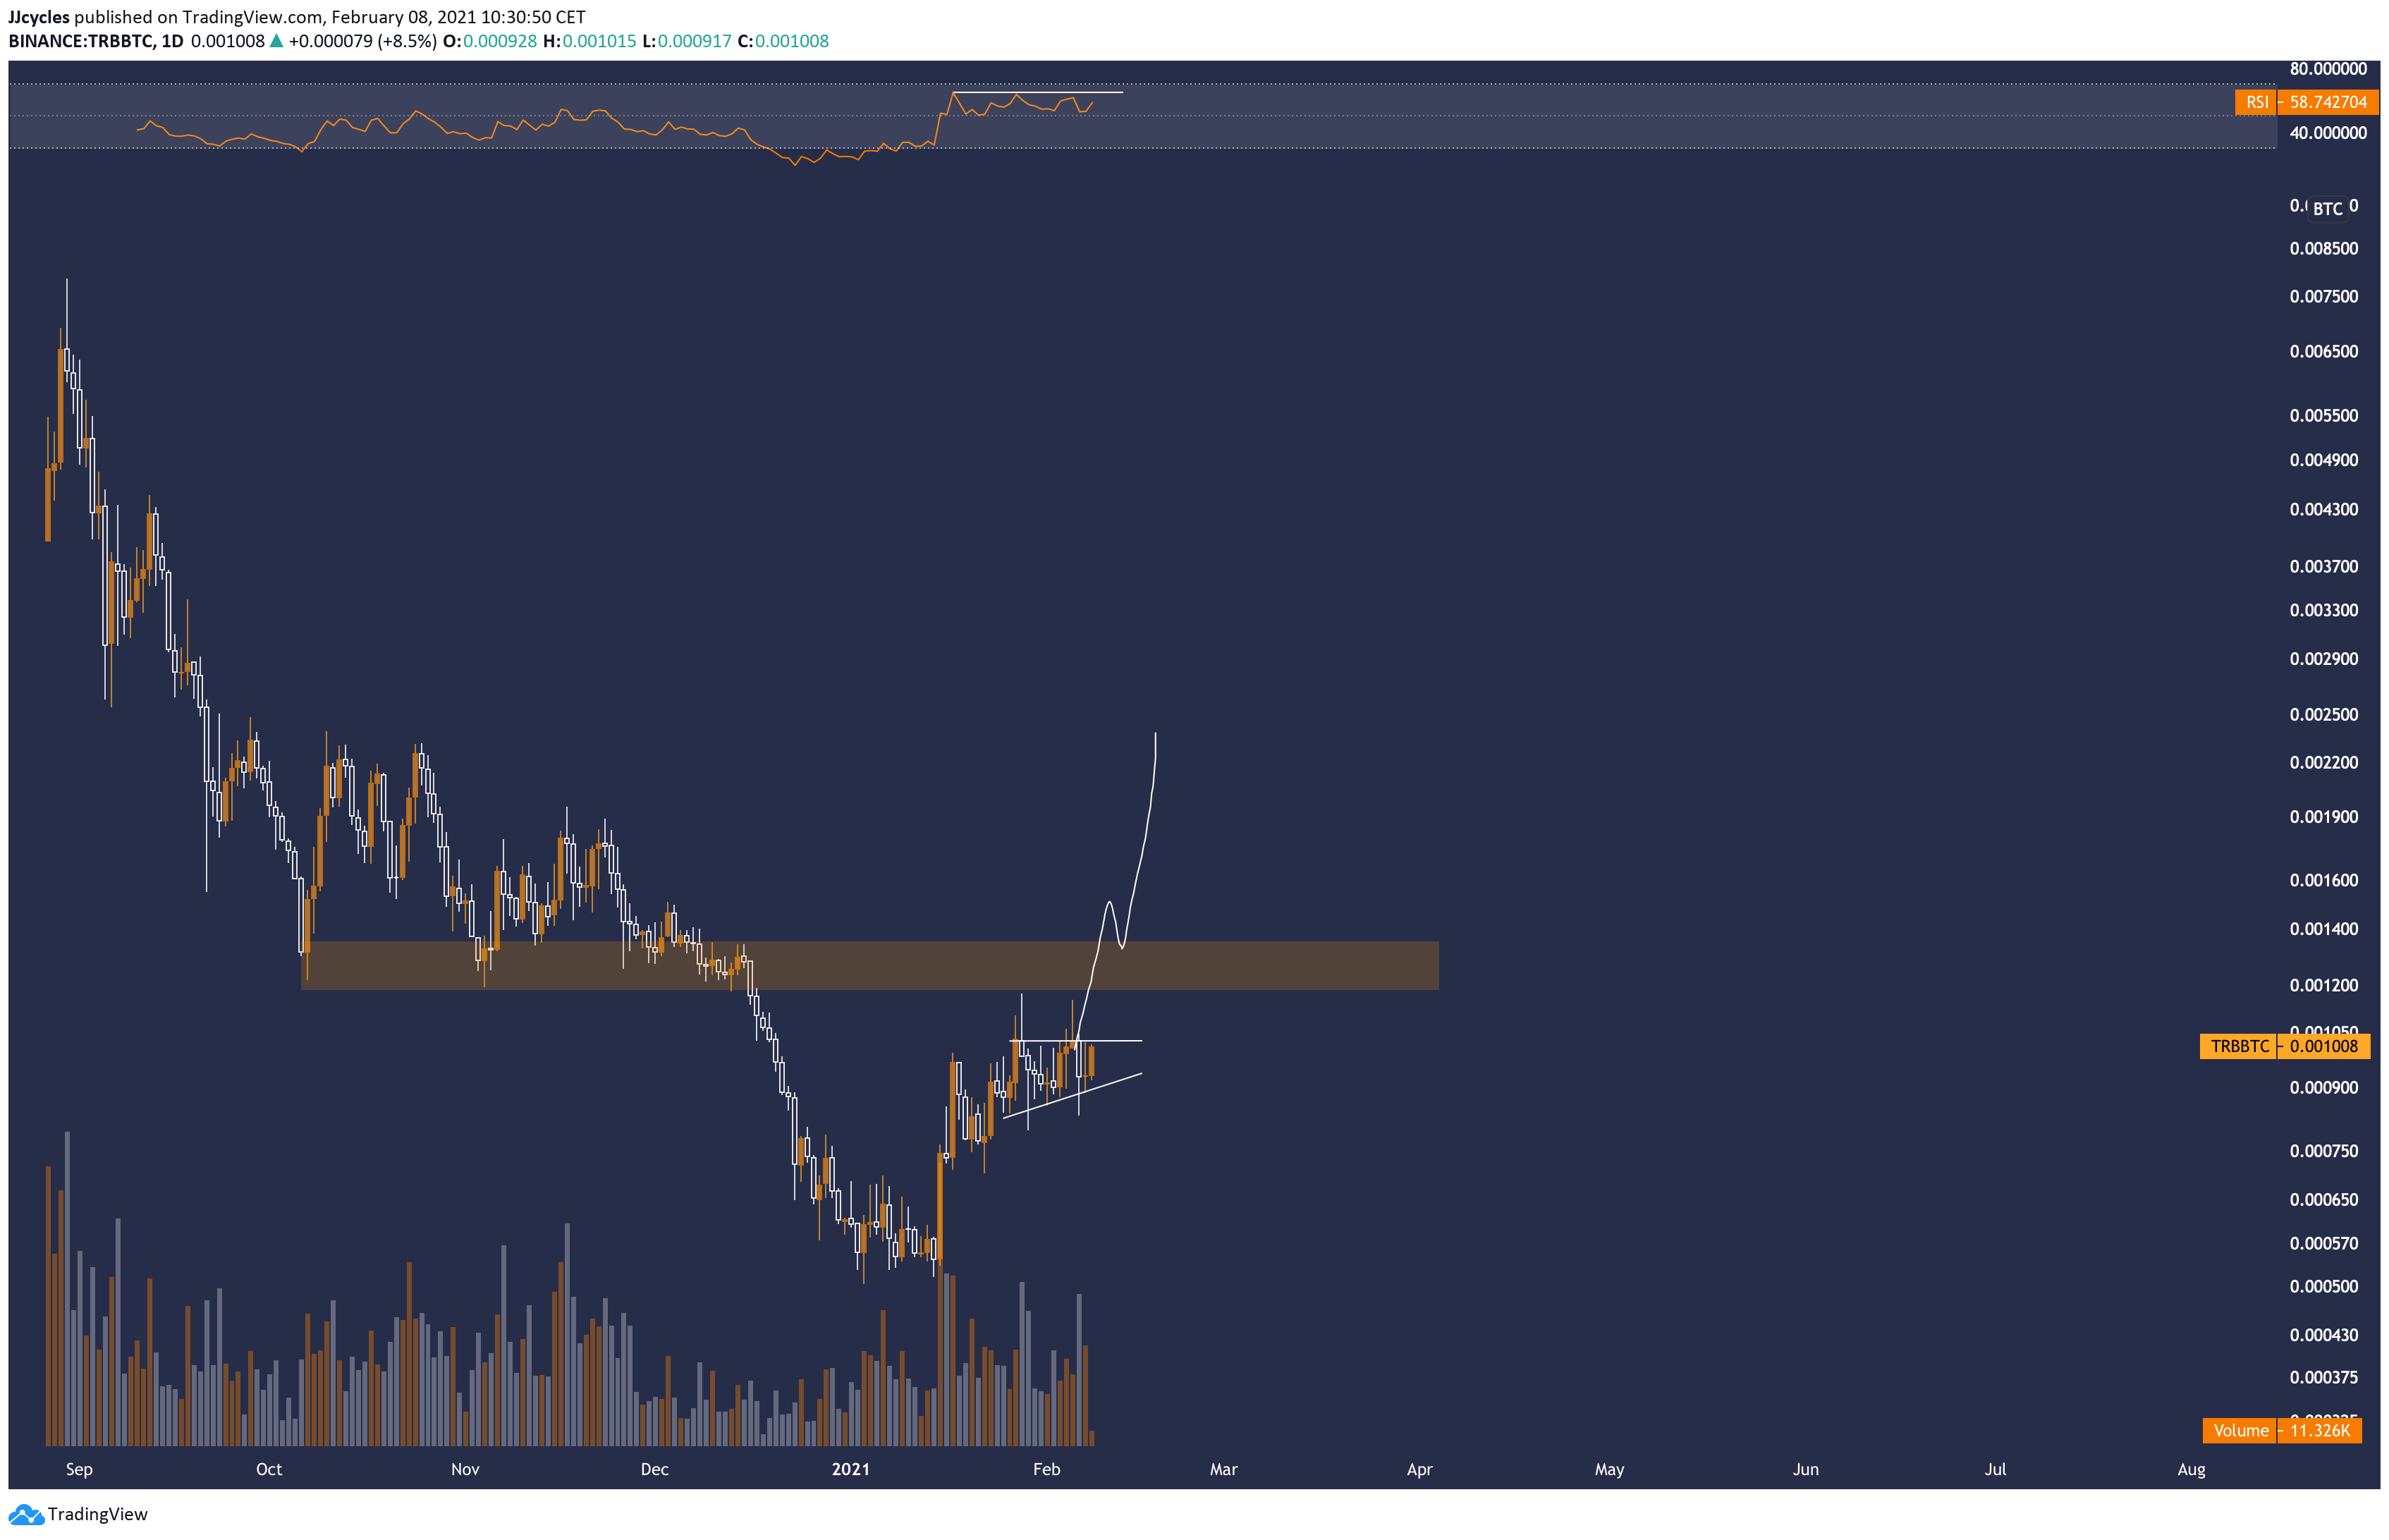
Since the tweet, TRB has resumed its consolidation just below the 900 satoshi level.
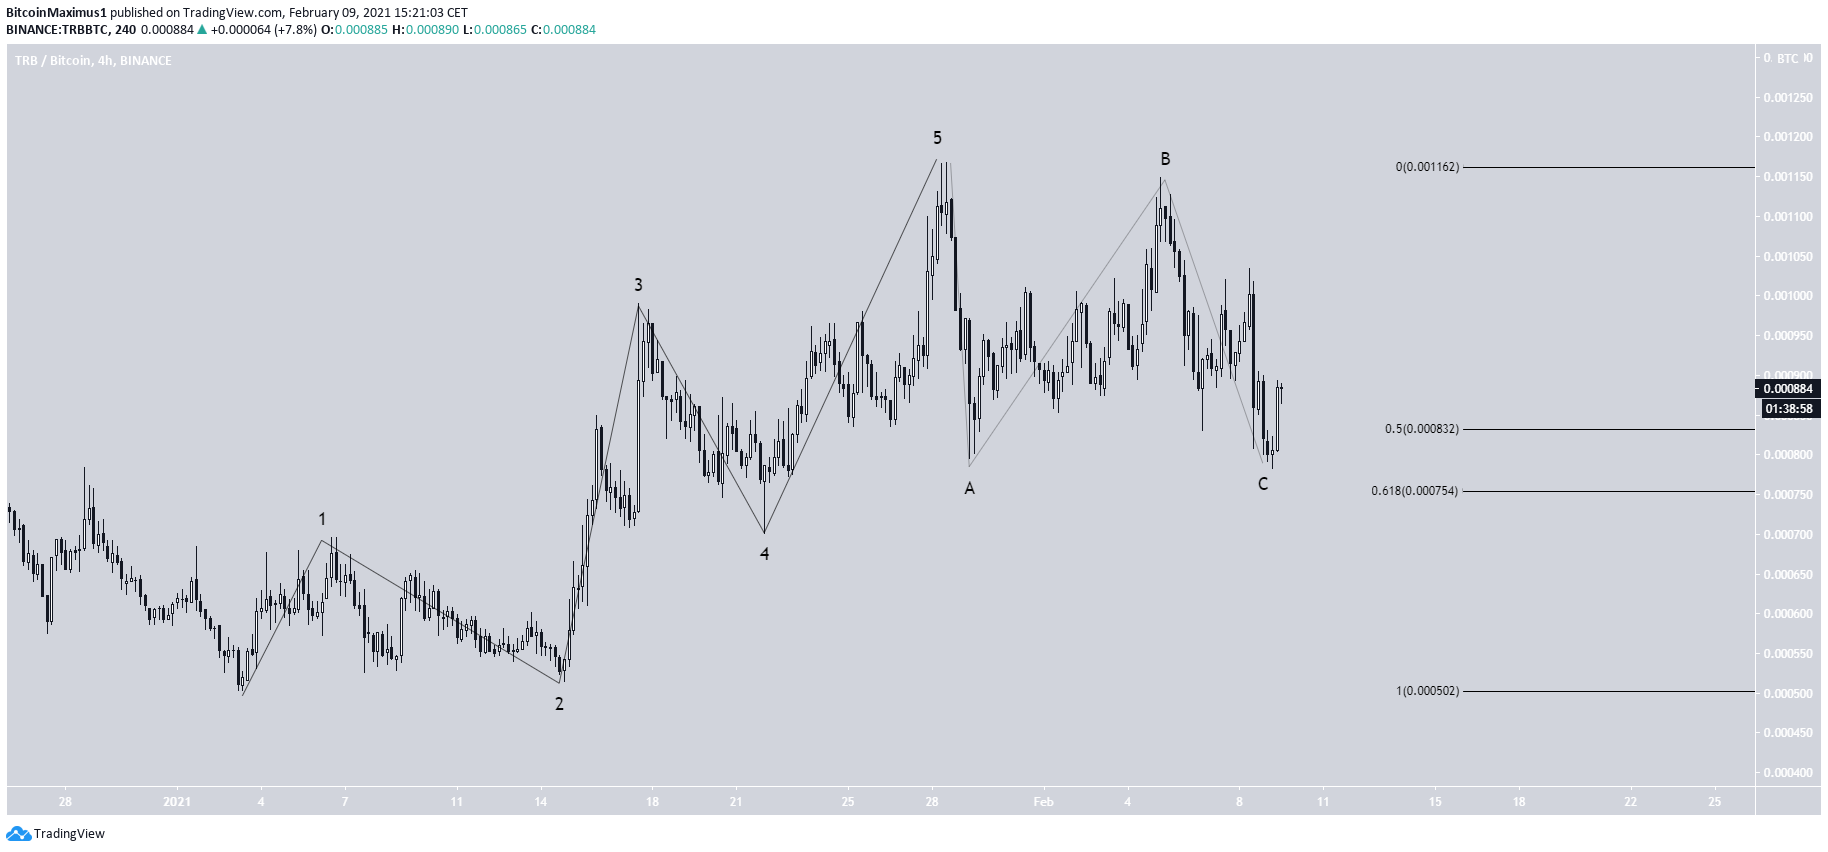
In addition, it seems that TRB has completed an A-B-C corrective structure, and is now likely to resume its upward movement as outlined in the tweet.
This also fits with the readings from the TRB/USD pair.
WaltonChain (WTC)
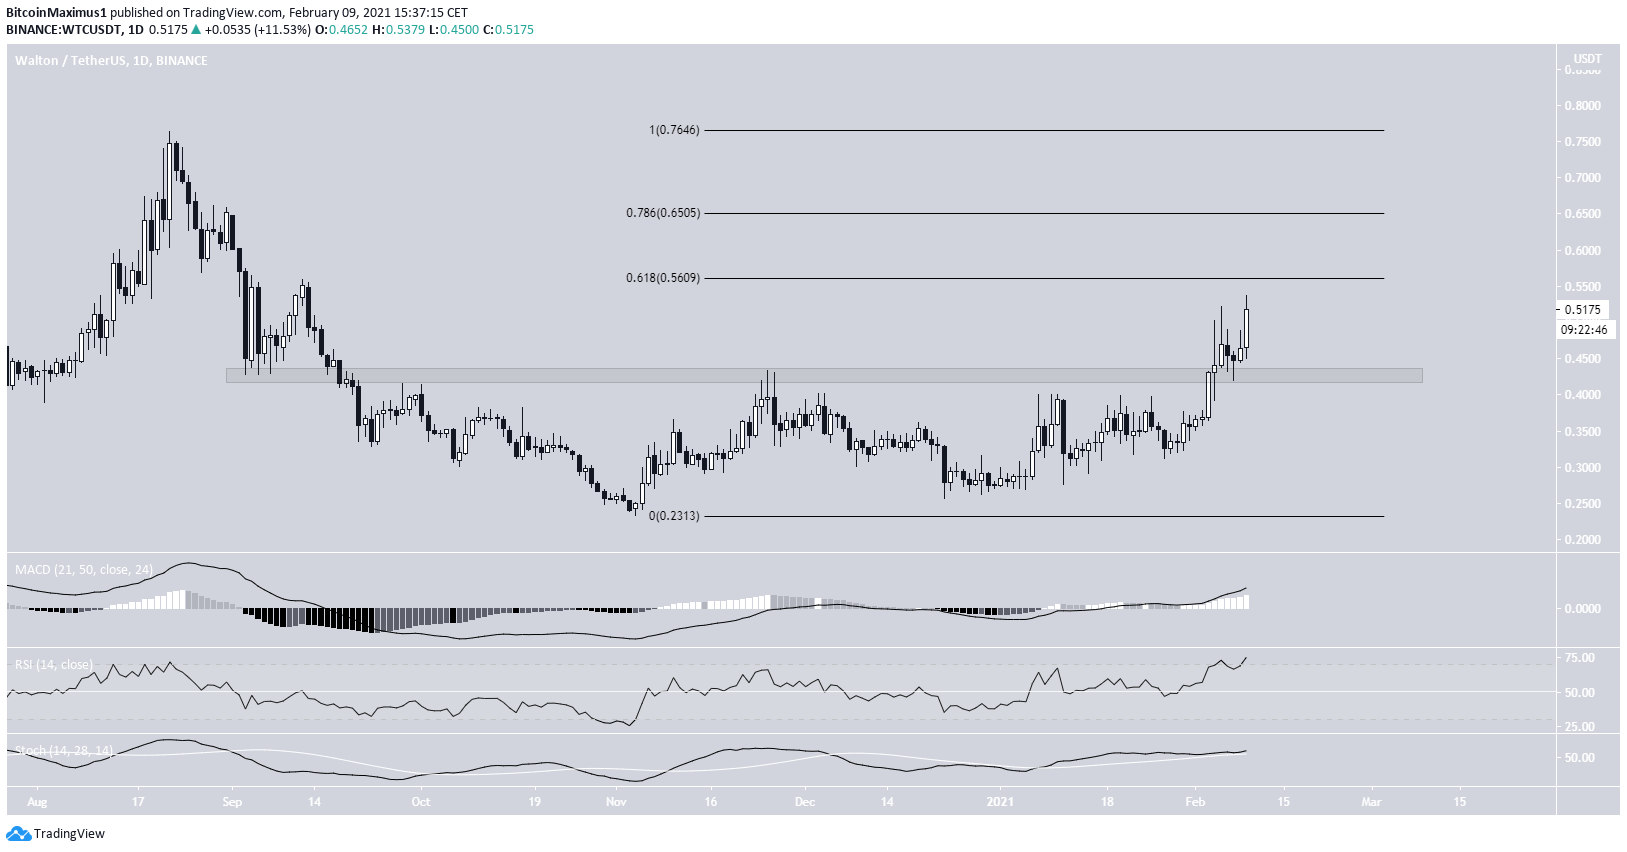
The daily chart for WTC shows similar movements. WTC has broken out from the $0.425 resistance area, which had previously been in place since September 2020.
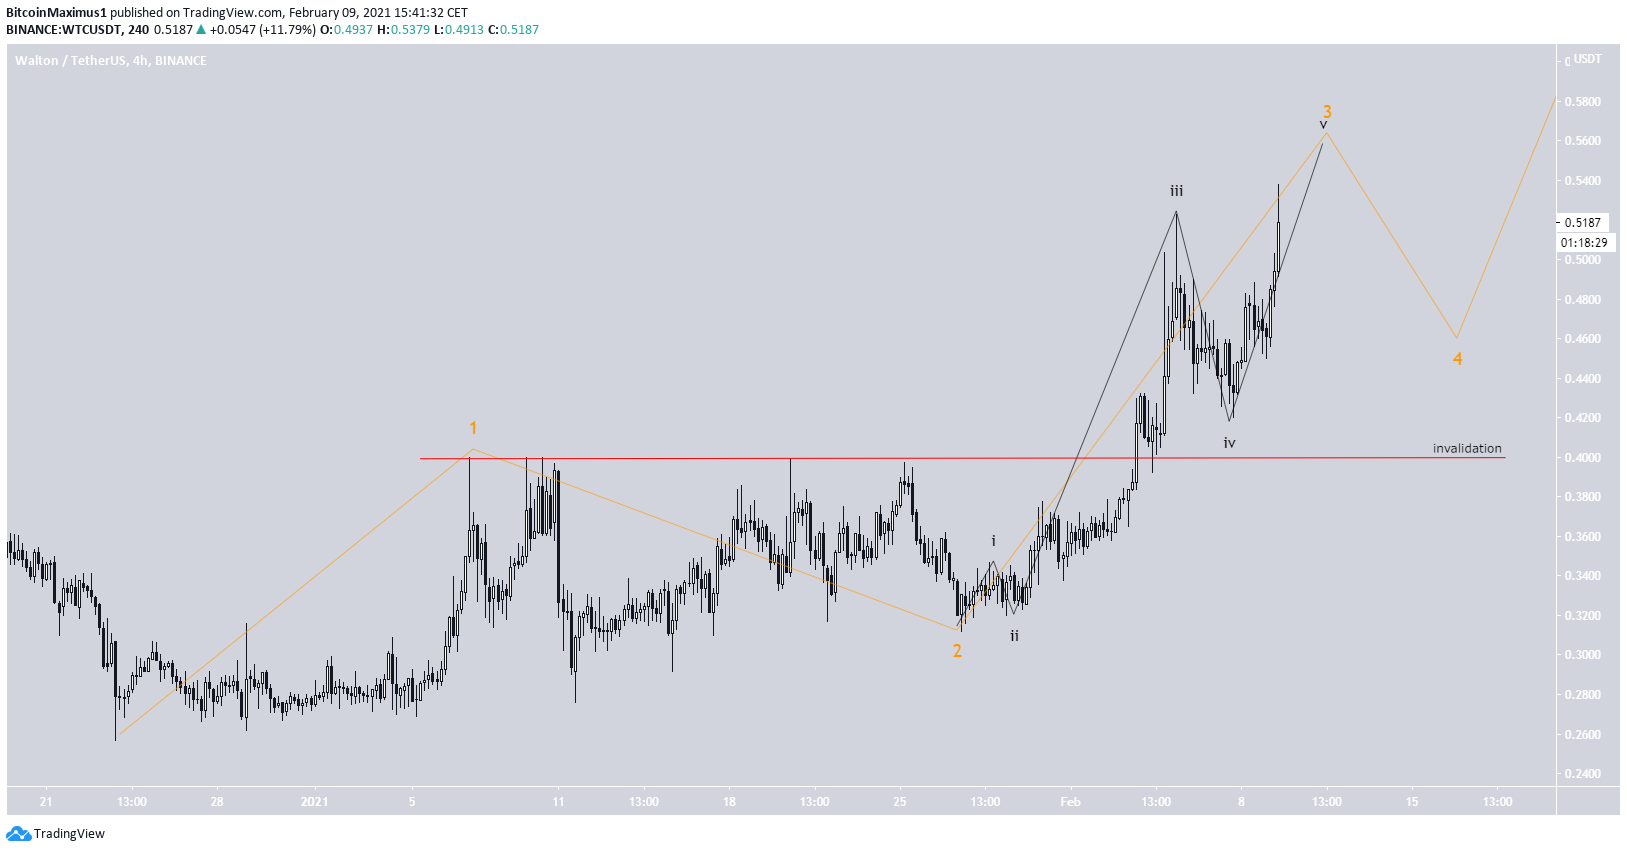
The main difference in relation to TRB is that WTC has already reached the 0.5 Fib retracement level, and is approaching the 0.618 Fib found at $0.56. This is also a horizontal resistance area.
Technical indicators are bullish, supporting the continuation of the upward move.
The wave count suggests that WTC is in wave three (orange) of a bullish impulse that began on Jan. 22. The sub-wave count is shown in black.
A decrease below the wave one high of $0.40 (red line) would invalidate this particular wave count.
Conclusion
After reclaiming their respective resistance areas, both TRB and WTC are expected to continue increasing and make an attempt at reaching their all-time high prices in the process.
For BeInCrypto’s latest Bitcoin (BTC) analysis, click here
Disclaimer
In line with the Trust Project guidelines, this price analysis article is for informational purposes only and should not be considered financial or investment advice. BeInCrypto is committed to accurate, unbiased reporting, but market conditions are subject to change without notice. Always conduct your own research and consult with a professional before making any financial decisions. Please note that our Terms and Conditions, Privacy Policy, and Disclaimers have been updated.
