


Tellor (TRB) decreased considerably in May but validated a long-term ascending support line with its subsequent bounce.
It has broken out from a short-term descending resistance line and is now in the process of creating a bullish structure.
TRB drops to support
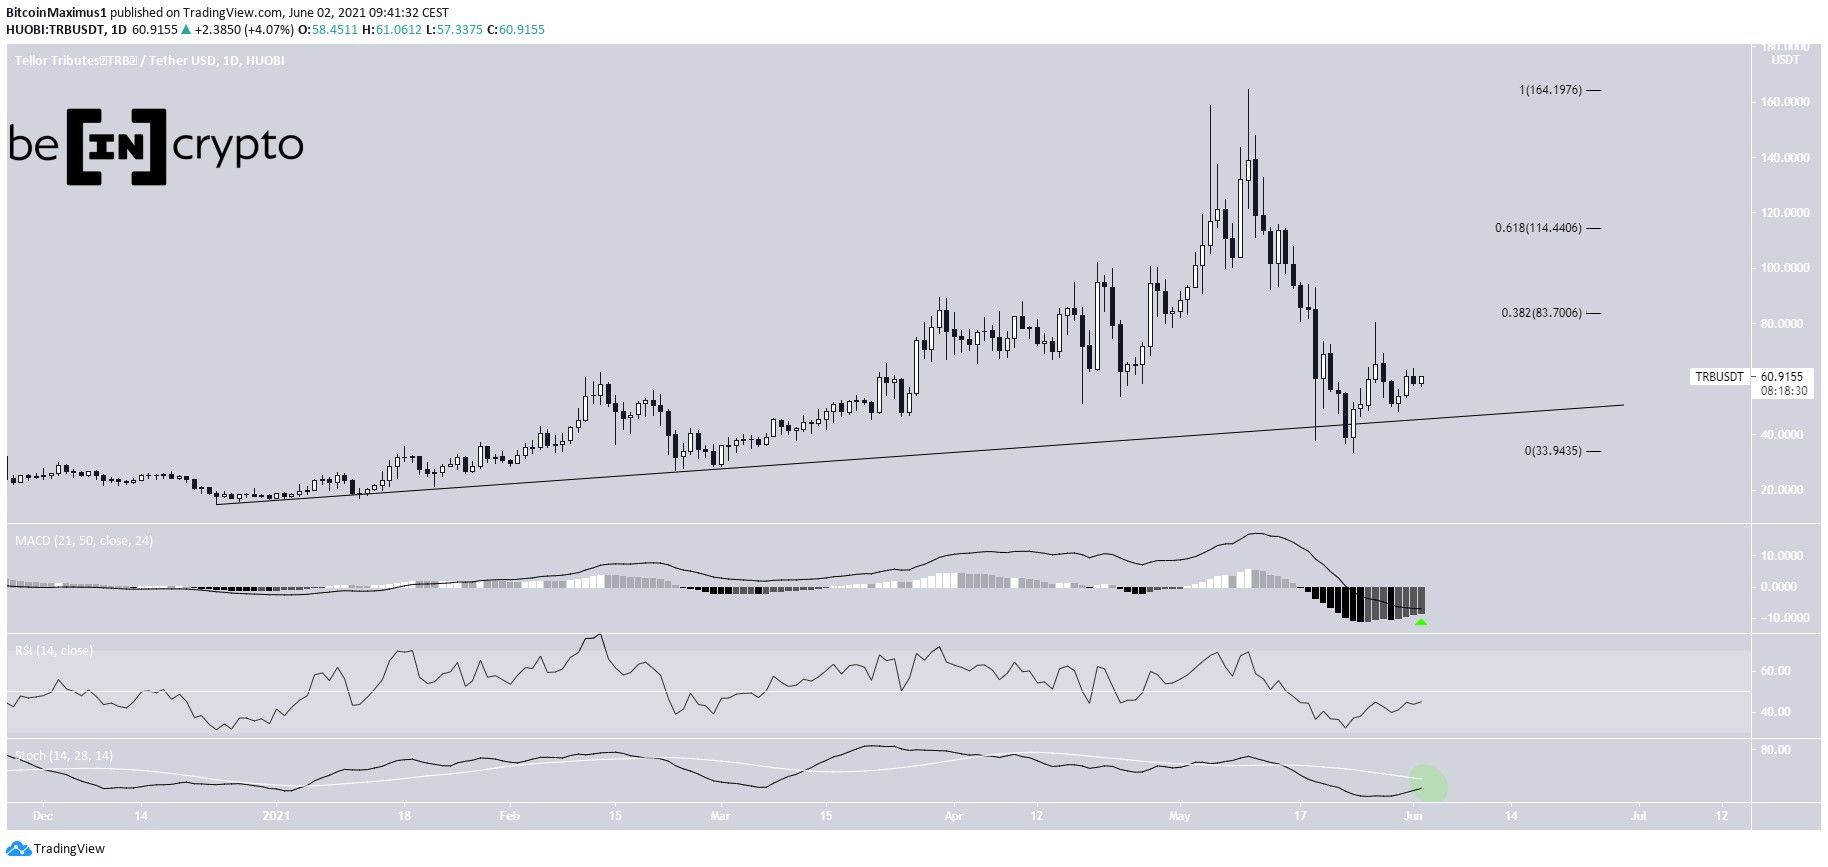
TRB had been decreasing since reaching an all-time high price of $164.49 on May 10. The decrease was swift, leading to a low of $33.66 on May 24.
However, this caused the fourth validation of an ascending support line that has been in place since December 2020. As long as TRB is trading above this line, the trend can be considered bullish.
Furthermore, technical indicators are showing bullish signs. The MACD has given a bullish reversal signal and both the RSI and Stochastic oscillator are increasing. The former is close to moving above 50 while the latter is close to making a bullish cross (green circle).
The closest resistance areas are found at $84 and $114. These are the 0.382 and 0.618 Fib retracement levels.
So far, TRB has been rejected by the former and is in the process of making another breakout attempt.
Short-term breakout
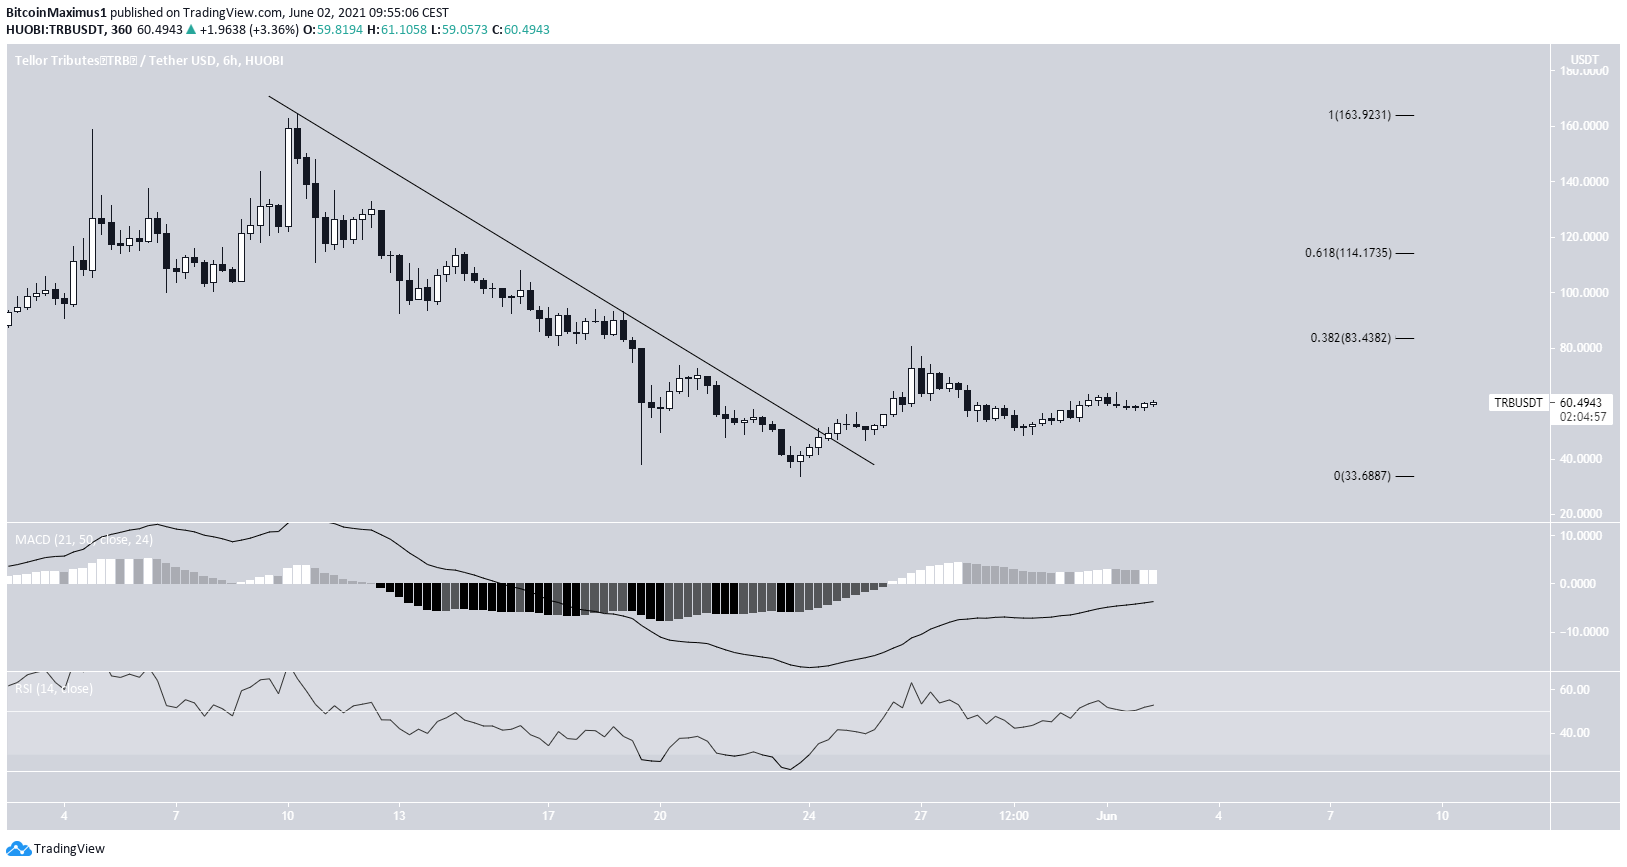
The six-hour chart shows that TRB has broken out from a descending resistance line that has been in place since the previously mentioned all-time high.
Furthermore, both the MACD and RSI support the continuation of the upward movement.
If TRB manages to clear the $84 resistance area, it’s likely to increase at an accelerated rate.
TRB/BTC
Cryptocurrency trader @JJCycles outlined a TRB/BTC chart that shows a bounce at a strong support area and projecting an upward movement.
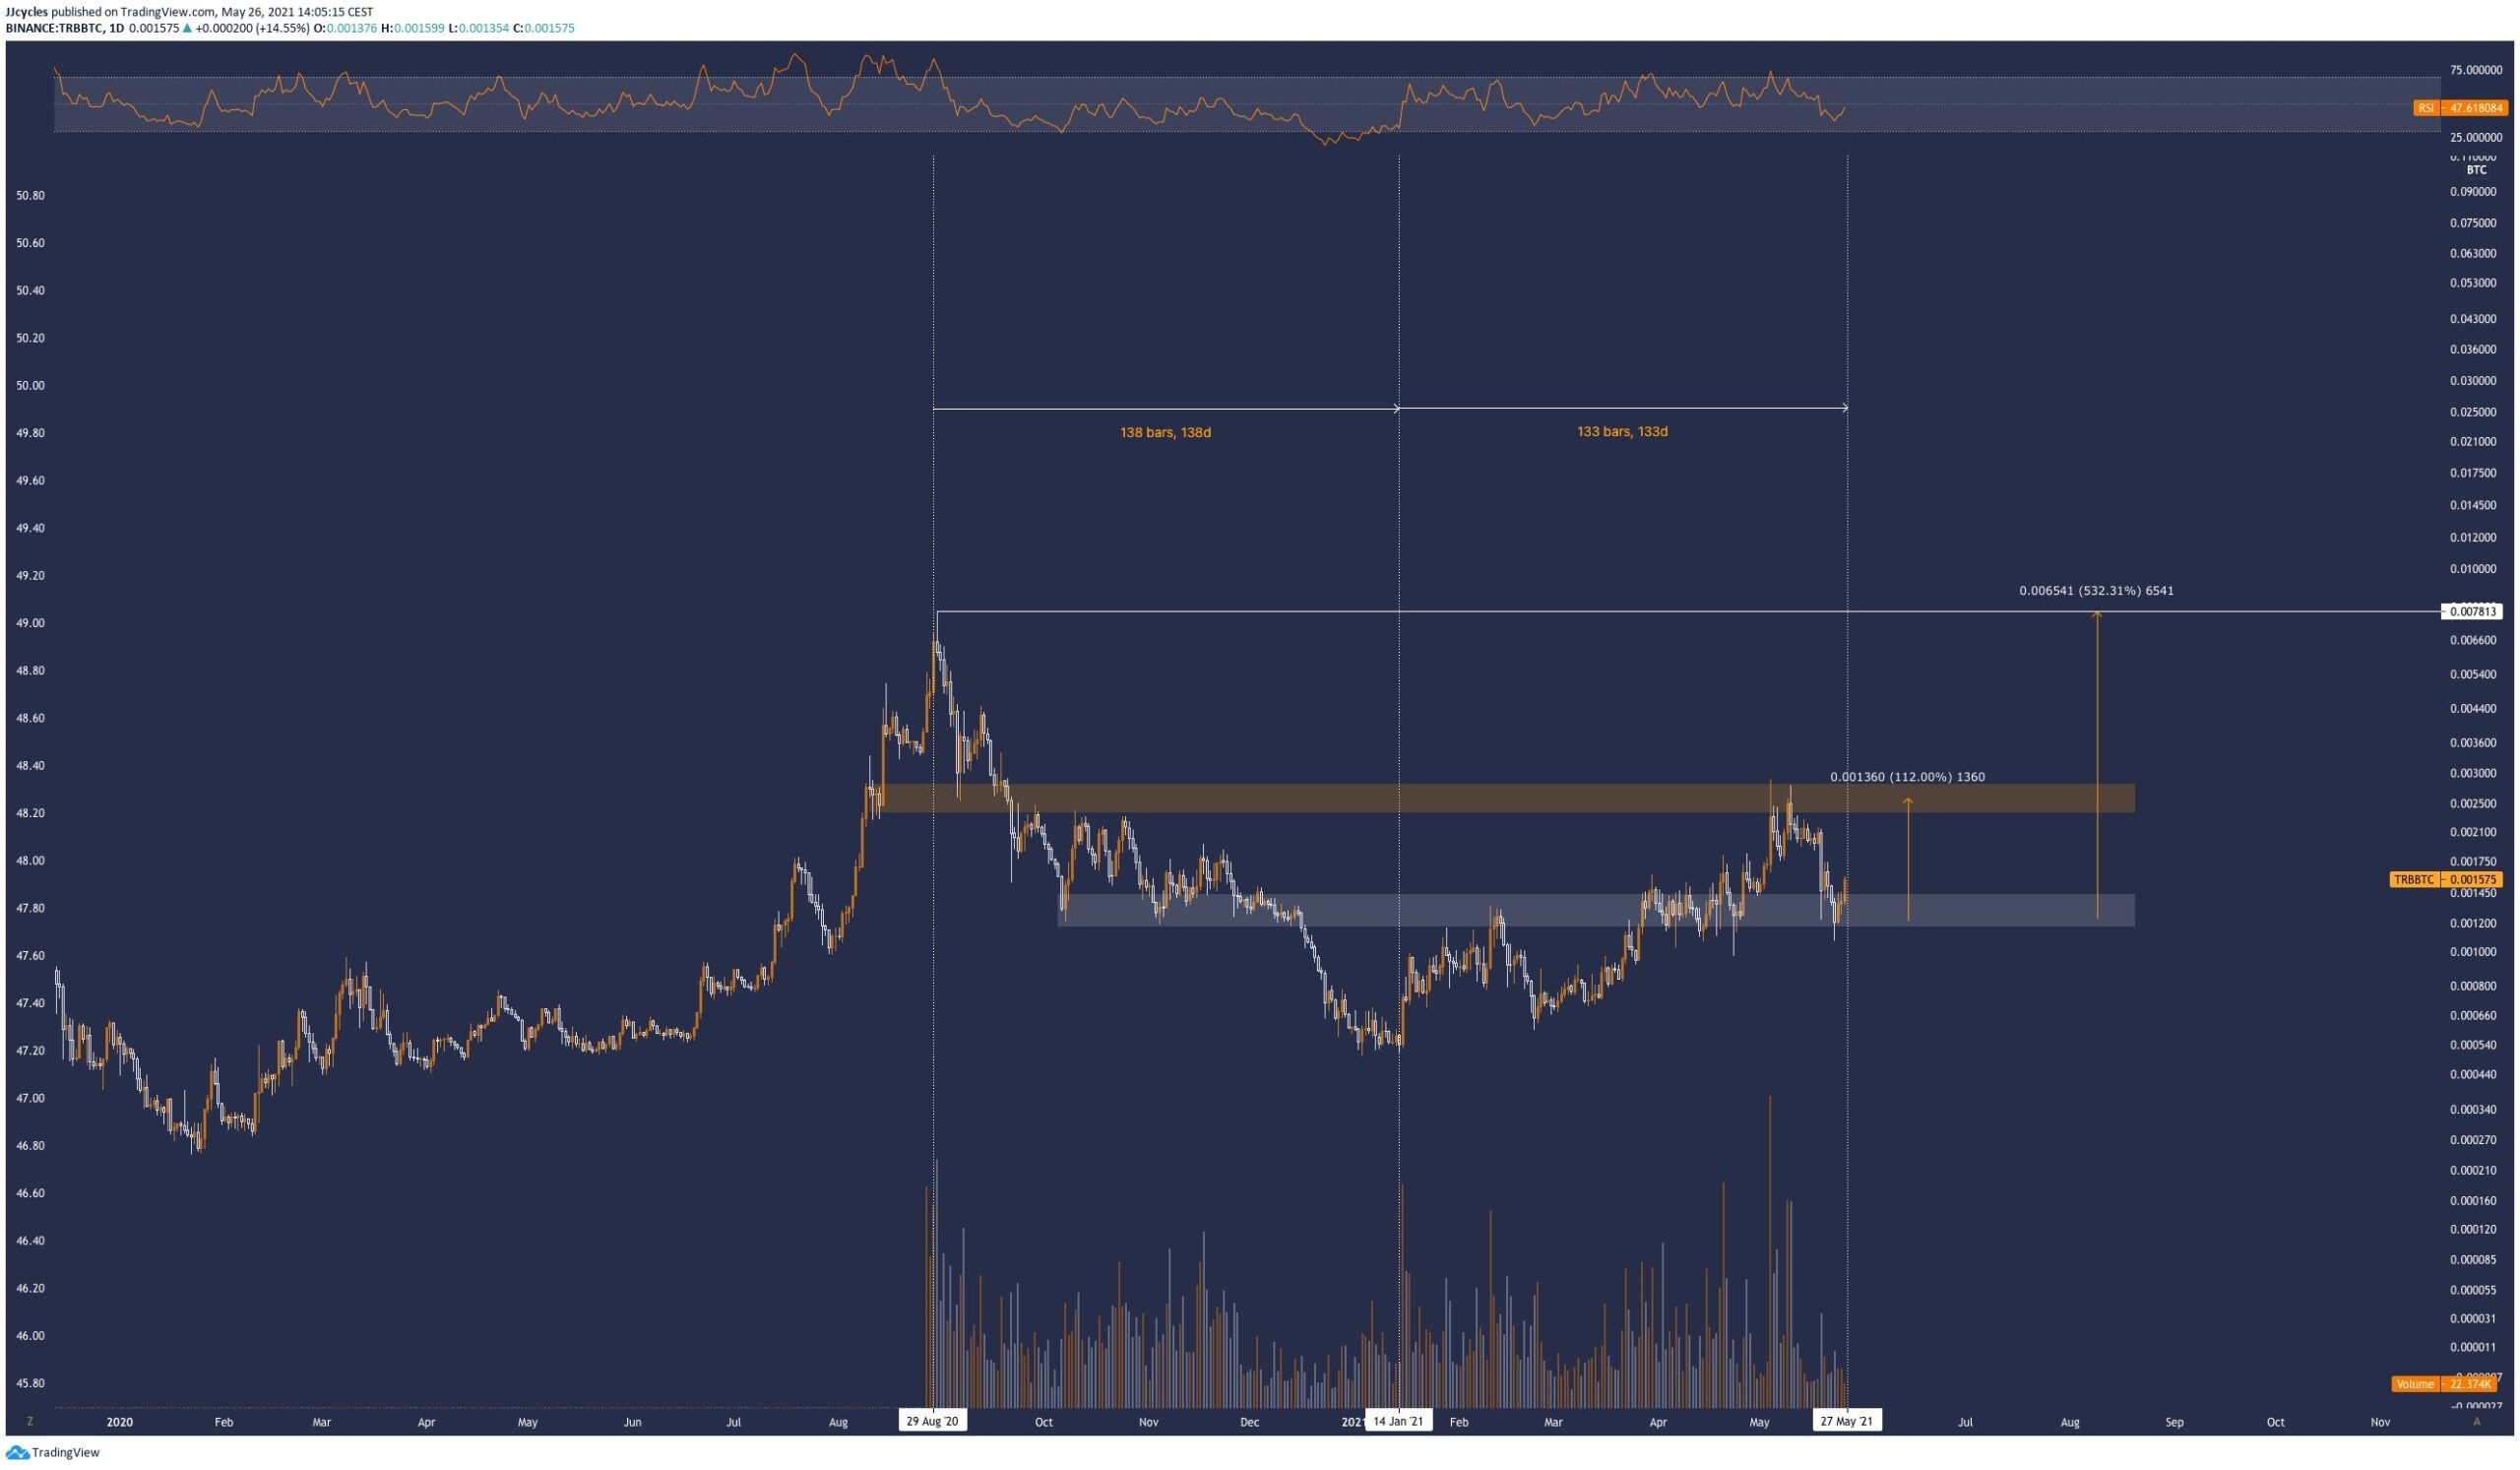
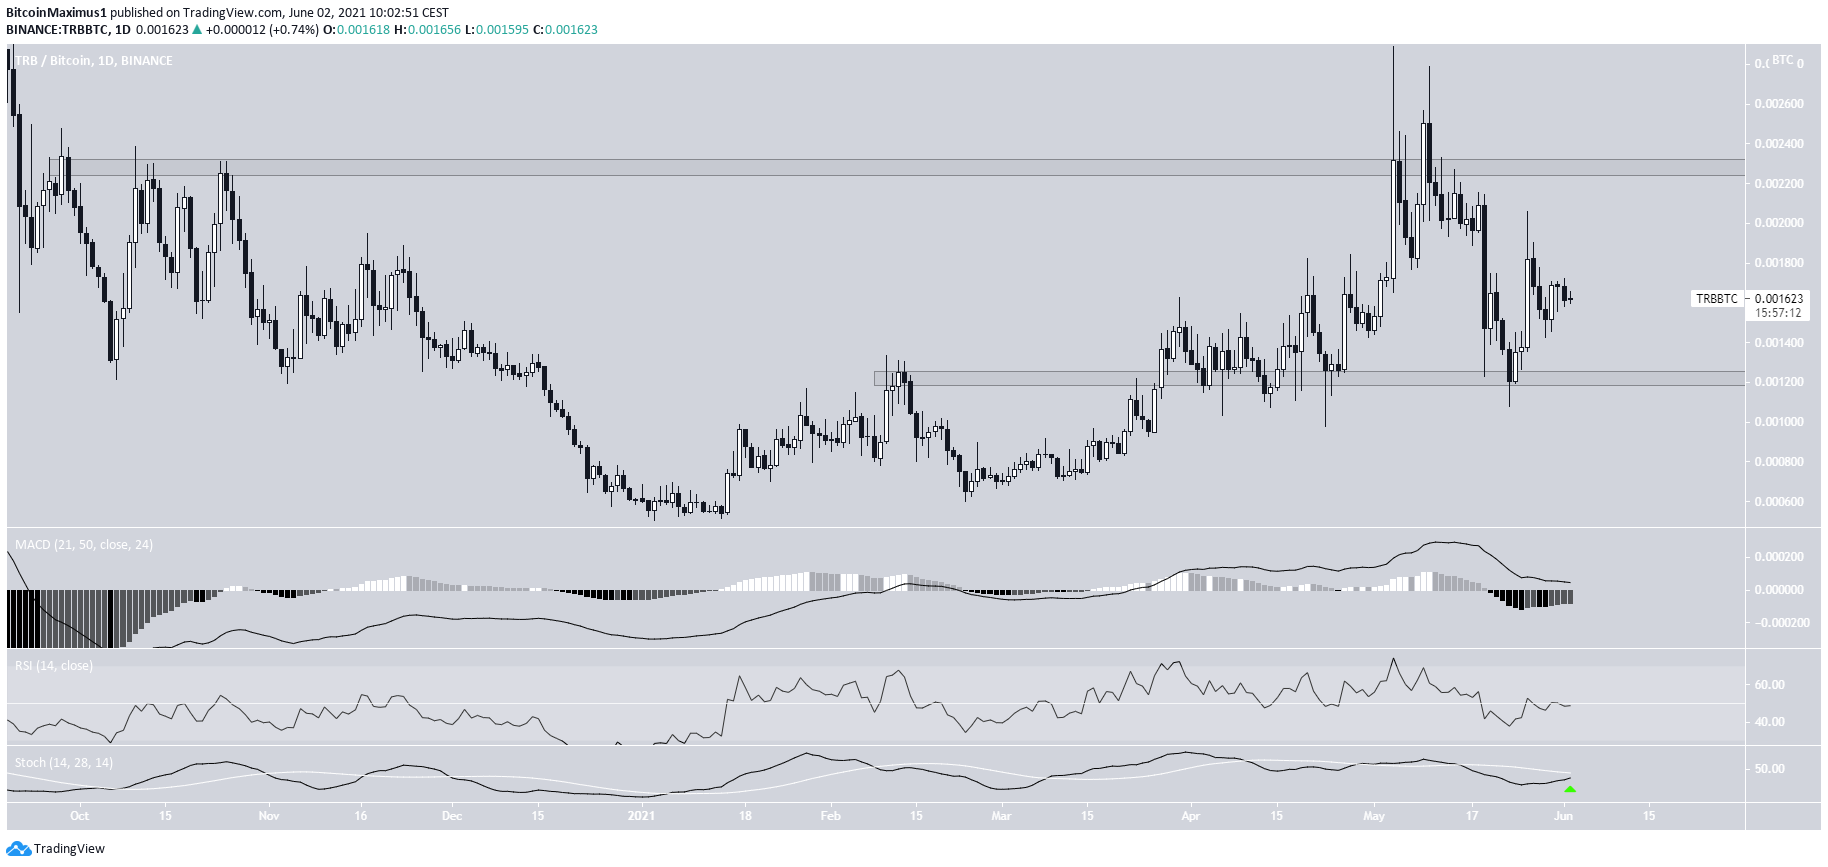
The TRB/BTC chart is similar to its USD counterpart. However, instead of bouncing at an ascending support line, it bounced at a horizontal support area found at 0.0012 satoshis.
Similarly, technical indicators are gradually turning bullish, as evident by the bullish cross in the Stochastic oscillator.
The closest resistance area is found at 0.0023 sats. A breakout above this level could trigger an accelerated upward movement towards a new all-time high price.
For BeInCrypto’s previous bitcoin (BTC) analysis, click here.


