

The Tellor (TRB) price is in the process of breaking out from a horizontal resistance level at $26. The price is expected to be successful in breaking out and eventually move towards the next closest resistance level.
With the exception of a short deviation on Oct 24, the TRB price has been trading below the $26 resistance area.
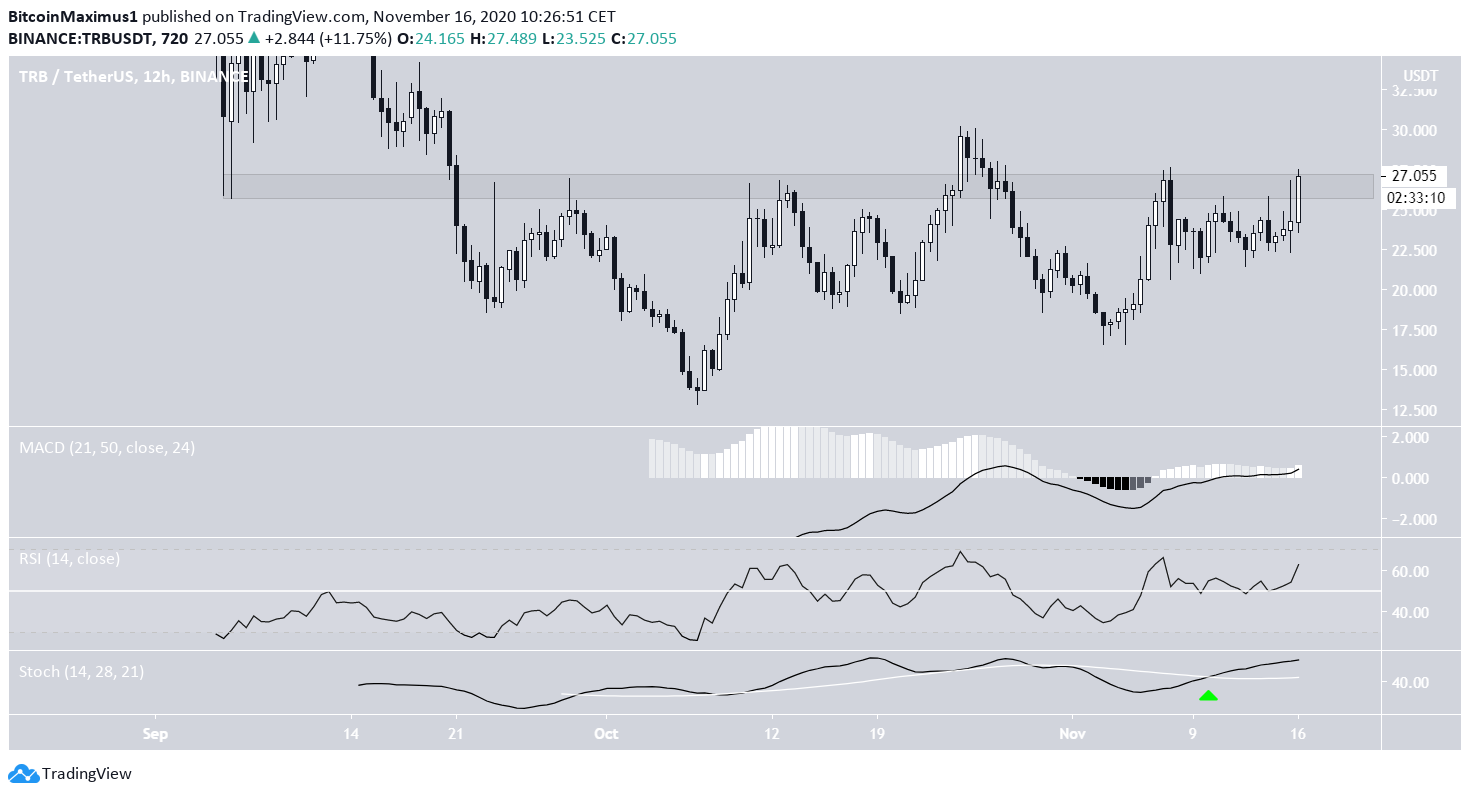
TRB Sends Bullish Signals
Despite this resistance, the price action from the Oct 7 all-time low of $12.78 seems bullish. The price has created a higher low and continued its increase since then. At the time of press, TRB had crossed above the $26 resistance and is trading for $27.47. The next significant resistance level is found at $46.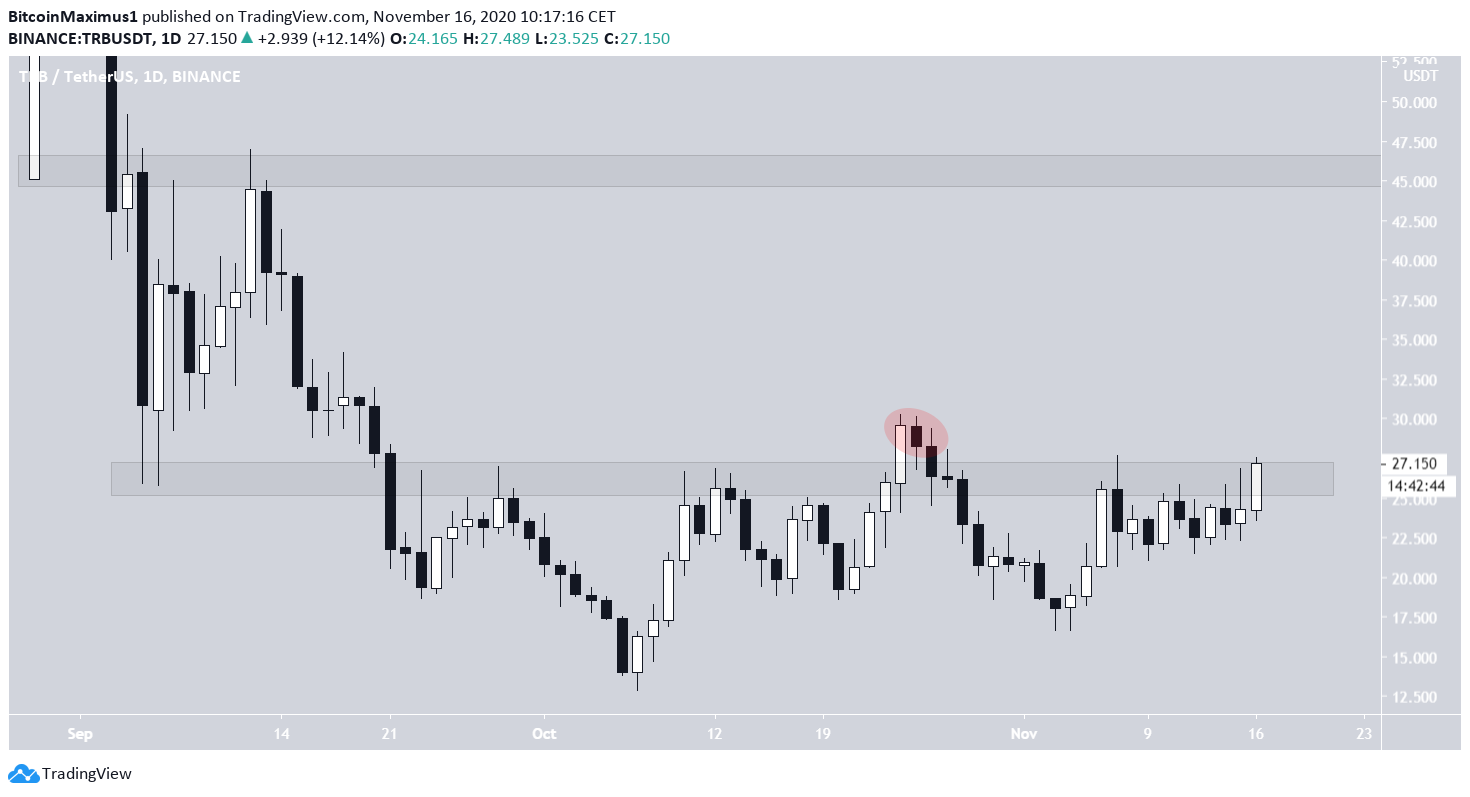
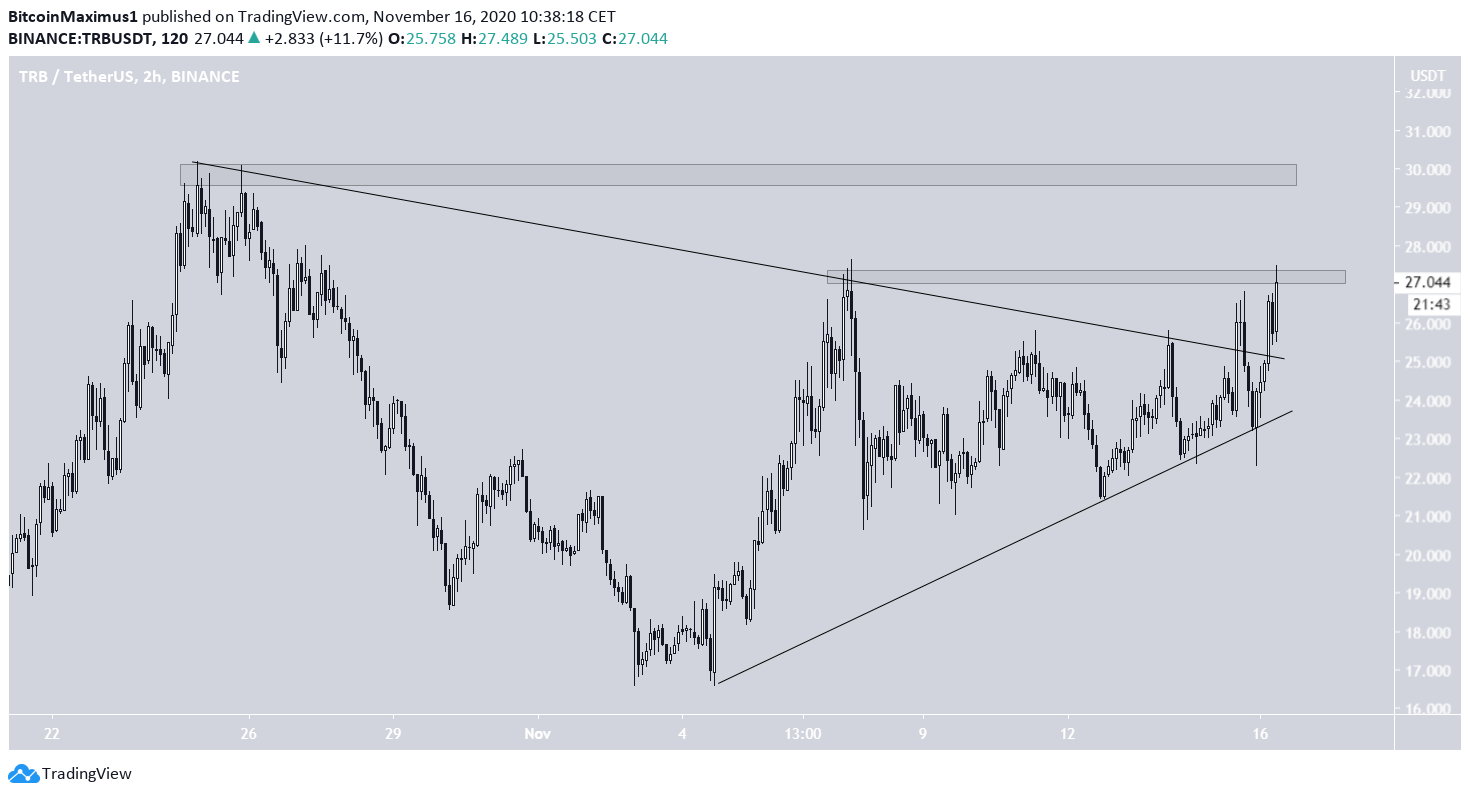
Short-Term Movement
Cryptocurrency trader @CryptoNewton outlined a short-term TRB chart, stating that he believes the price will soon break out from the current symmetrical triangle to target $30.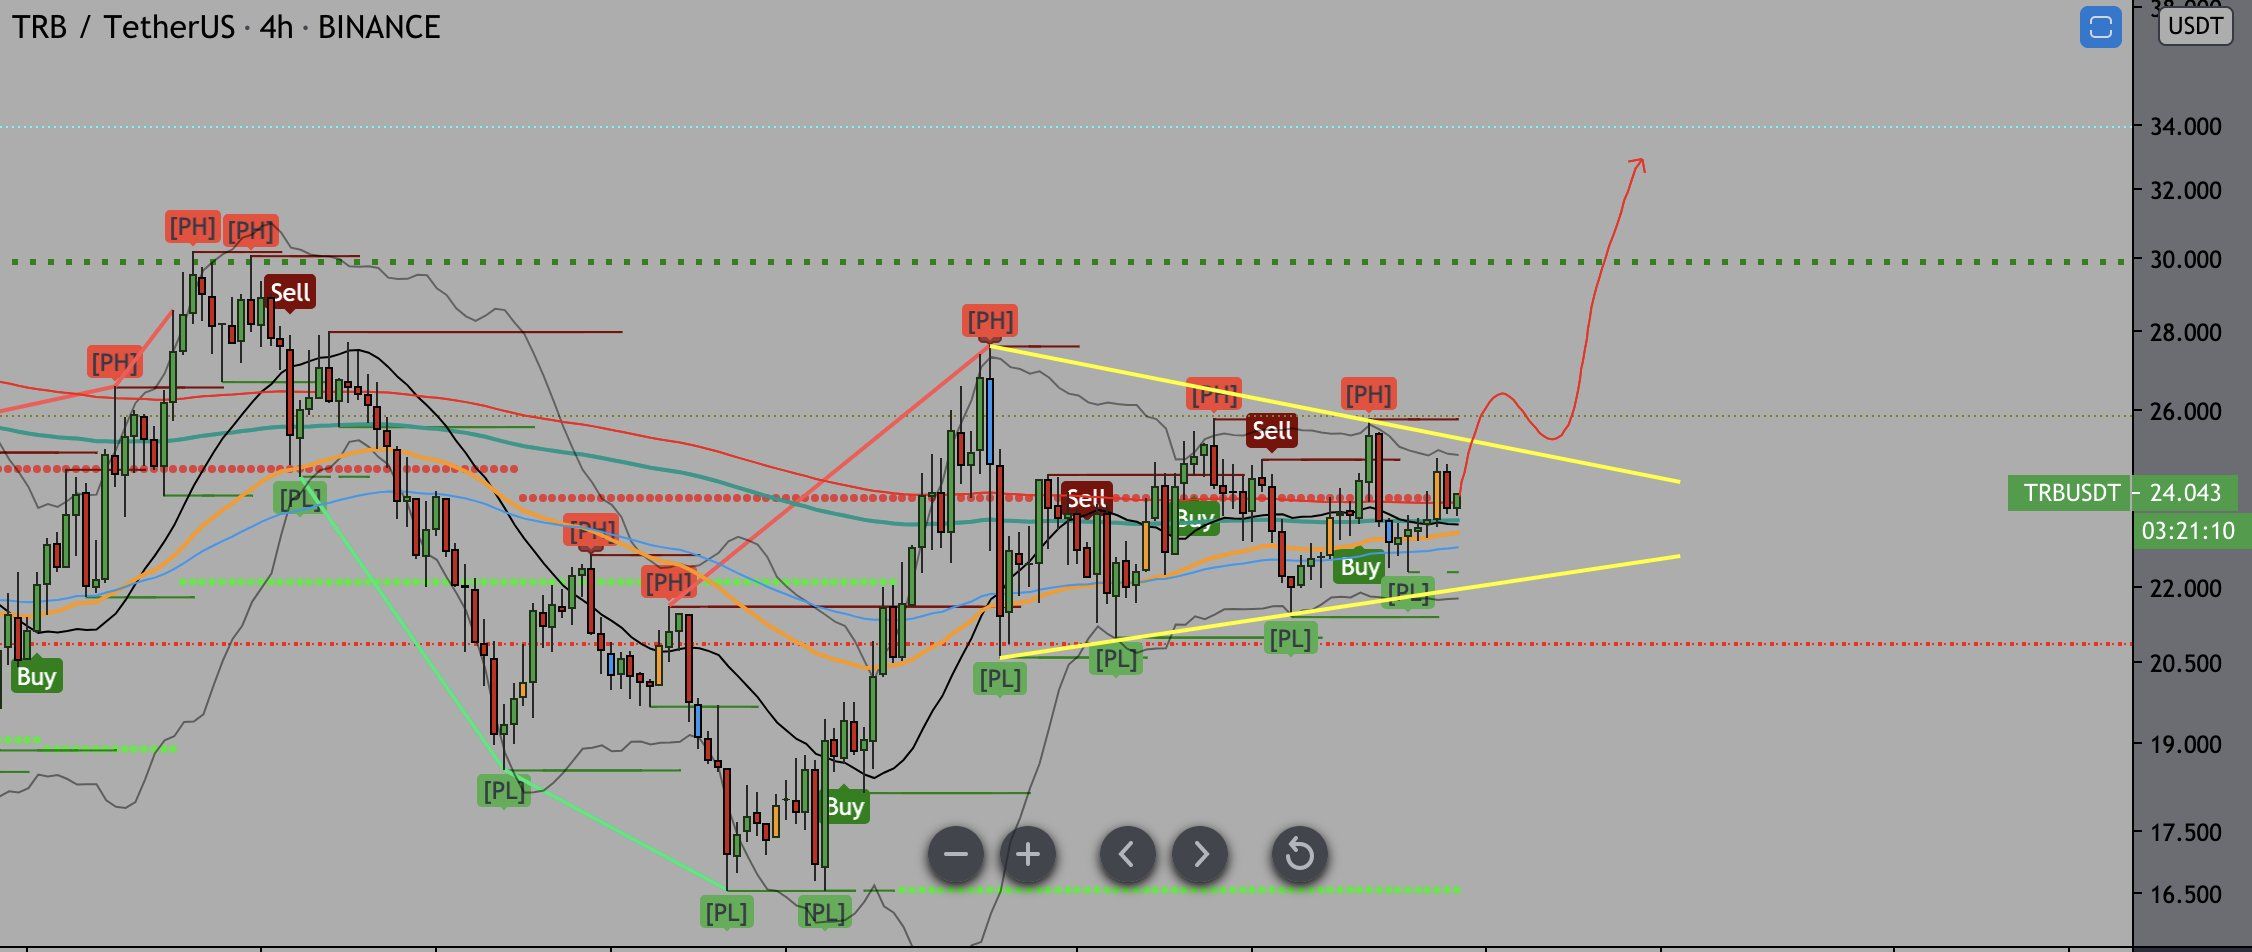
Conclusion
TRB is expected to continue its upward movement and gradually increase towards $46 with intermittent retracements along the way. For BeInCrypto’s latest Bitcoin analysis, click here! Disclaimer: Cryptocurrency trading carries a high level of risk and may not be suitable for all investors. The views expressed in this article do not reflect those of BeInCrypto
Top crypto platforms in the US
Disclaimer
In line with the Trust Project guidelines, this price analysis article is for informational purposes only and should not be considered financial or investment advice. BeInCrypto is committed to accurate, unbiased reporting, but market conditions are subject to change without notice. Always conduct your own research and consult with a professional before making any financial decisions. Please note that our Terms and Conditions, Privacy Policy, and Disclaimers have been updated.

Valdrin Tahiri
Valdrin discovered cryptocurrencies while he was getting his MSc in Financial Markets from the Barcelona School of Economics. Shortly after graduating, he began writing for several different cryptocurrency related websites as a freelancer before eventually taking on the role of BeInCrypto's Senior Analyst.
(I do not have a discord and will not contact you first there. Beware of scammers)
READ FULL BIO
Sponsored
Sponsored