
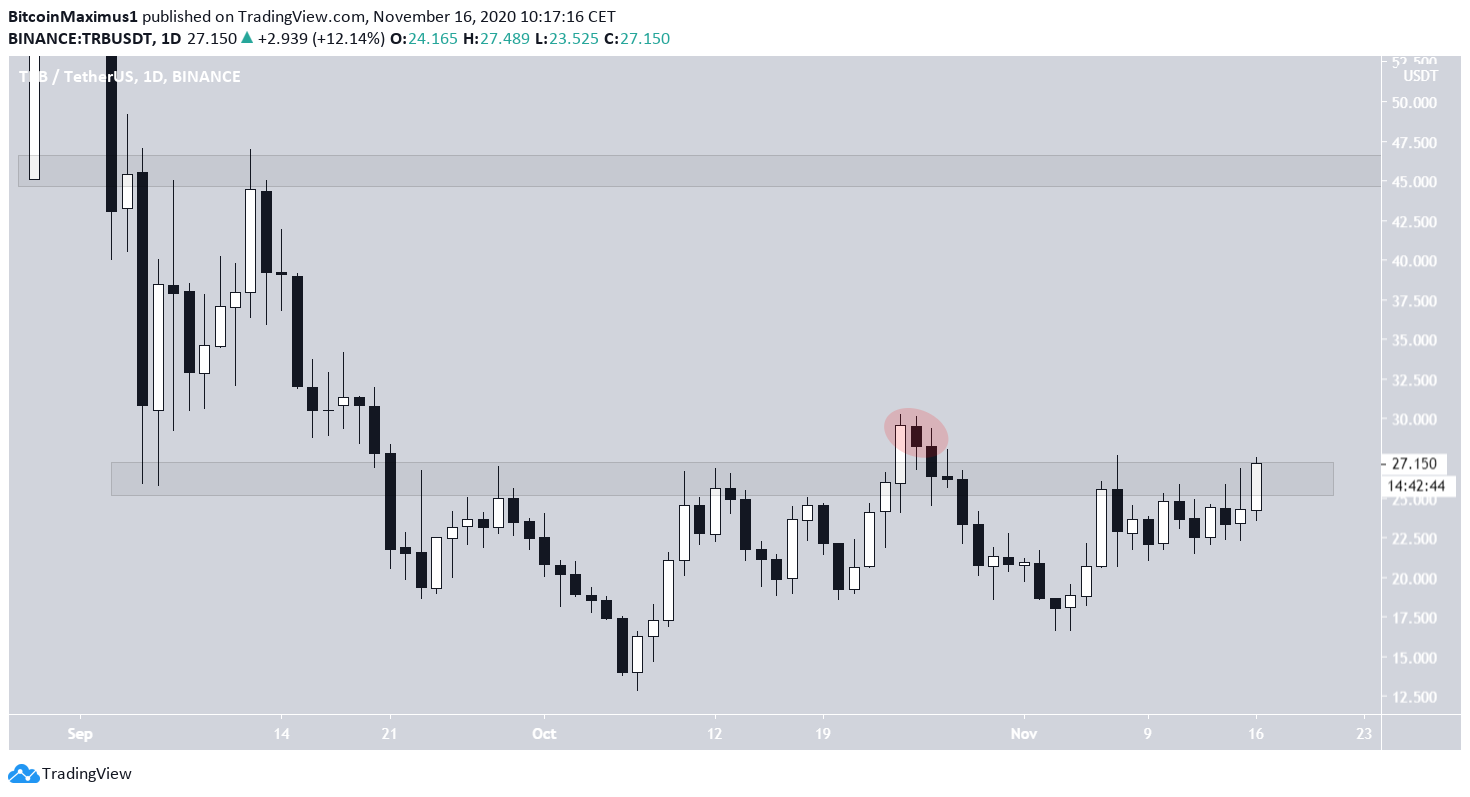
The Tellor (TRB) price is in the process of breaking out from a horizontal resistance level at $26. The price is expected to be successful in breaking out and eventually move towards the next closest resistance level.
With the exception of a short deviation on Oct 24, the TRB price has been trading below the $26 resistance area.
TRB Sends Bullish Signals
Despite this resistance, the price action from the Oct 7 all-time low of $12.78 seems bullish. The price has created a higher low and continued its increase since then.
At the time of press, TRB had crossed above the $26 resistance and is trading for $27.47. The next significant resistance level is found at $46.
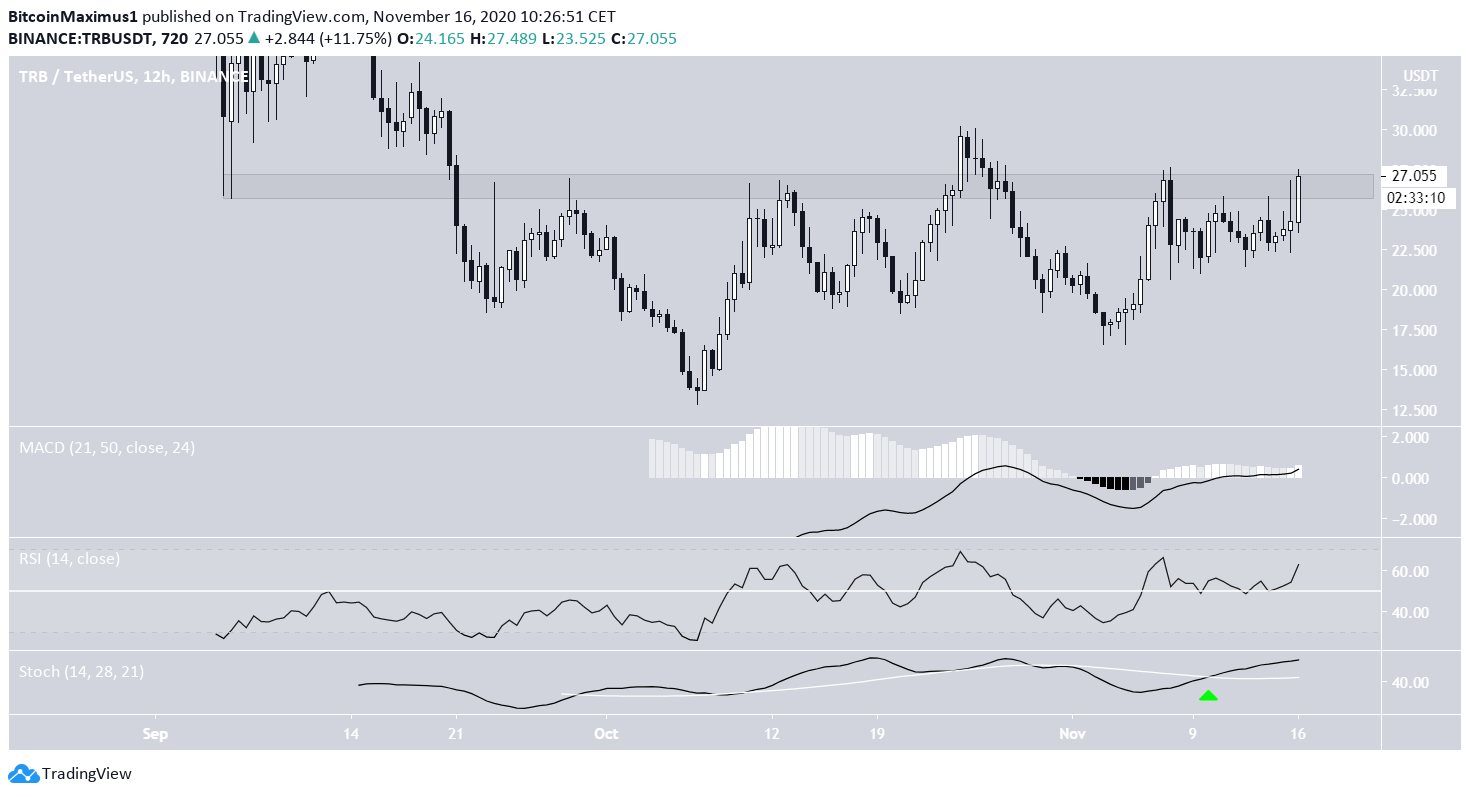
Technical indicators are bullish. The MACD is positive and increasing, the RSI is above 50, and the Stochastic oscillator has made a bullish cross.
Therefore, the TRB price is expected to break out from the current resistance area and continue moving upwards.
Short-Term Movement
Cryptocurrency trader @CryptoNewton outlined a short-term TRB chart, stating that he believes the price will soon break out from the current symmetrical triangle to target $30.
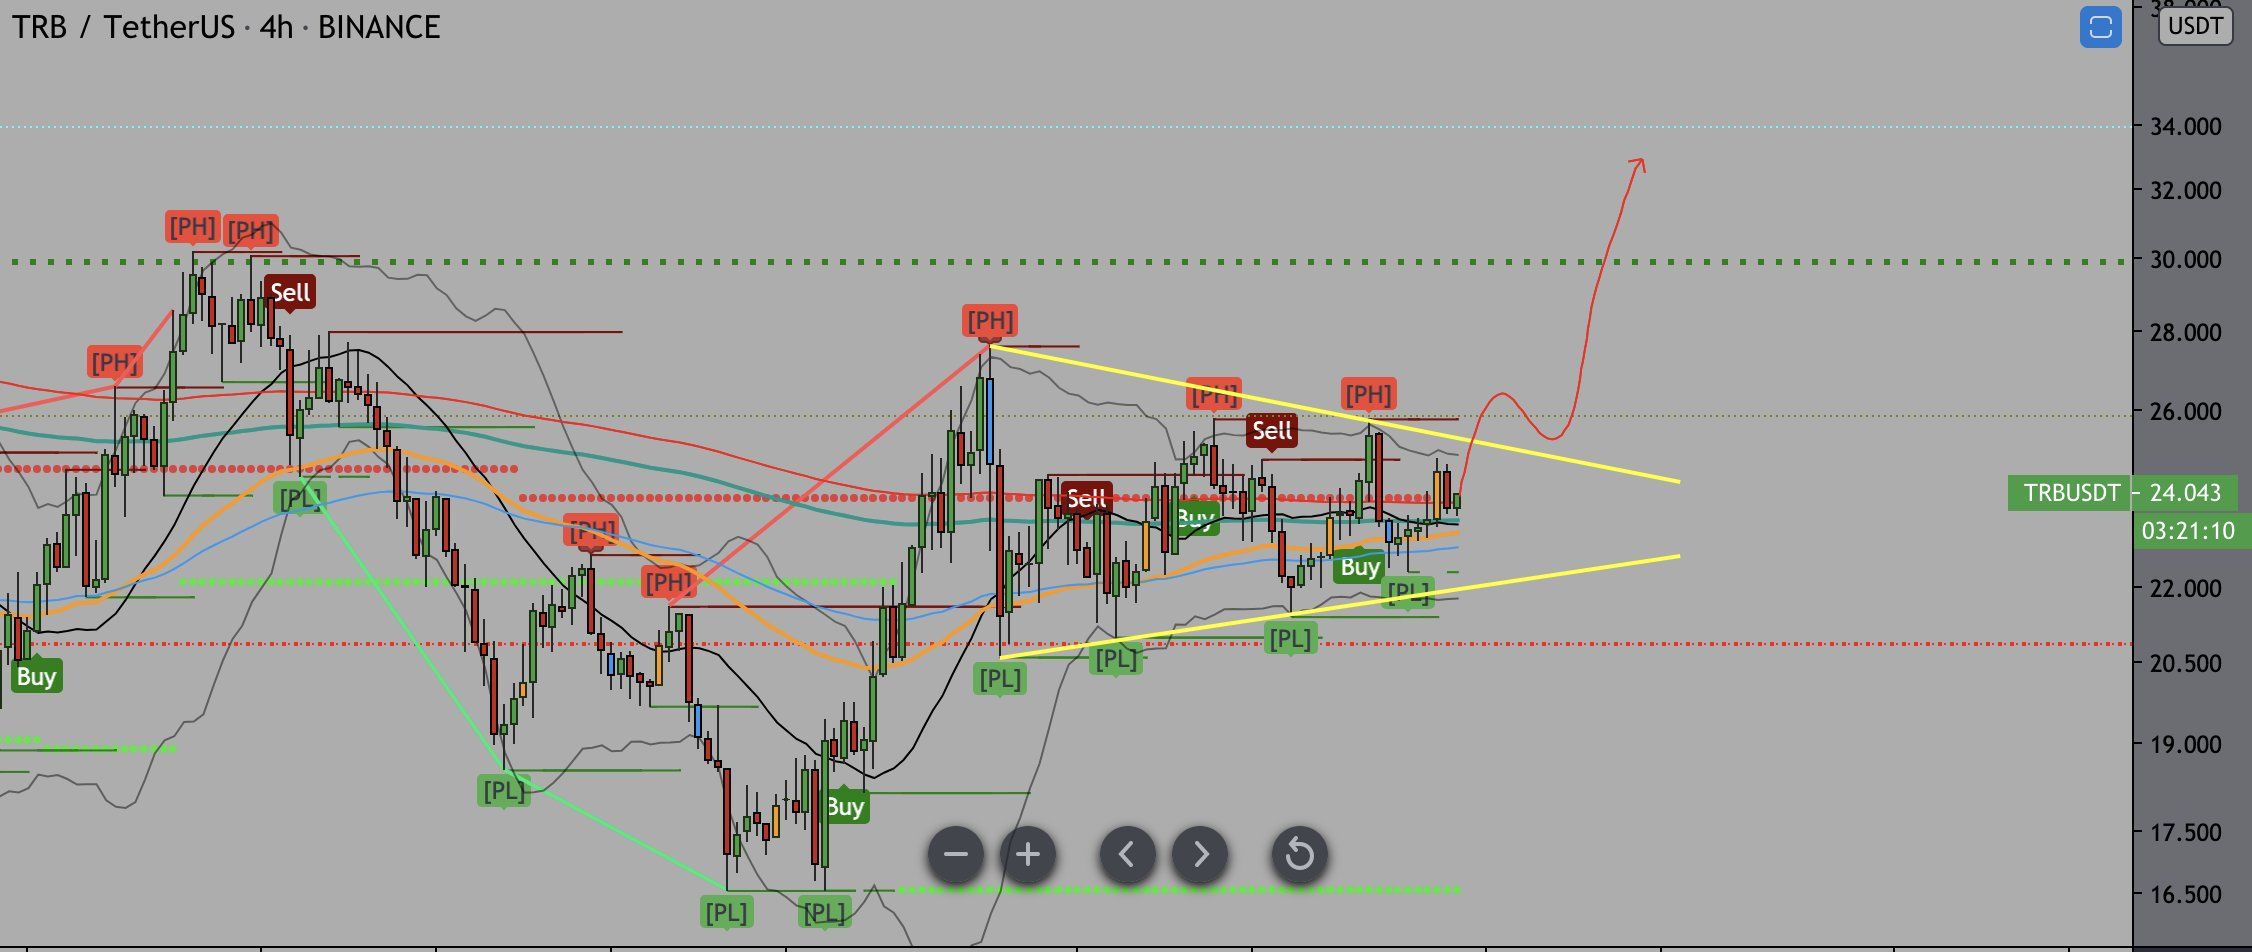
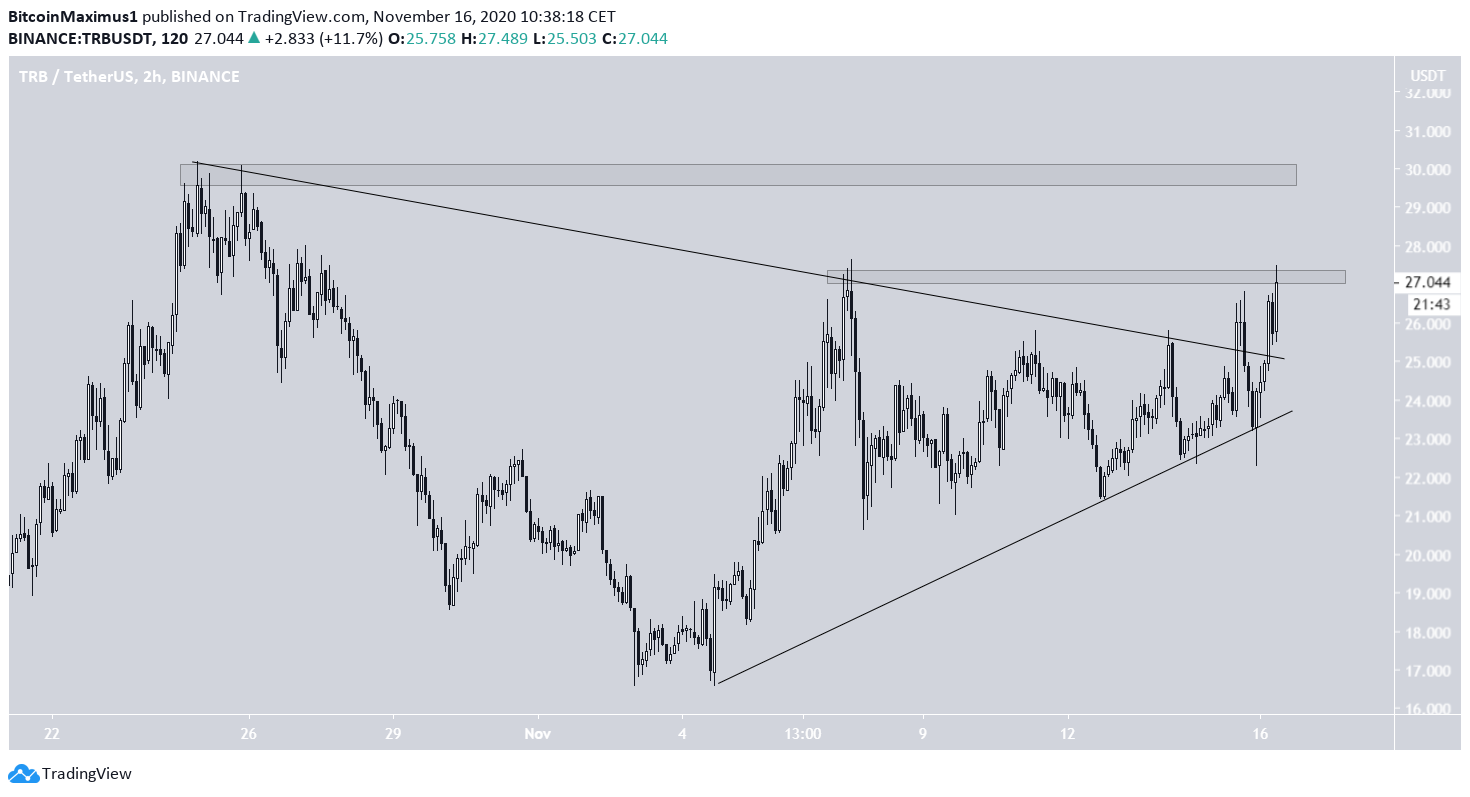
Since the tweet, the price has seemingly broken out from the triangle and reached a high of $27.65.
While there are minor resistance levels at $27.20 and $30, which could cause short-term decreases, the price is expected to eventually move above these levels.
A flip of the $30 area as support would indicate that the price is heading towards the previously outlined resistance area at $46.
Conclusion
TRB is expected to continue its upward movement and gradually increase towards $46 with intermittent retracements along the way.
For BeInCrypto’s latest Bitcoin analysis, click here!
Disclaimer: Cryptocurrency trading carries a high level of risk and may not be suitable for all investors. The views expressed in this article do not reflect those of BeInCrypto
