

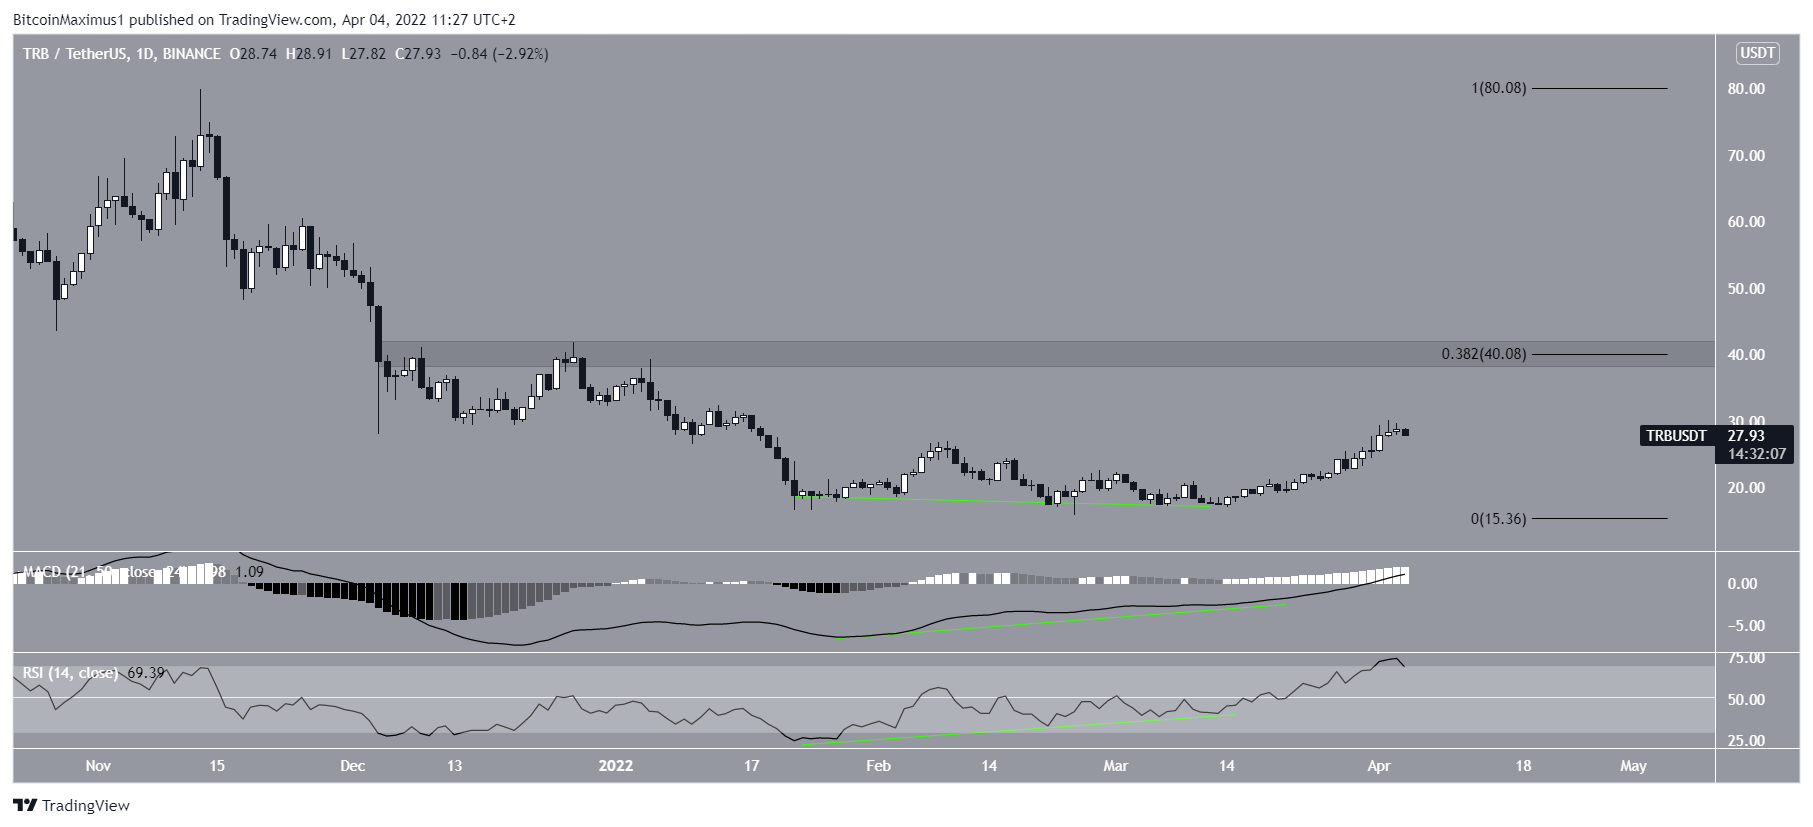
Tellor (TRB) created a bullish pattern between Jan and March 2022 and has been increasing since March 12.
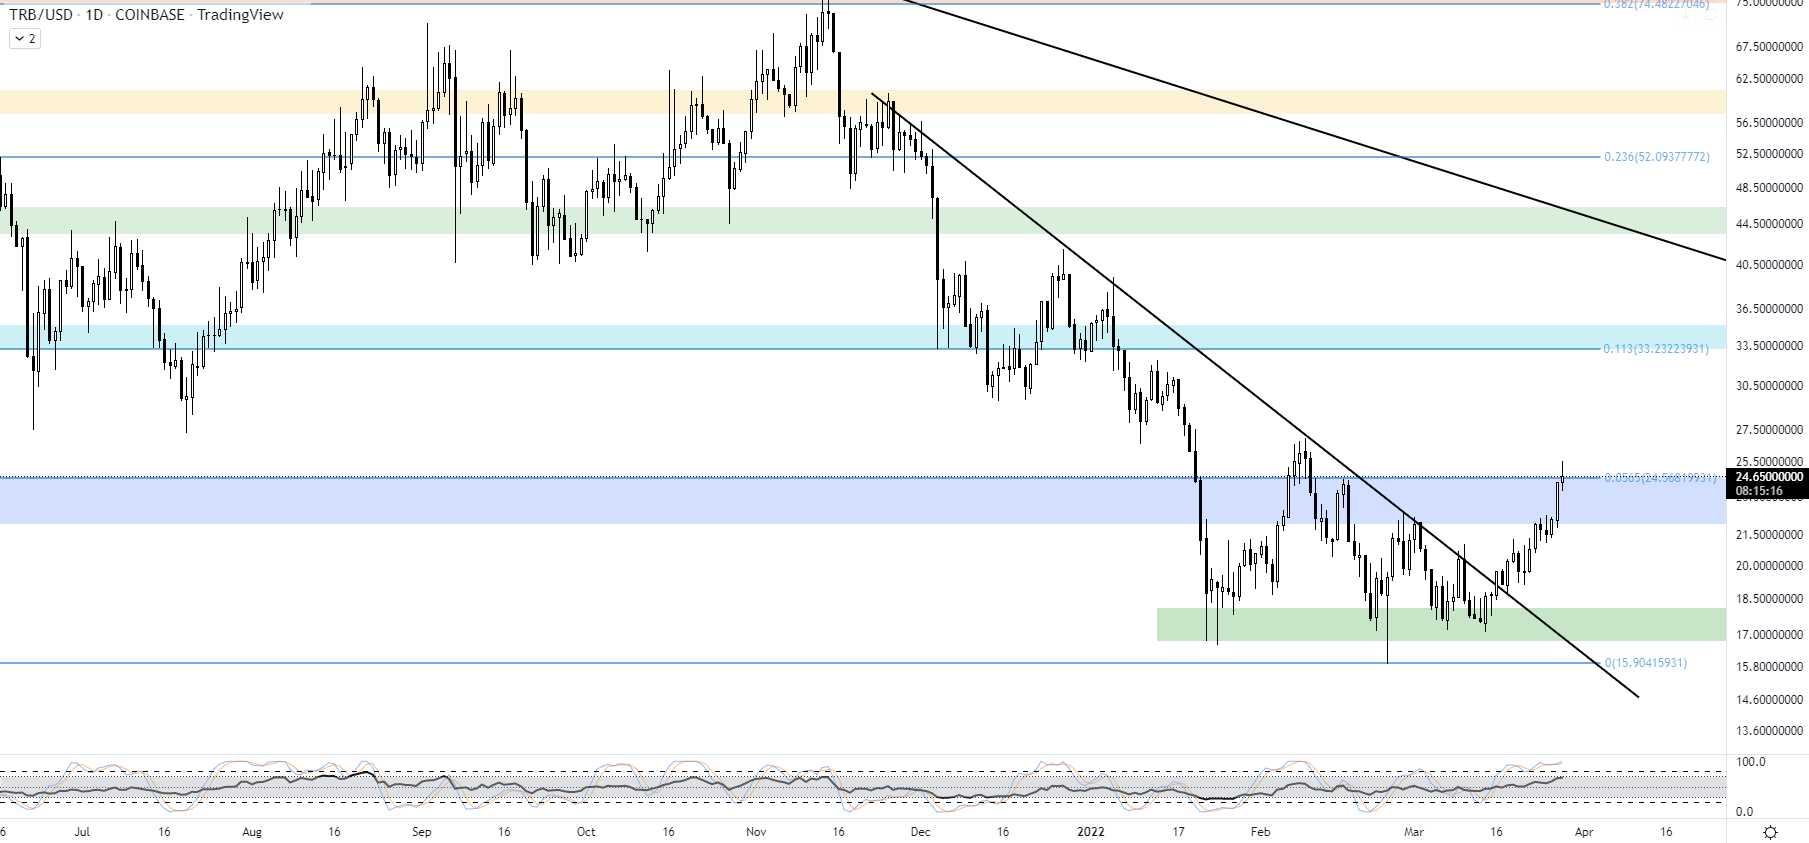
TRB has been falling since reaching an all-time high price of $164 on May 10. Initially, the price bounced on June 22 (green icon), validating the $32 horizontal area as support.
However, it created a lower high on Nov 13 (red icon) and has been falling since.
At the beginning of Jan, the price broke down from the $32 area and reached a low of $15.90 on Feb 24.
TRB has been moving upwards since but has yet to reclaim the $32 area.

Ongoing TRB increase
Cryptocurrency trader @Engineeringhere tweeted a chart of TRB, stating that the price could continue increasing to $34.
Daily time-frame readings support the continuation of the upward movement towards the previously outlined $32 area and potentially at $40. The latter is a horizontal resistance area and the 0.382 Fib retracement resistance level.
In the period between Jan and March, the price created a triple bottom, which is considered a bullish pattern. Furthermore, the pattern was combined with strong bullish divergences in both the RSI and MACD (green lines).
Such divergences very often precede bullish trend reversals, as was the case in TRB. In addition to this, the MACD is now positive and the RSI is above 70.
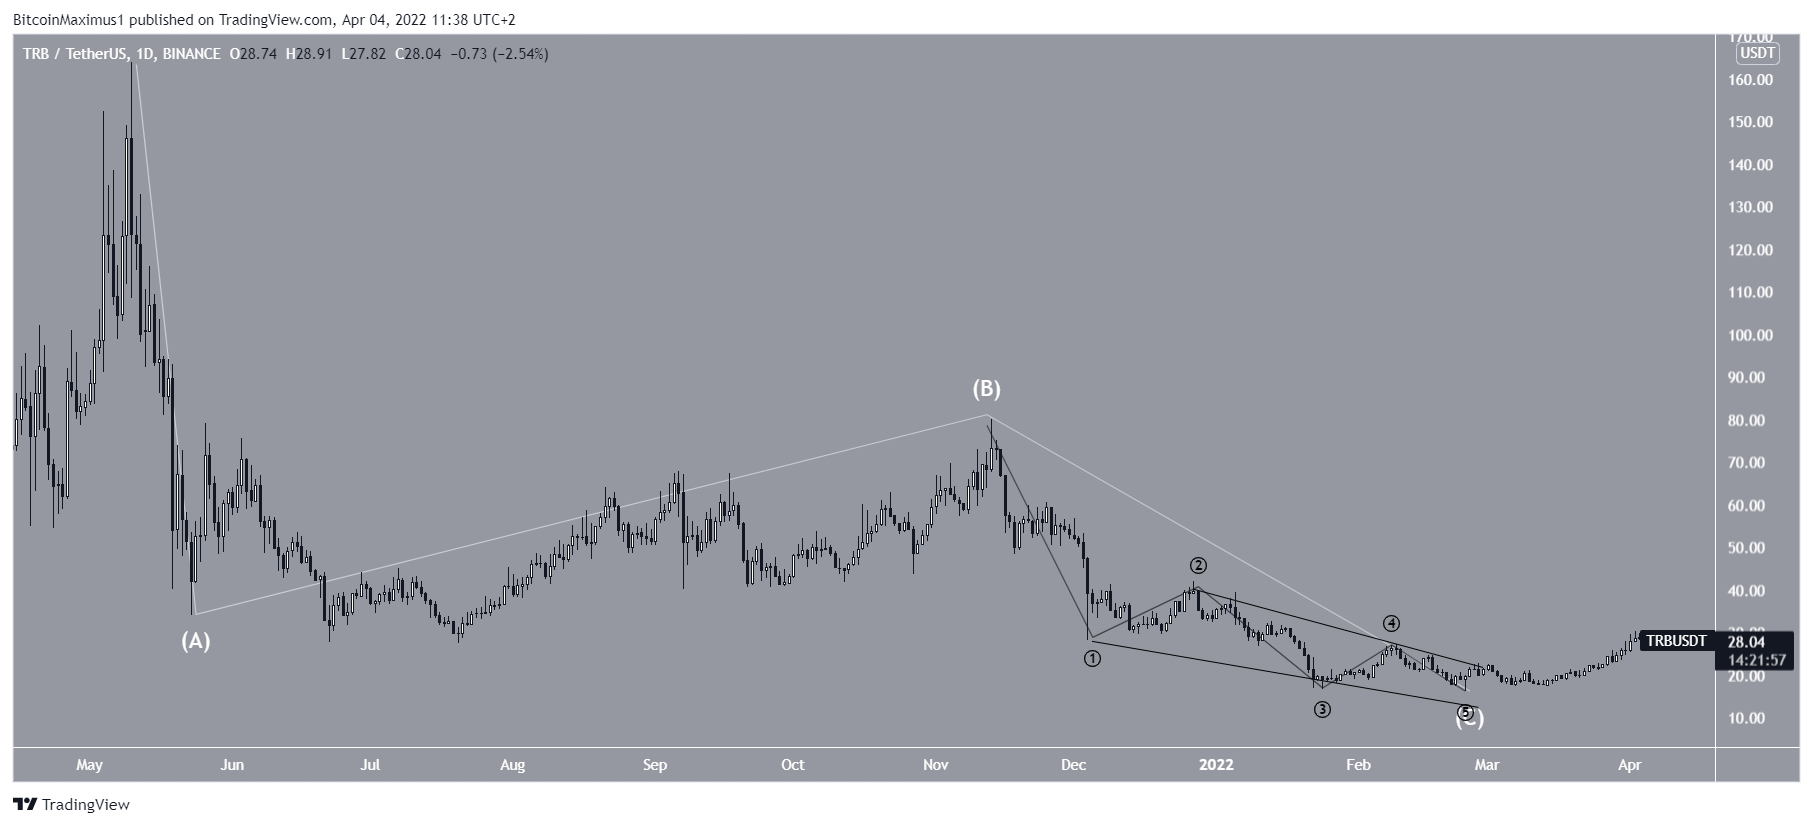
Wave count analysis
The most likely wave count suggests that TRB has completed an A-B-C correction when measuring from the all-time high (white). While there is no direct relation between the length of waves A and C, there is a completed five wave downward movement in C (black), which took the shape of an ending diagonal.
Therefore, it is possible that TRB bottomed on Feb 24.
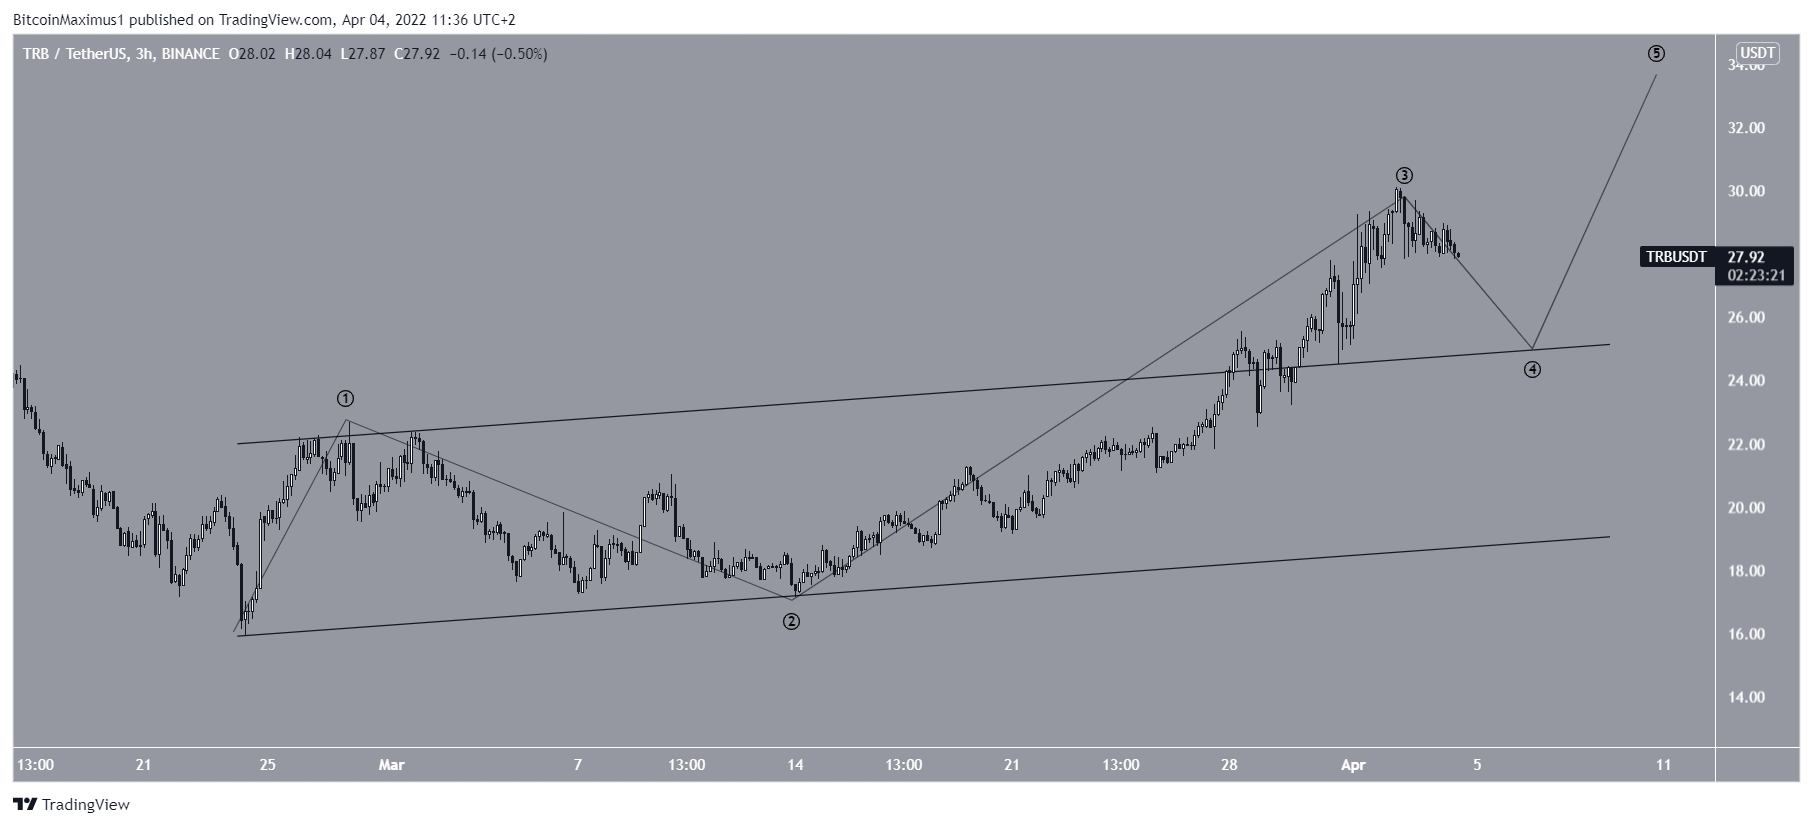
The short-term count suggests that TRB is currently in wave four of a five-wave upward movement. TRB is possibly in the process of completing a fourth wave pullback. This is an occurrence in which a sharp fall that validates the resistance line of the previous channel is followed by an equally sharp increase.
For Be[in]Crypto’s latest Bitcoin (BTC) analysis, click here
Disclaimer
In line with the Trust Project guidelines, this price analysis article is for informational purposes only and should not be considered financial or investment advice. BeInCrypto is committed to accurate, unbiased reporting, but market conditions are subject to change without notice. Always conduct your own research and consult with a professional before making any financial decisions. Please note that our Terms and Conditions, Privacy Policy, and Disclaimers have been updated.
