


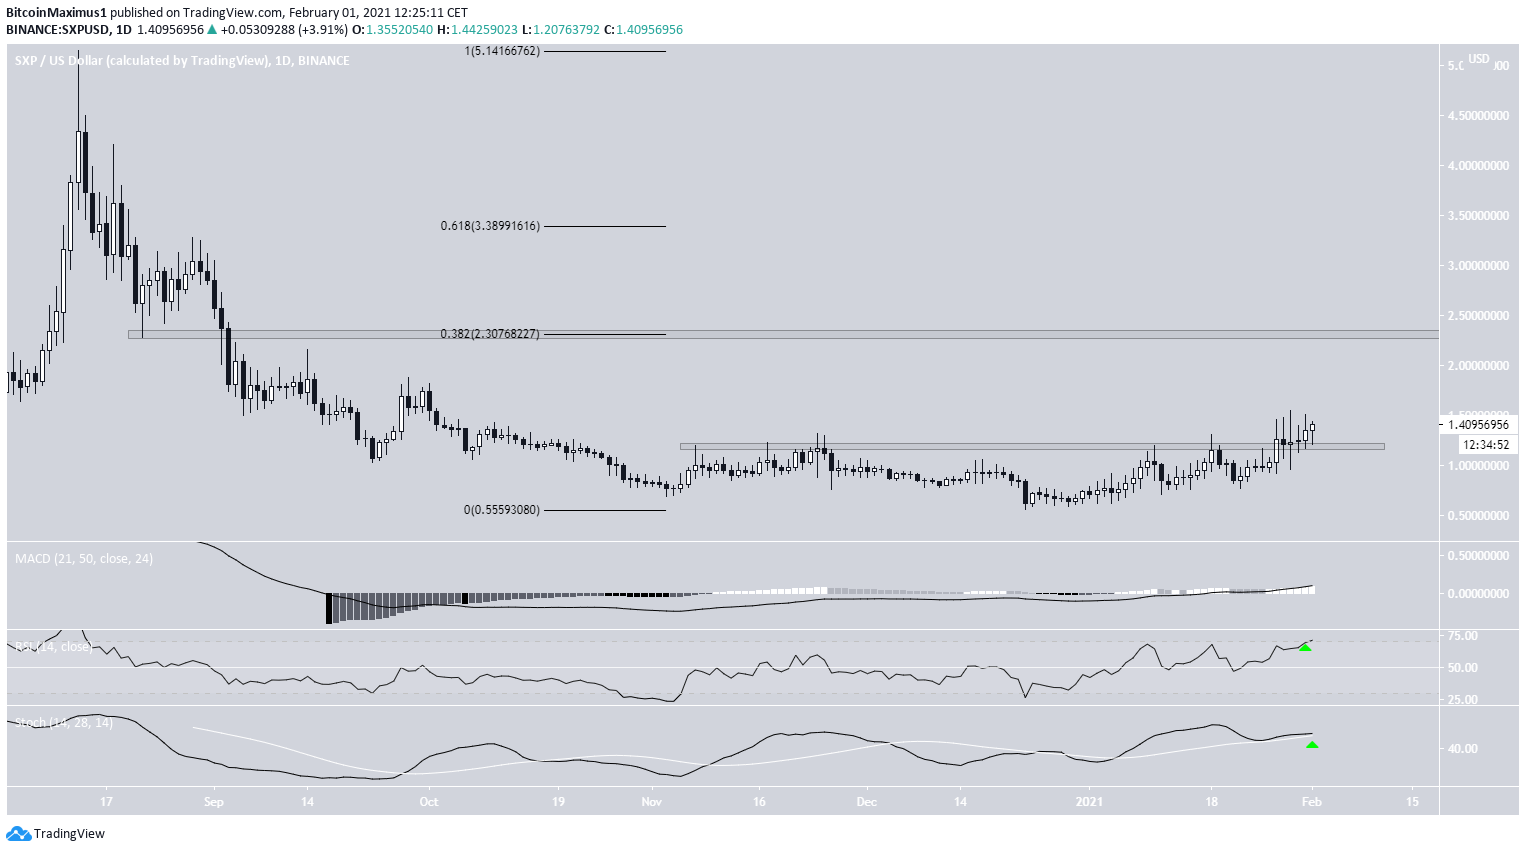
The Swipe (SXP) price has moved above the $1.20 resistance area and reclaimed it as support.
Both the SXP/USD and SXP/BTC pairs should continue moving higher and eventually break out.
Breakout Leads to Continuation
SXP has been increasing since it reached a low of $0.55 on Dec. 23, 2020. On Jan. 27, 2021, it managed to move above the $1.20 area, which had previously been acting as resistance since Nov. 2020.
Afterward, it validated the area as support and has now resumed its upward movement. The next closest resistance area is at $2.30, being the 0.382 Fib retracement level of the downward move measured from the all-time highs.
Technical indicators on the daily time-frame are bullish, supporting a continuation of the upward move towards resistance.
Short-Term Movement
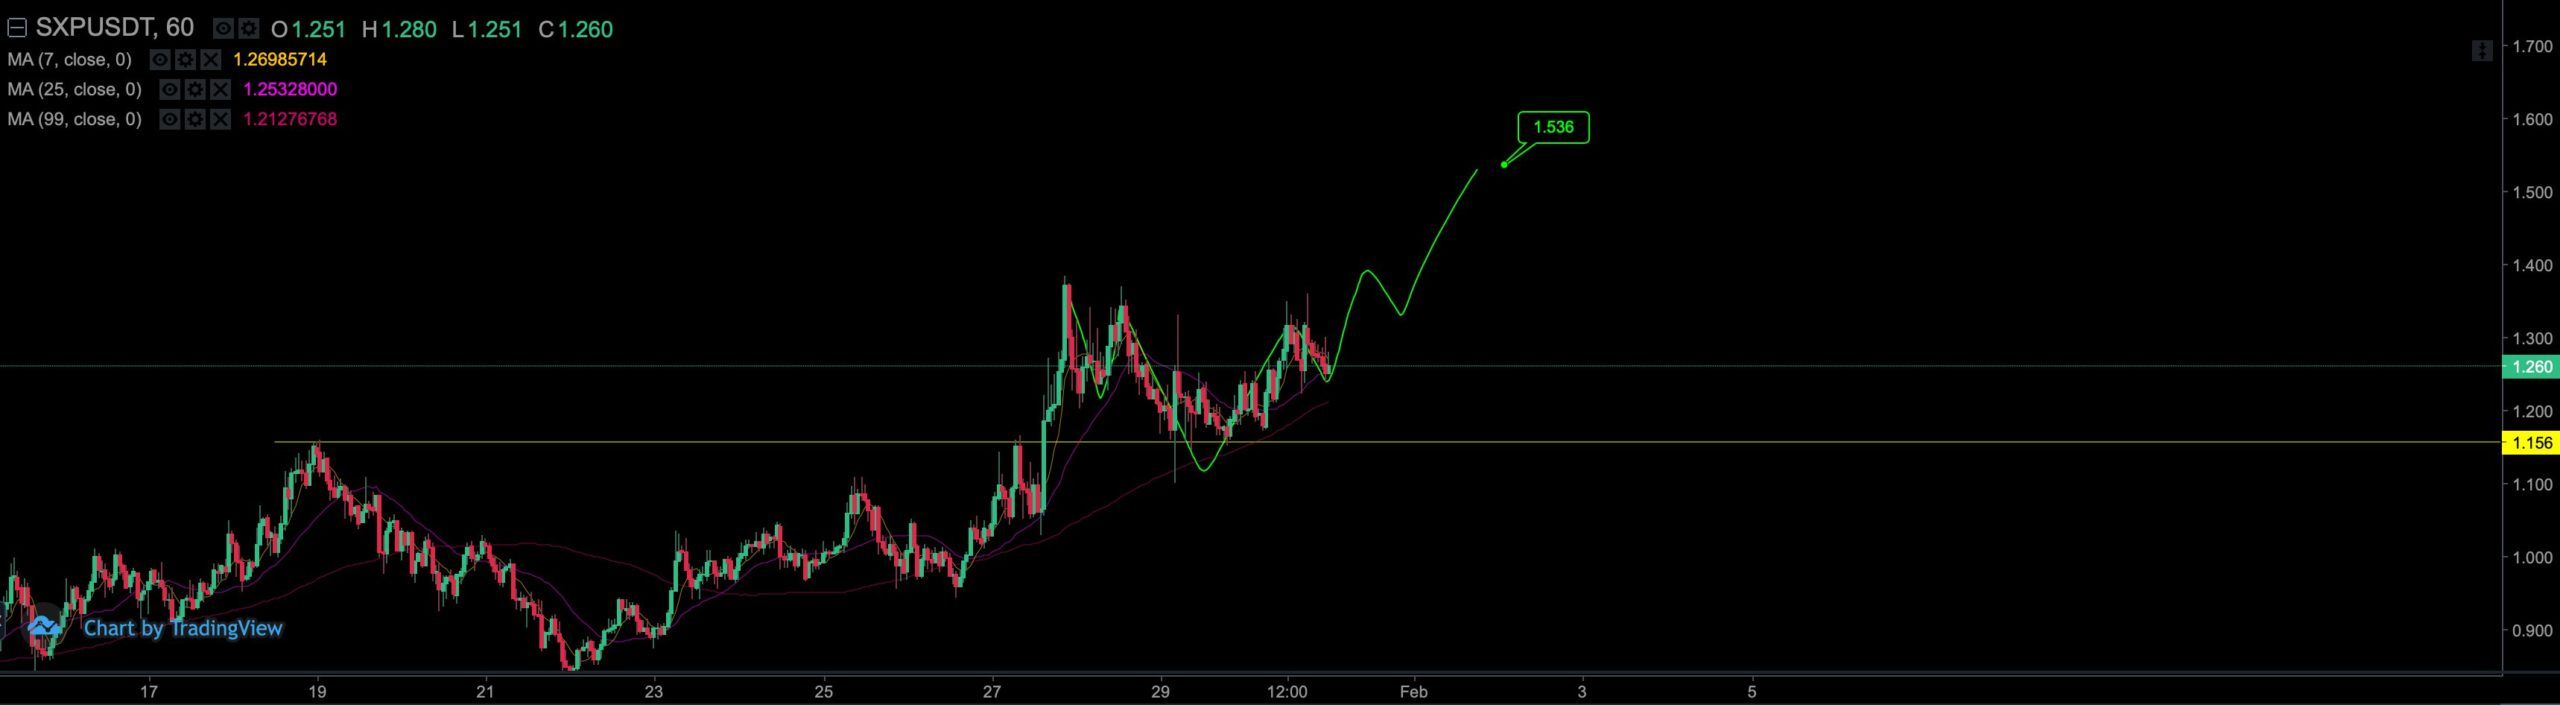
Cryptocurrency trader @CryptoNewton outlined an SXP chart, stating that it could continue increasing all the way to $1.53.
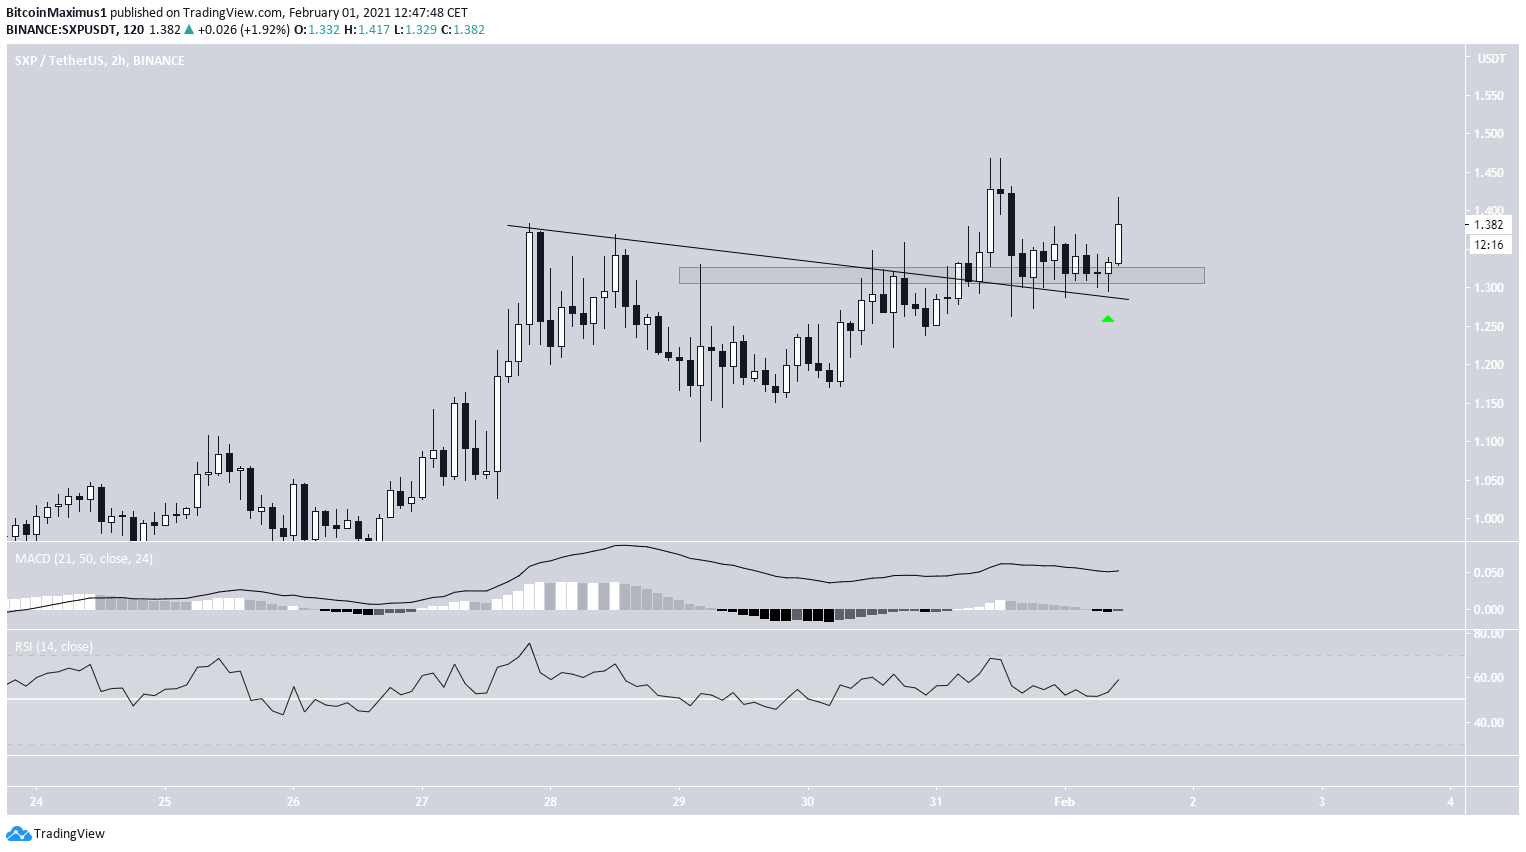
The shorter-term two-hour chart shows a breakout from a descending resistance line and subsequent validation as support alongside the minor $1.35 area.
Technical indicators are also bullish. Thus the upward move is likely to continue towards the next closest resistance area at $2.30
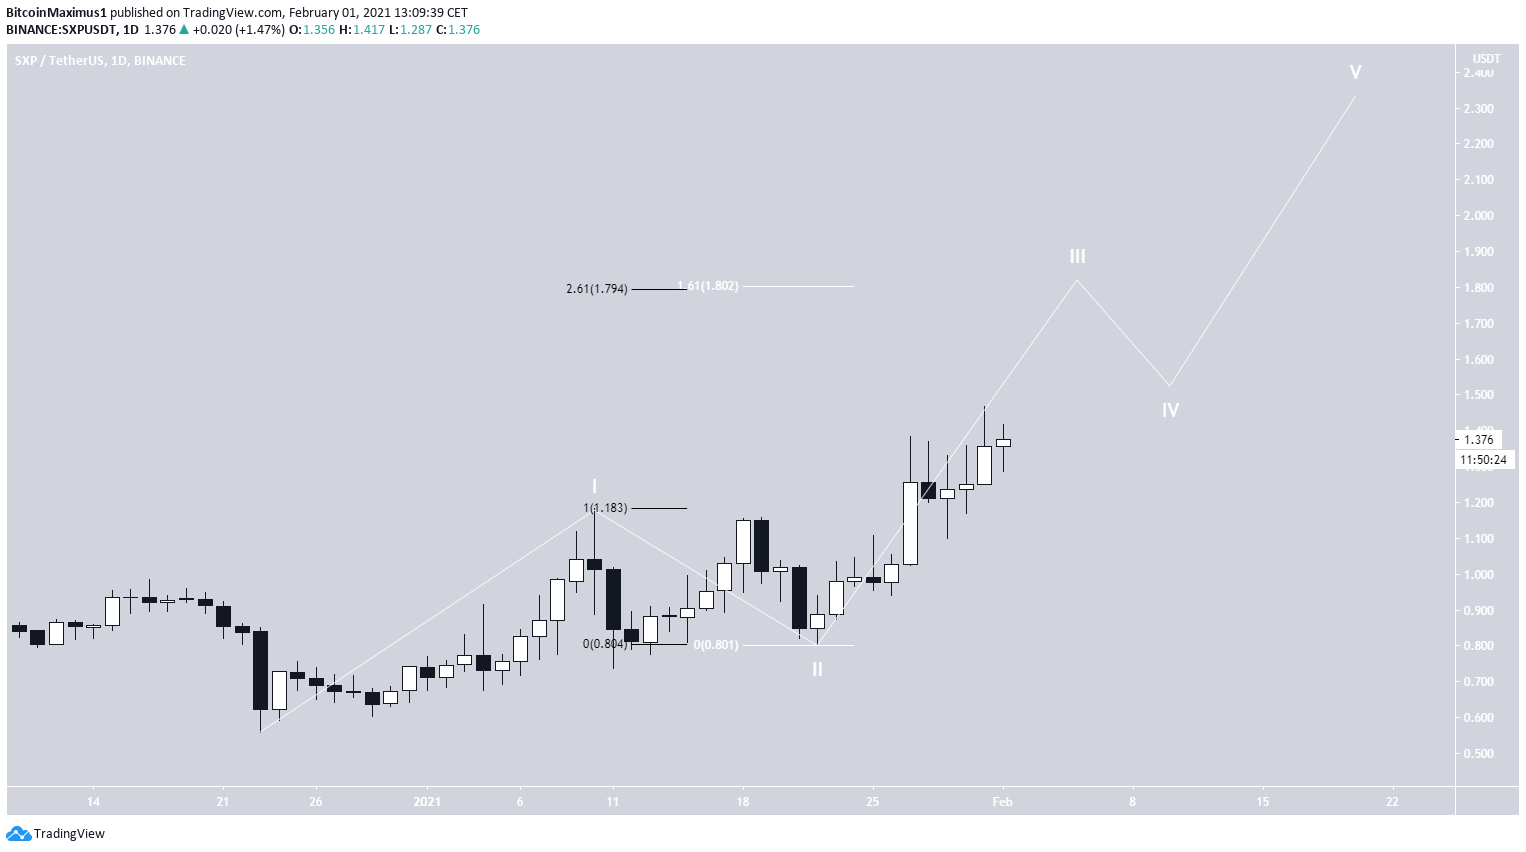
Wave Count
The wave count suggests that SXP is currently in wave 3 (white) of a bullish impulse that began with the previous Dec. 23 lows.
The most likely target for the top of wave 3 is between $1.79 and $1.80, the 2.61 external fib retracement (black), and the 1.61 Fib projection.
Afterward, the entire upward move could end at the $2.30 resistance area.
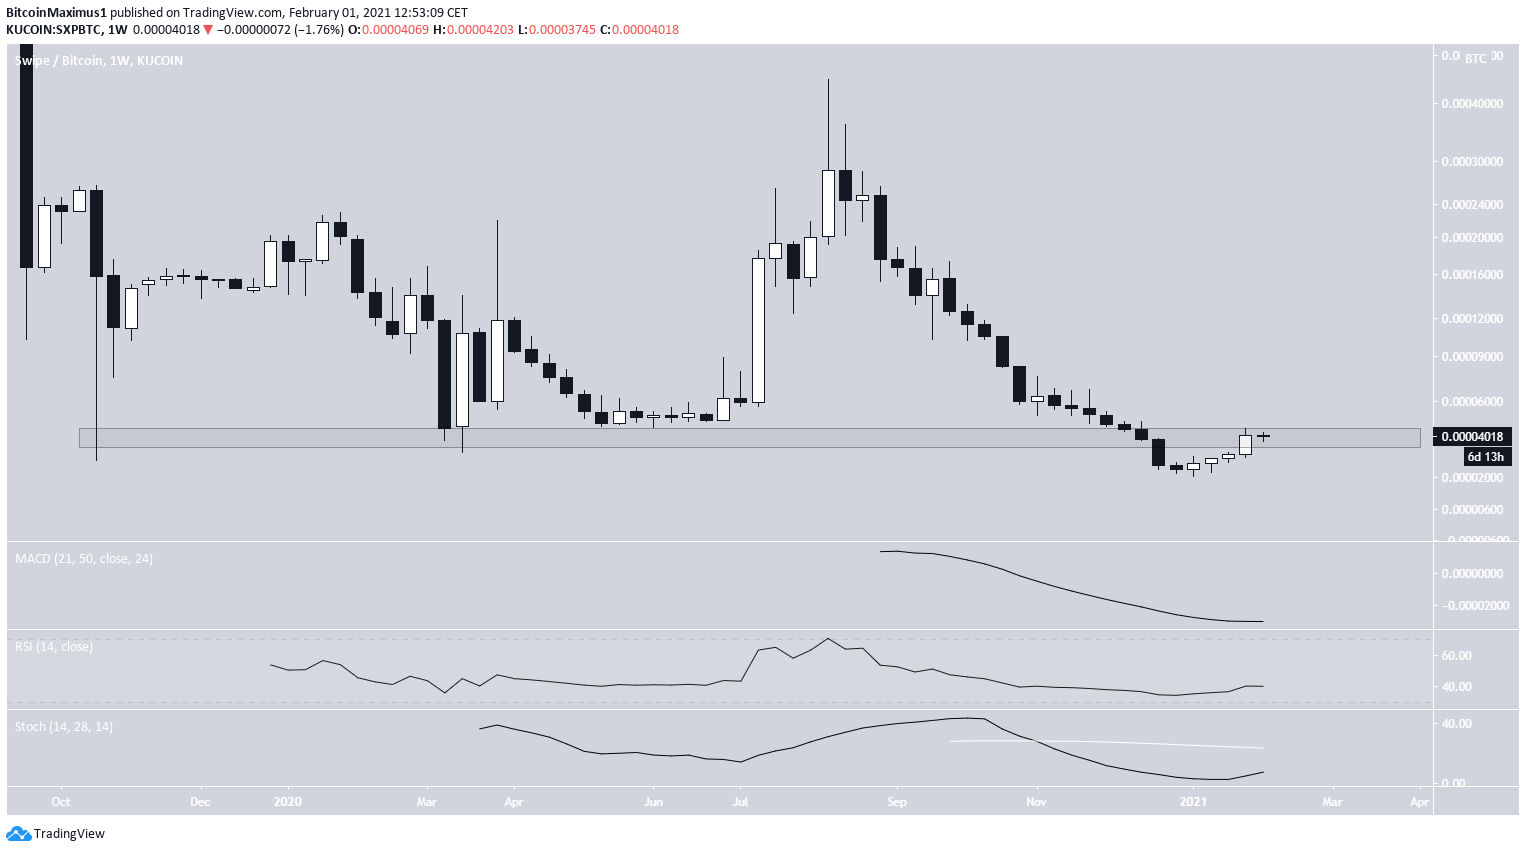
SXP/BTC
The weekly chart shows that SXP/BTC reached an all-time low price of 2,011 satoshis on Jan. 7. While it has been increasing since, it has yet to reclaim the breakdown level at 4,000 satoshis.
Until it does, we cannot consider the trend bullish. Technical indicators are neutral, failing to provide a direction for the long-term trend.
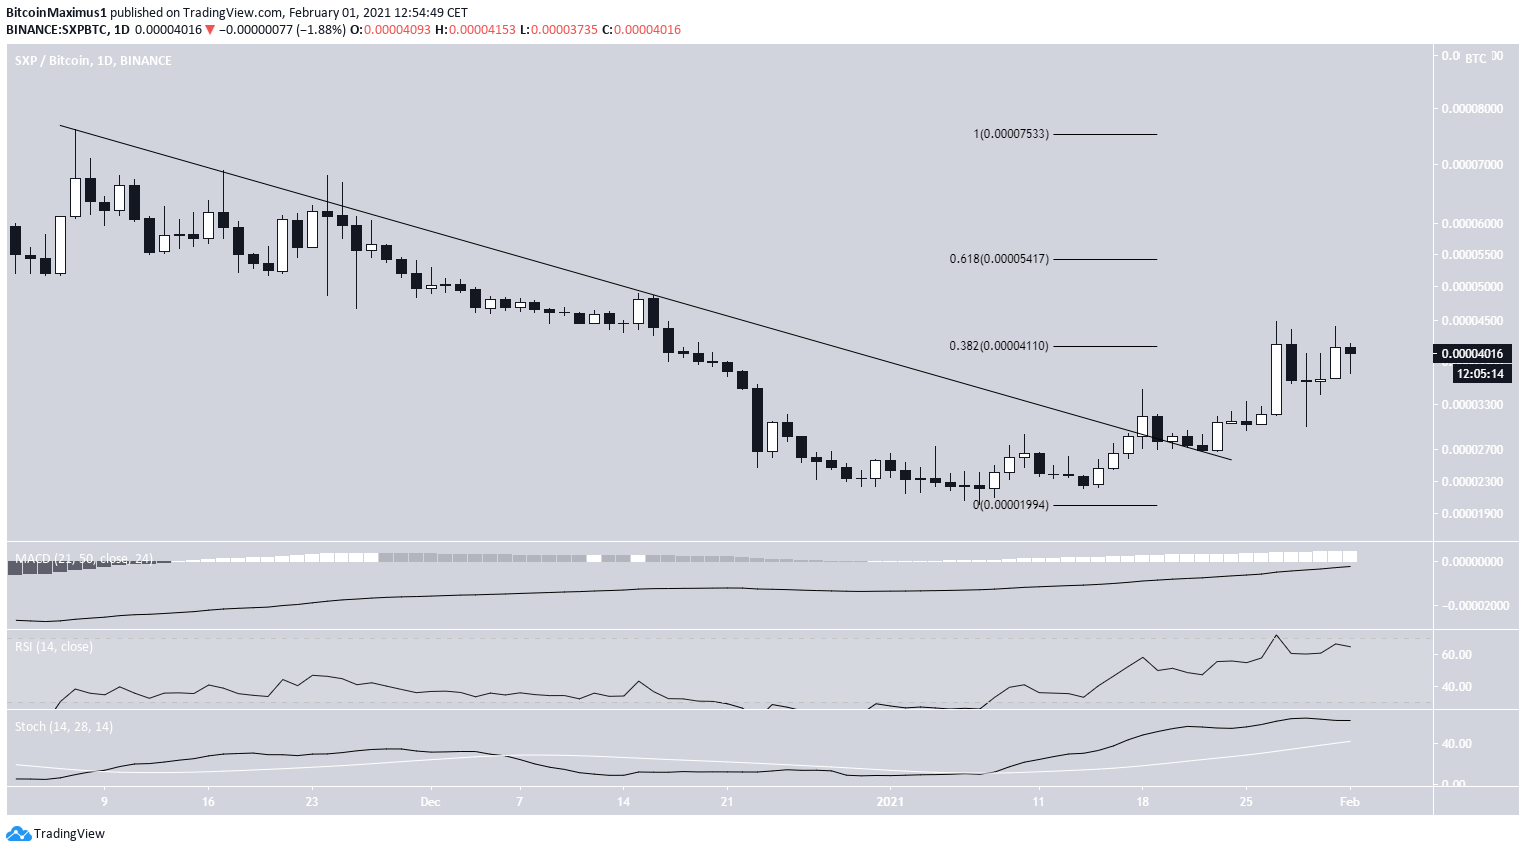
Nevertheless, the daily chart shows a breakout from a descending resistance line and its validation as support afterward.
While SXP has met resistance at 4,110 satoshis, technical indicators are decisively bullish, indicating that a breakout is likely. This would also reclaim the previously outlined long-term resistance level.
If SXP continues increasing, the next closest resistance areas would be at 5,417 and 7,533 satoshis, respectively.
Conclusion
To conclude, the trend for both SXP/USD and SXP/BTC seems to be bullish. Both should increase towards their closest resistance areas and possibly break out.
For BeInCrypto’s latest Bitcoin (BTC) analysis, click here


