The Swipe (SXP) price has broken down from a long-term support level. While the price is approaching a possible Fib reversal level, technical indicators do not yet show any bullish signs.
Breakdown From Support
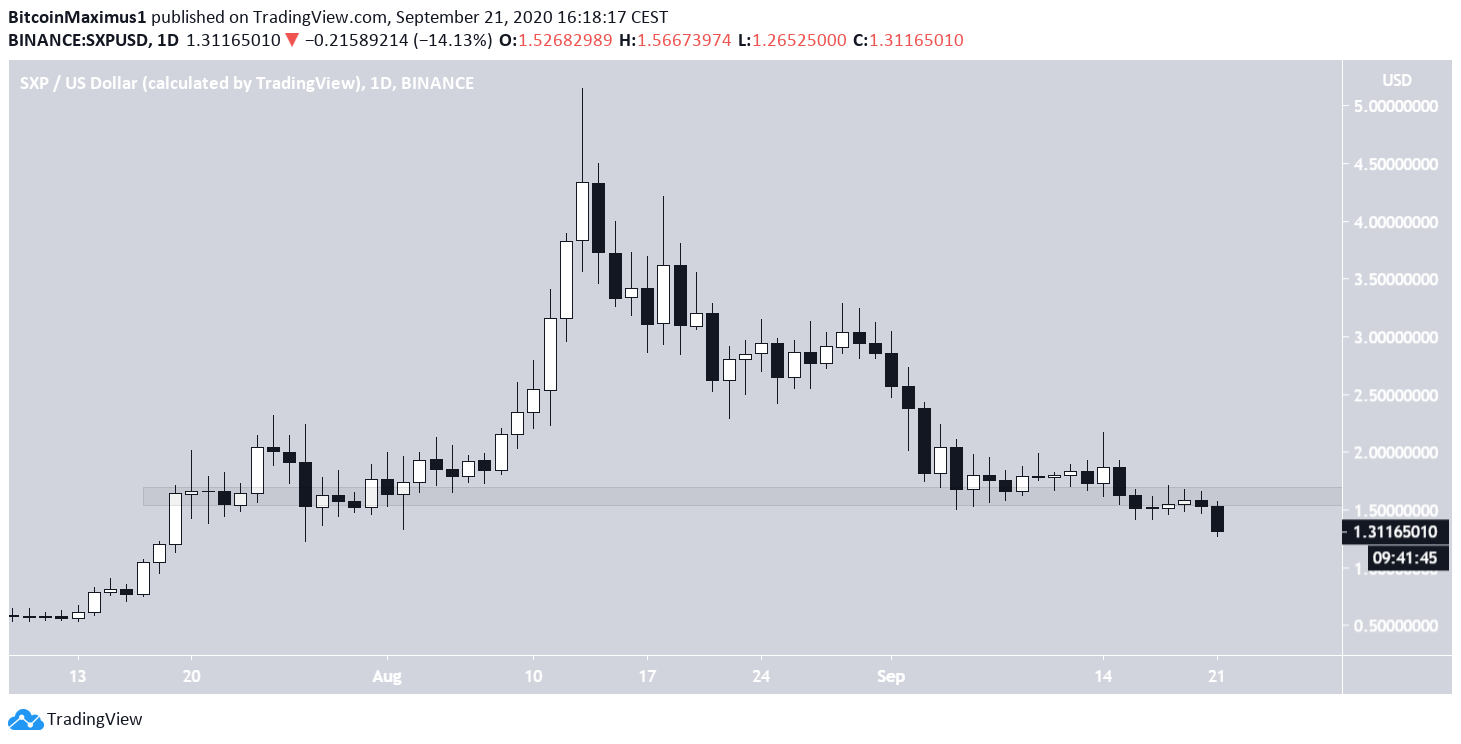
The SXP price has been decreasing since it reached a high of $5.15 on Aug. 13. On Sept. 4, the price reached a low of $1.48 and began to consolidate, creating a support level at $1.65. The same level had previously acted as support on July/August.
However, the price broke down on Sept. 19, validated the area as resistance and has been decreasing since.
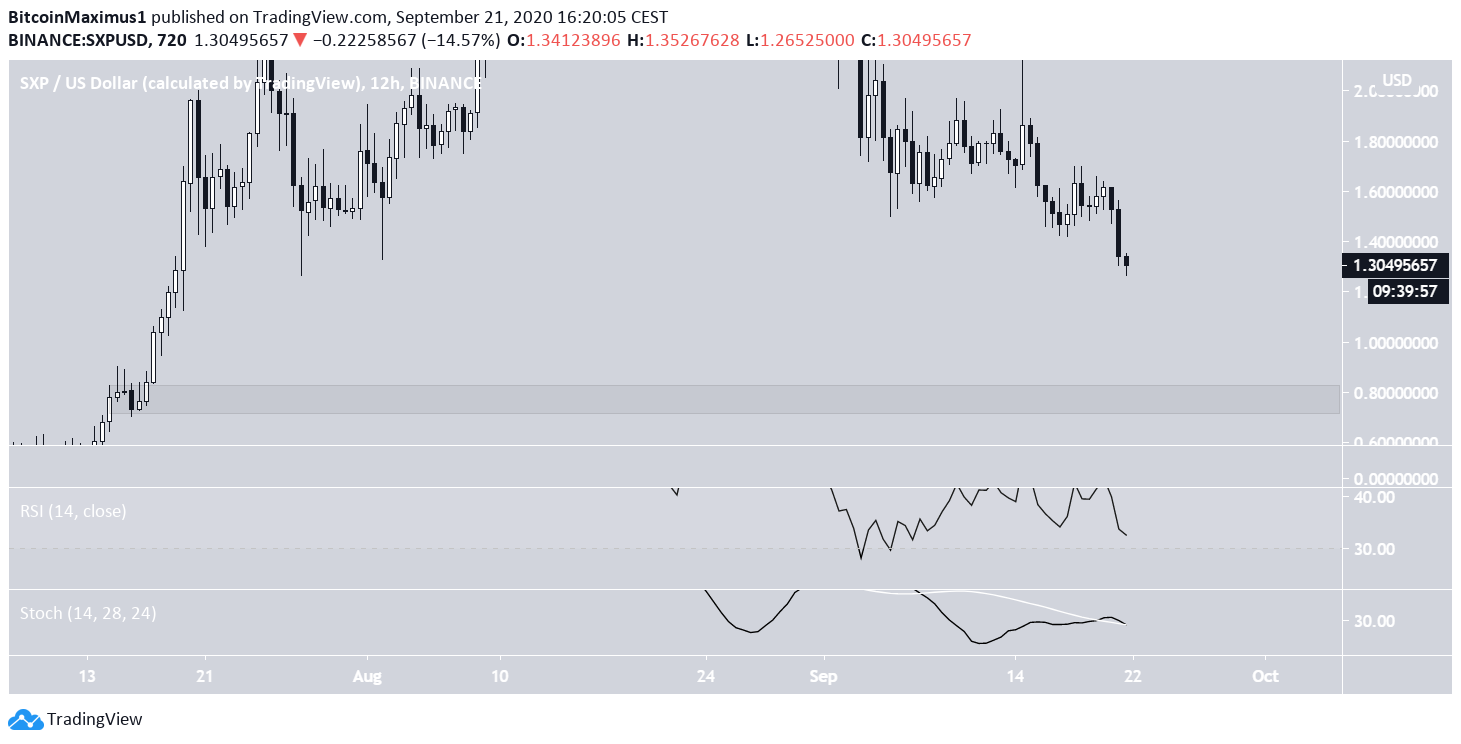
Technical indicators do not yet show any signs of reversal. While there are several possible bullish divergences in the RSI and Stochastic Oscillator, the latter has made a bearish cross and the former has not confirmed any of the divergences.
Furthermore, the closest minor support level is not found until $0.80.
Wave Count
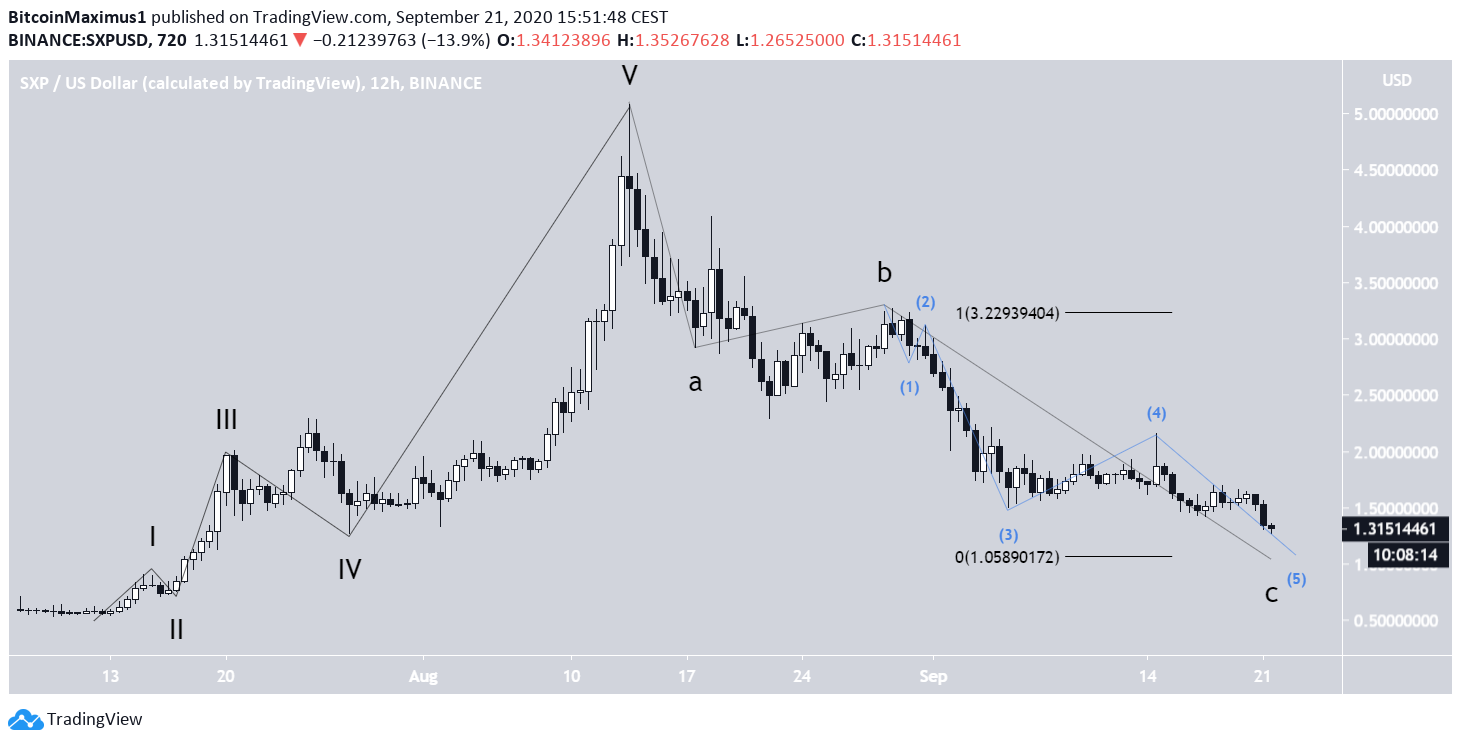
As for the wave count, it seems that SXP is completed a bullish impulse with the aforementioned $5.15 high and is correcting inside an A-B-C structure (in black below) since. The price is likely nearing the bottom of the C wave, which could end near $1.05.
The target is found by the sub-wave count (blue) and the length of the A wave, since a low of $1.05 would give a 1:1 ratio to the A:C waves.
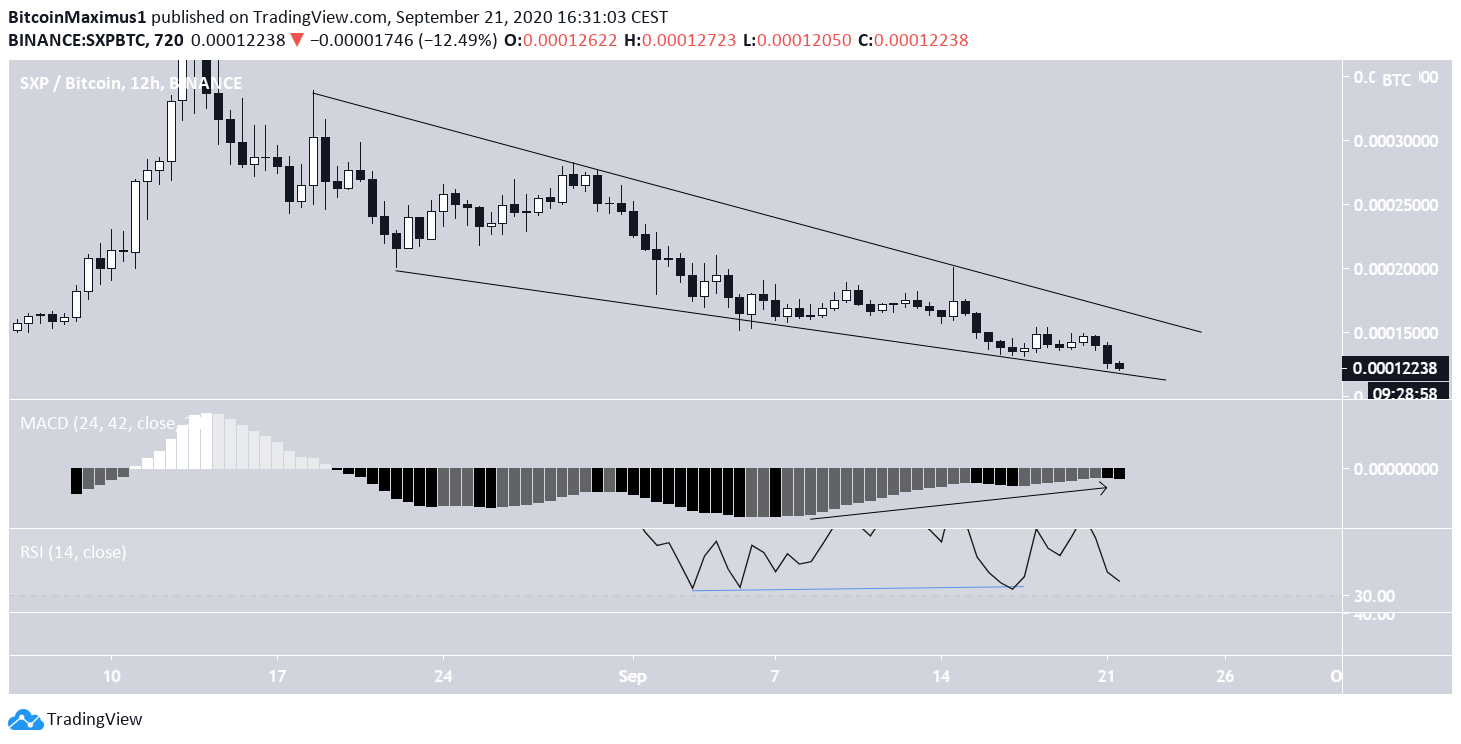
SXP/BTC
Cryptocurrency trader @Cryptobombshell outlined an SXP chart, stating that the price will soon break out from the descending wedge and head for new highs.
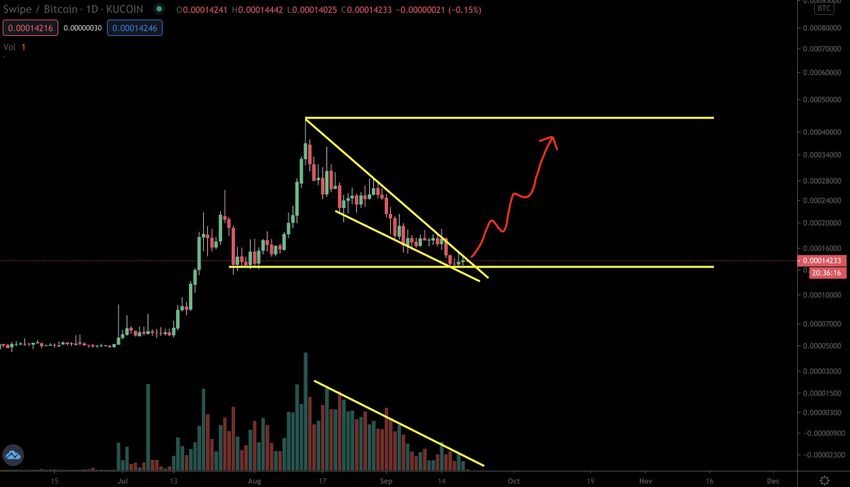
The SXP/BTC pair looks considerably more bullish than its /USD counterpart. Besides the descending wedge, there is bullish divergence in both the RSI & the MACD, the latter of which is close to crossing into positive territory.
Both these signs suggest the price is likely to break out from the wedge and head towards new highs.