


Swipe (SXP) has failed to break out above the $4.10 resistance area but temporarily stopped its decrease with a bounce at the $2.05 support area.
While the token is in the process of creating a bullish candlestick, there is strong resistance left to clear at $2.95 in order for the trend to be considered bullish.
SXP gets rejected
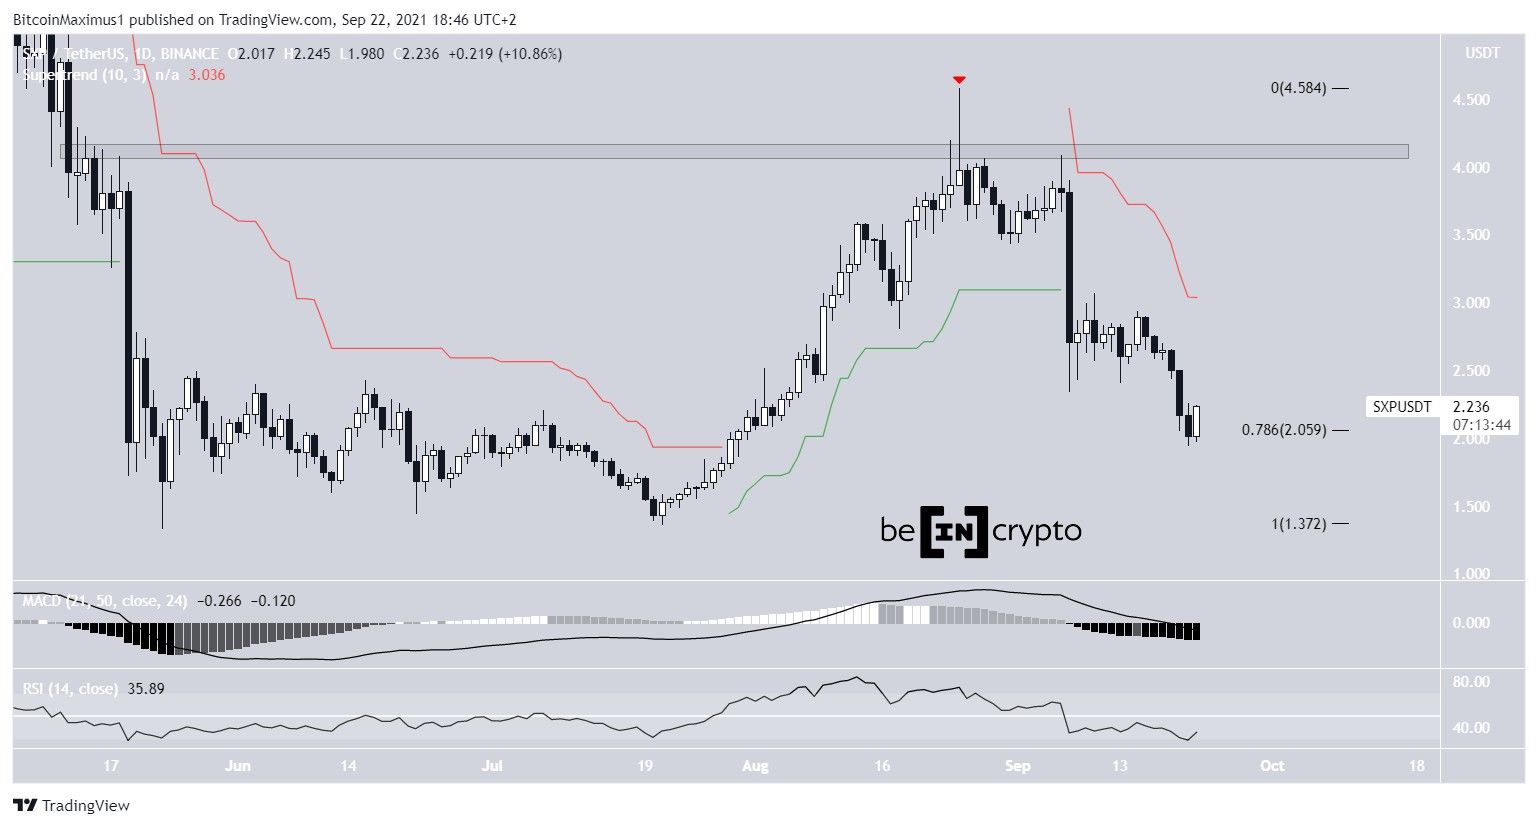
On Aug 25, SXP reached a high of $4.58, but was rejected and created a shooting star candlestick (red icon). This validated the $4.10 horizontal area as resistance. It has been moving downwards since and fell sharply on Sept 7.
After a brief upward movement, the token resumed its descent on Sept 15.
Technical indicators have turned bearish, supporting the legitimacy of the downward movement. The MACD and RSI are both decreasing. The former is negative, while the latter is below 50. Furthermore, the Supertrend is bearish.
However, SXP has bounced at the 0.786 Fib retracement support level at $2.06 and is in the process of creating a bullish engulfing candlestick.
Therefore, even though readings are still bearish, some sort of relief rally is currently transpiring.
Future movement
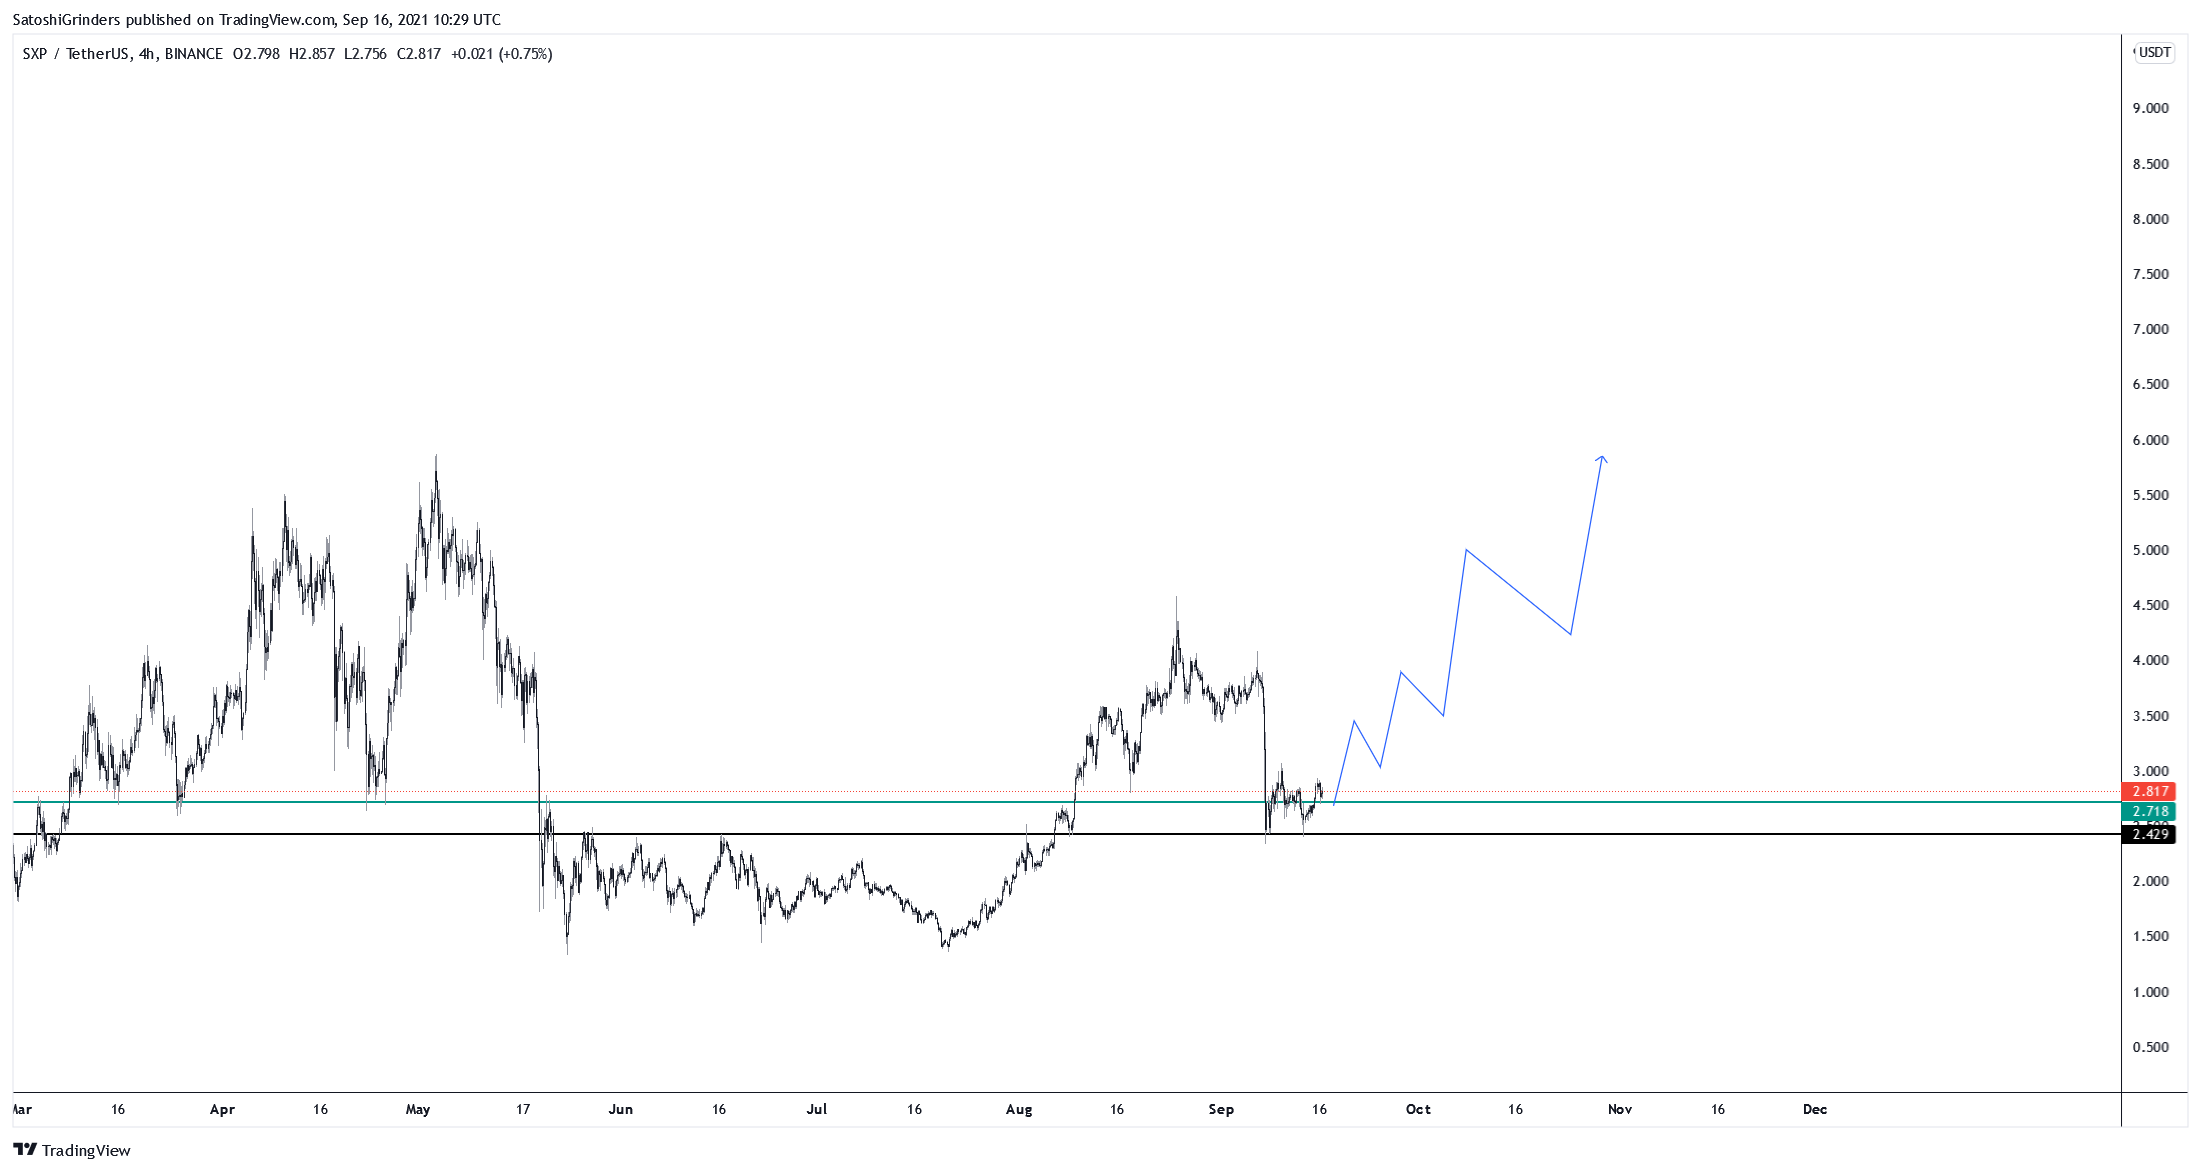
Cryptocurrency trader @Thebull_Crypto outlined a SXP chart, stating that the next upward movement could take it above $5
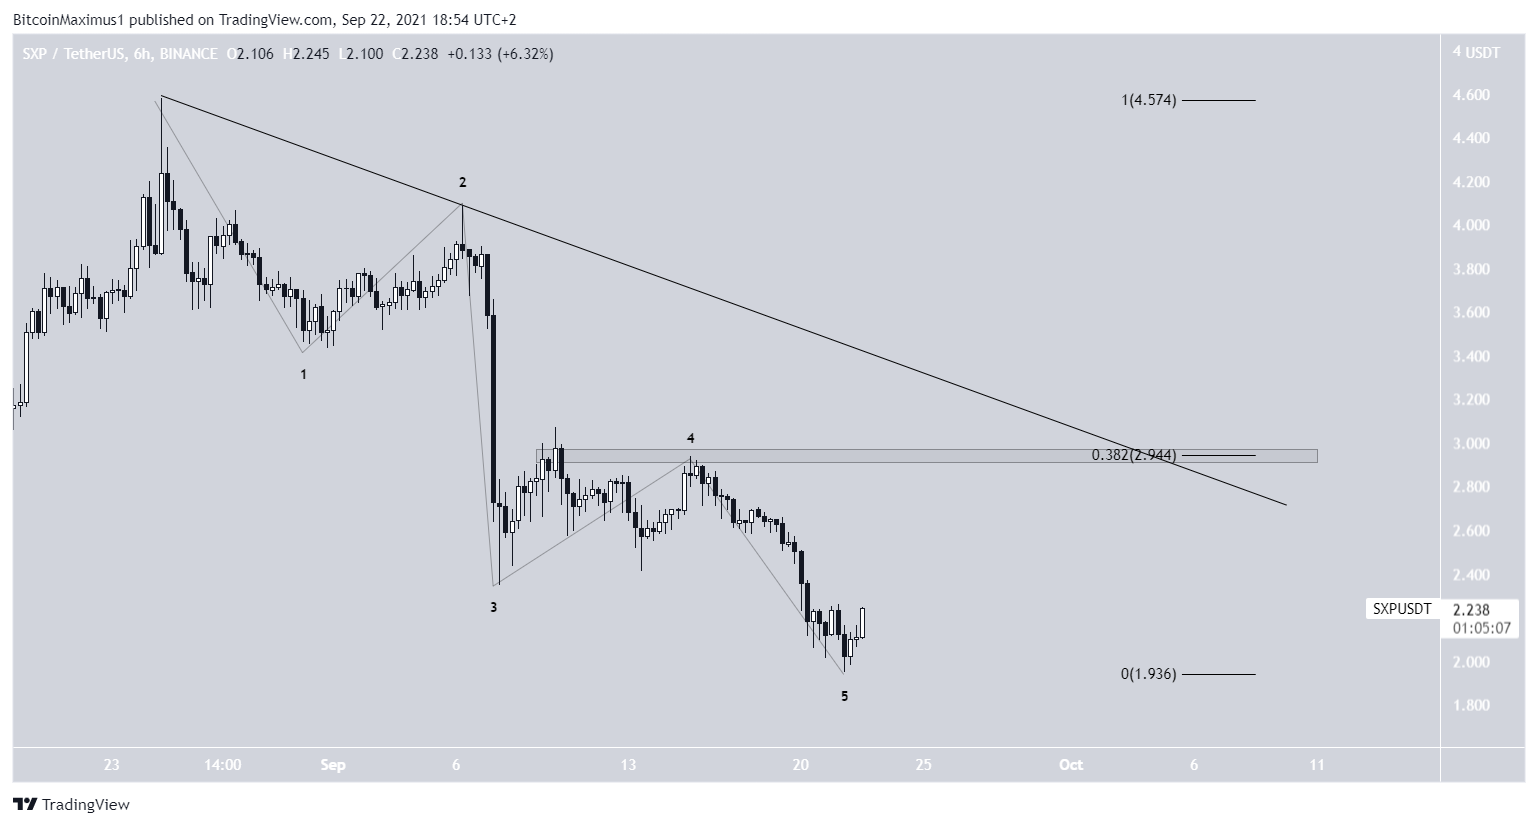
However, a look at the shorter-term six-hour chart shows that SXP has completed a five wave bearish impulse, which ended with the $1.95 low on Sept 21.
While the token is currently in the process of bouncing, there is very strong resistance at $2.95. This is the 0.382 Fib retracement resistance level and a horizontal resistance area which coincides with a potential descending resistance line. In addition to this, it is very close to the Supertrend line from the daily time-frame.
Therefore, while SXP seems likely to eventually get there, the trend cannot be considered bullish until a breakout above that level transpires.
For BeInCrypto’s latest Bitcoin (BTC) analysis, click here.


