


Swipe (SXP) has created a bullish reversal pattern and is showing signs that it will move upwards in the near future.
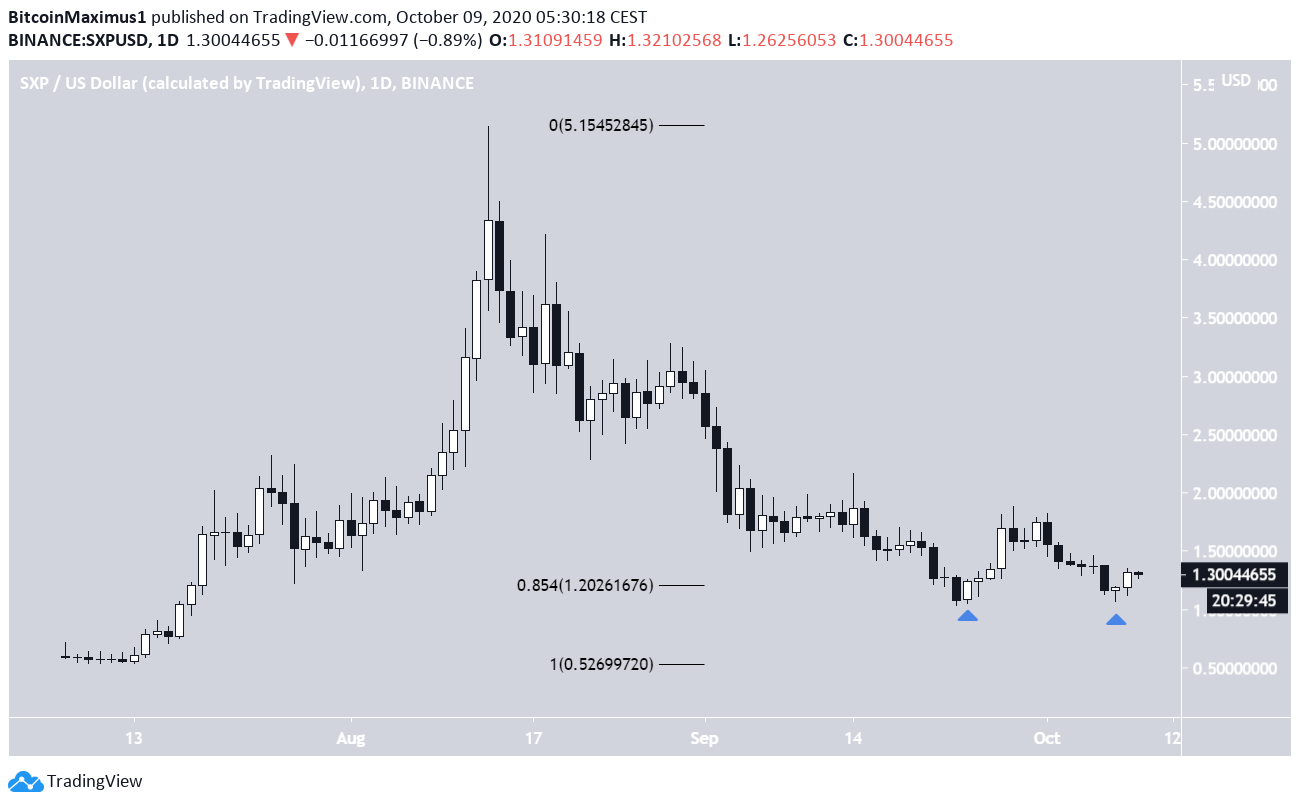
The SXP price has been decreasing since Aug 13, when it reached a high of $5.15. The decrease continued until a low of $1.04 was reached on Sept 24. This was just slightly below the 0.85 Fib retracement level of $1.20, which has since been reclaimed. Since then, the price has been increasing.
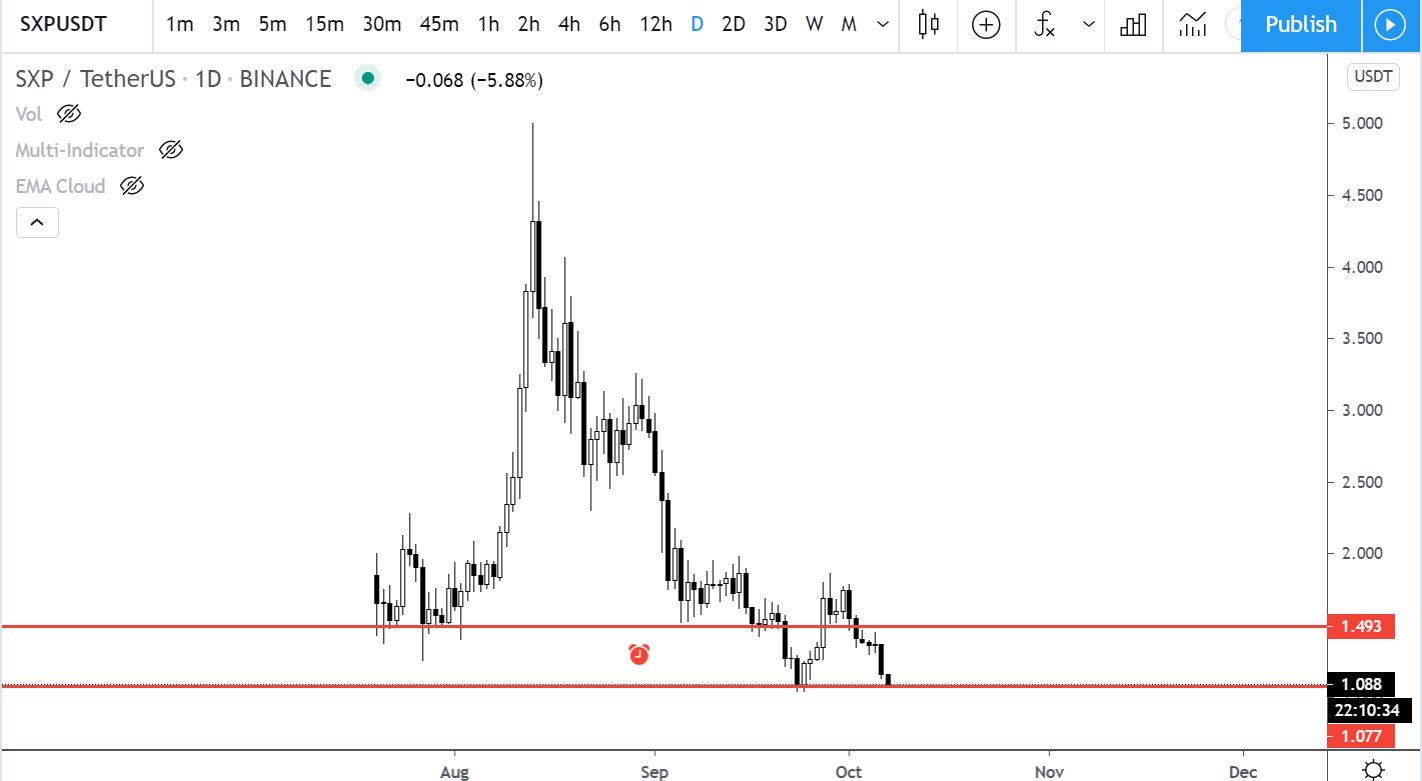
SXP Double-Bottom
On Oct 7, the price returned to $1.07, created a double bottom pattern, and began the current upward movement.
Cryptocurrency trader @devchart outlined an SXP chart which shows the double-bottom pattern. Since the tweet, the price has confirmed the pattern and began to move upwards.
Gunning for Gains
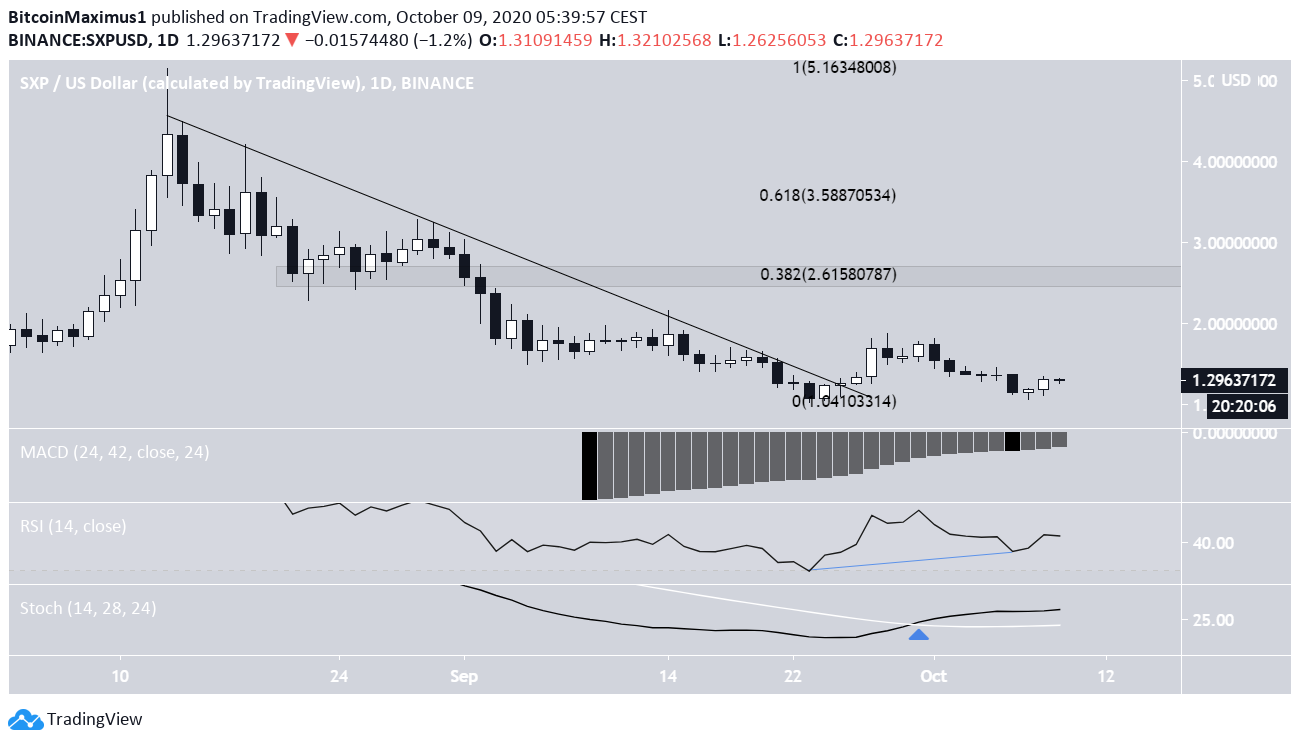
Technical indicators in the daily time-frame are bullish. The MACD is increasing, even though it has not reached positive territory yet. The RSI has generated bullish divergence and the Stochastic Oscillator has made a bullish cross.
In addition, while its slope is not certain due to numerous long wicks, it seems that the price has broken out from a descending resistance line.
These are all signs that SXP is expected to move upwards.
If it does, the next closest resistance area would likely be found at $2.61, the 0.382 Fib level of the entire decrease, and a previous support area. The next resistance area beyond that is found at $3.58.
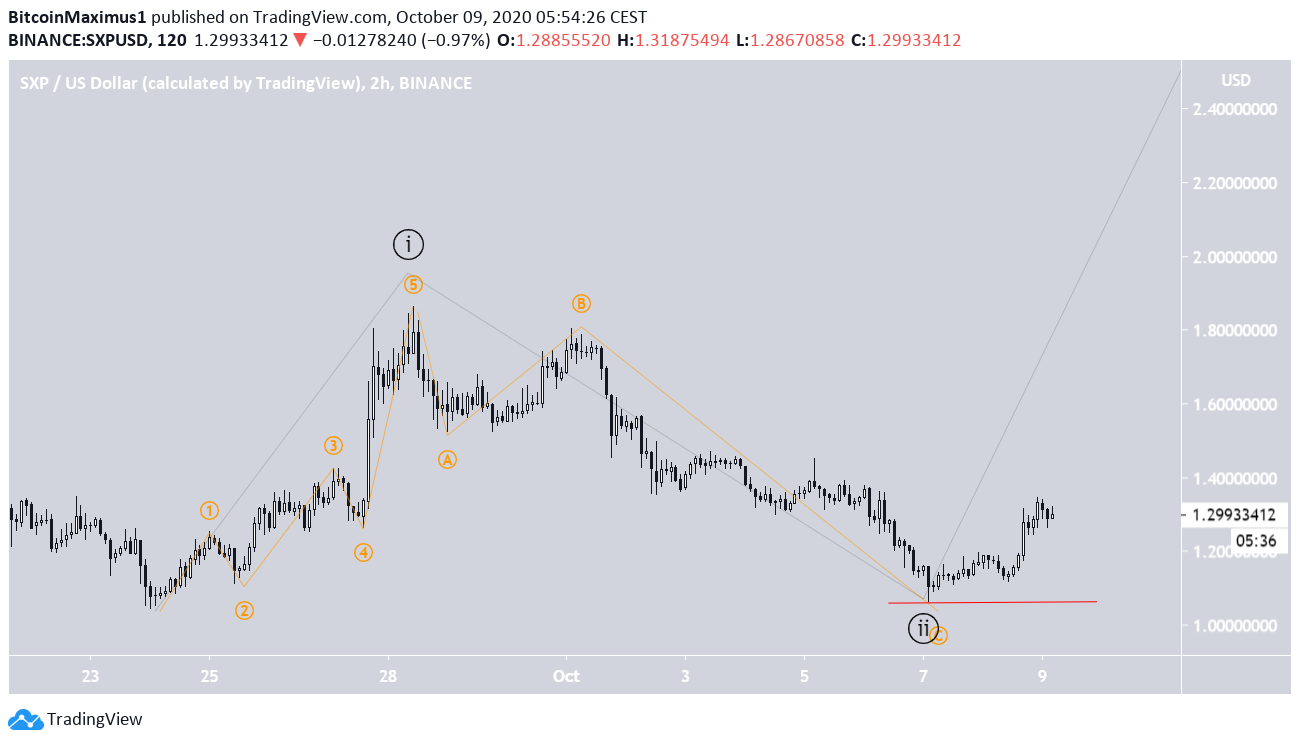
Wave Count
A look at the SXP movement since July reveals a completed bullish impulse and complex W-X-Y correction afterward (shown in black below). The sub-wave count is shown in blue.
If the count is correct, the aforementioned Sept 24 low, which made the first portion of the double-bottom pattern, marked the end of the corrective movement and the beginning of a new upward move.
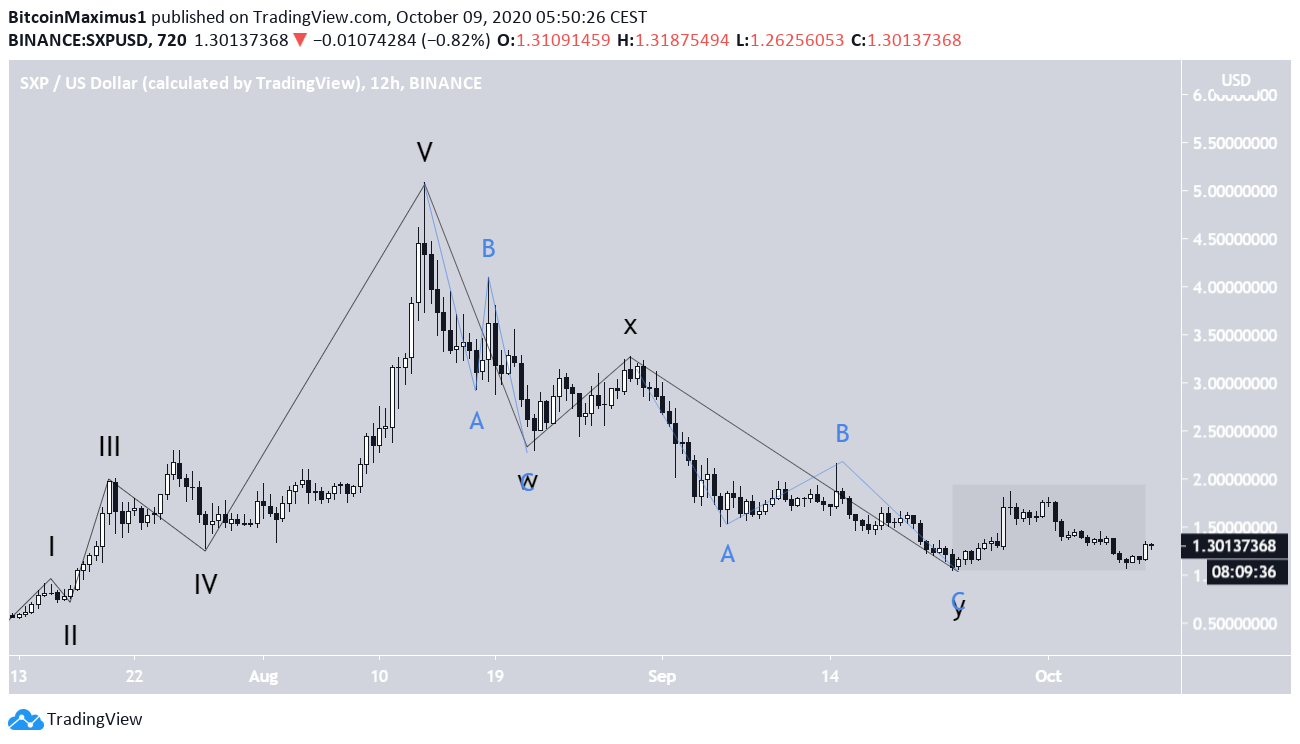
A closer look reveals a possibly completed 1-2 wave formation. Waves 3-4-5 would customarily follow afterward, which could take the price towards the previously mentioned $2.61 resistance area and beyond.
A decrease below the Oct 7 low of $1.06 would invalidate this particular wave count.
To conclude, the SXP price has created a double-bottom pattern and possibly began a bullish impulse, which could take it towards higher resistance areas.
For BeInCrypto’s latest Bitcoin analysis, click here!
Disclaimer: Cryptocurrency trading carries a high level of risk and may not be suitable for all investors. The views expressed in this article do not reflect those of BeInCrypto.


