Swipe has broken out from a descending resistance line.
There are resistance levels at $2.40 and $3.10.
SXP is potentially trading inside an ascending parallel channel.
promo
Swipe (SXP) has been gradually moving upwards since May 19 and has broken out from a descending resistance line.
However, it has failed to reclaim an important horizontal level and could be trading inside a corrective pattern.
Long-term Swipe movement
SXP has been moving downwards since reaching a high of $5.97 on May 3. So far, it has managed to reach a low of $1.33 on May 23.
SXP has been moving upwards since and has failed to break out above the $2.40 horizontal resistance area. If it were to do so, the next resistance would be found at $3.10. This target is the 0.382 Fib retracement resistance level.
Despite the bounce, technical indicators are still bearish. The Stochastic oscillator has made a bearish cross, the MACD is decreasing, and the RSI is still below 50.
SXP Chart By TradingView
SXP breaks out
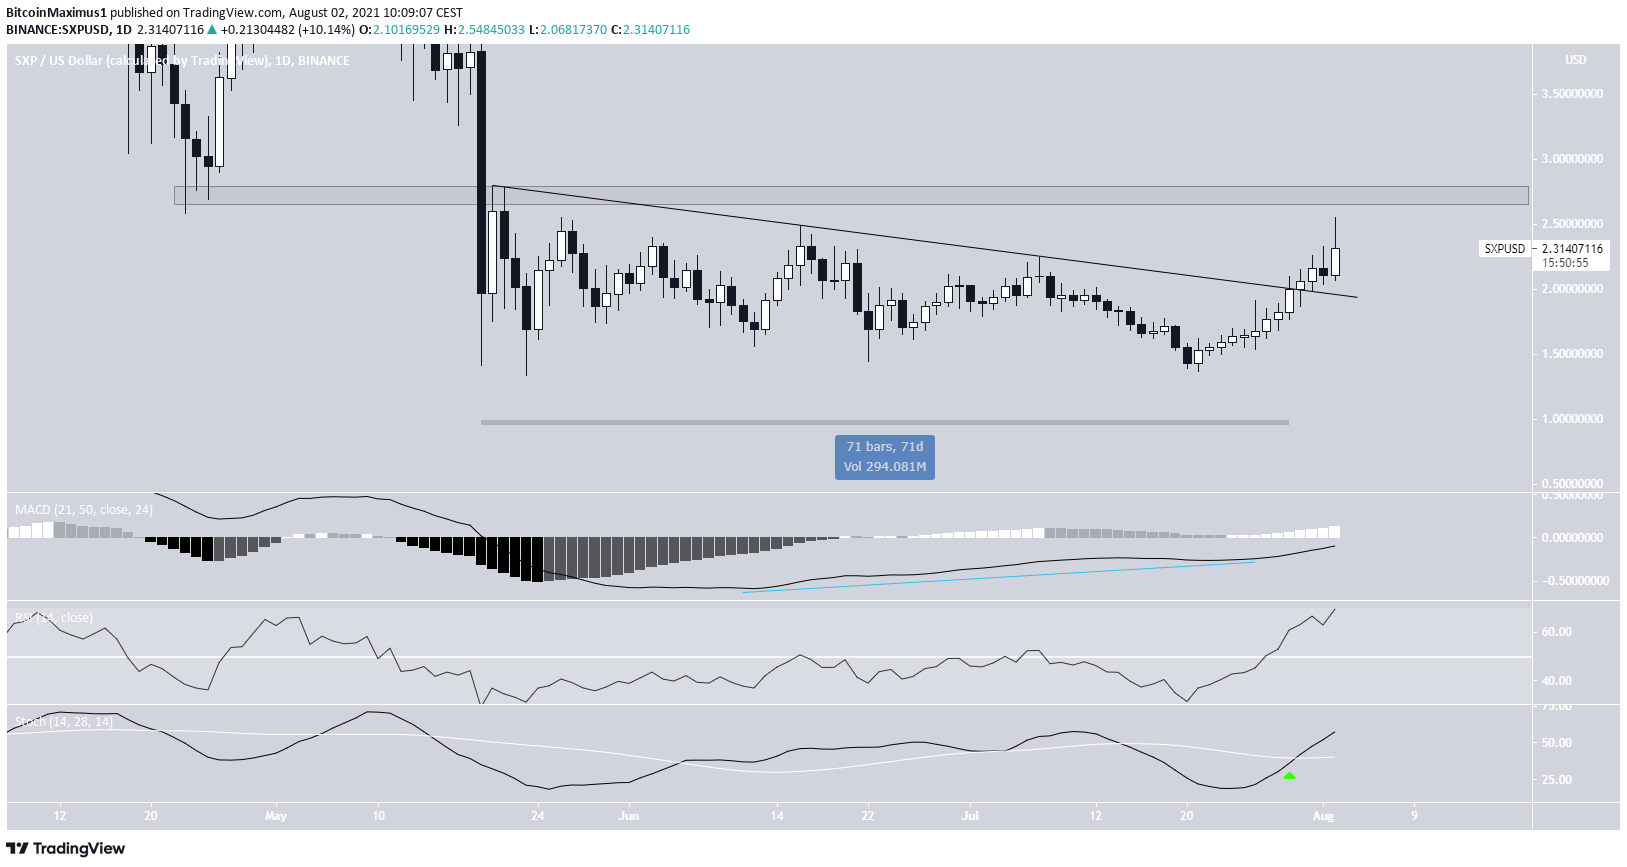
The daily chart provides a more bullish outlook. After consolidating for 71 days, SXP managed to break out from a descending resistance line. The breakout was preceded by a bullish divergence in the MACD signal line.
In addition to this, the Stochastic oscillator has made a bullish cross and the RSI has moved above 50.
In this time-frame, the main resistance is found at $2.70.
Therefore, when combining the outlooks from the weekly and daily time frames, we can see strong resistance levels between $2.40 and $3.10. Until SXP manages to reclaim them, the trend cannot be considered bullish, despite some bullish readings from indicators.
SXP Chart By TradingView
Wave count
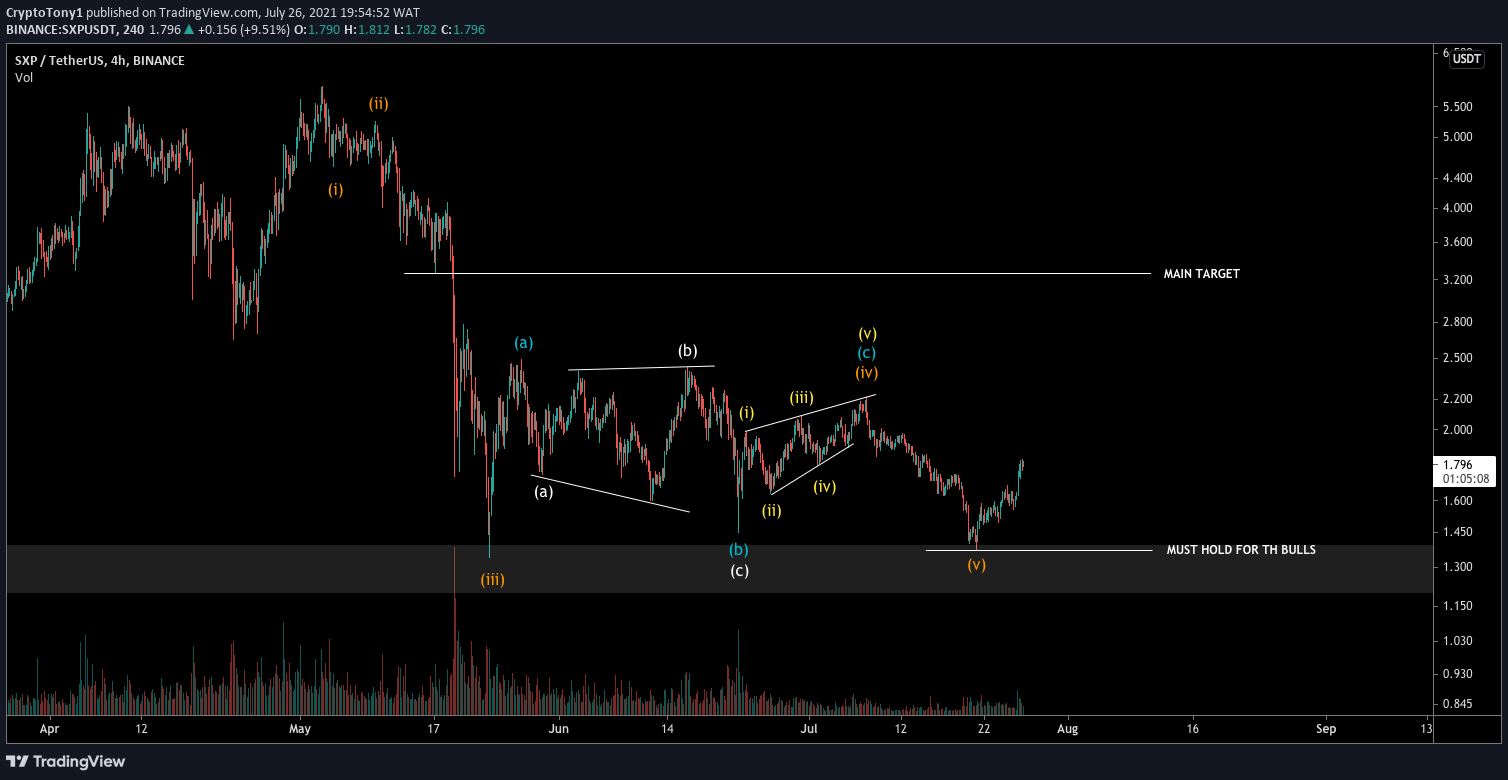
Cryptocurrency trader @CryptoTony_ outlined an SXP chart, stating that the token has likely completed its correction.
Source: Twitter
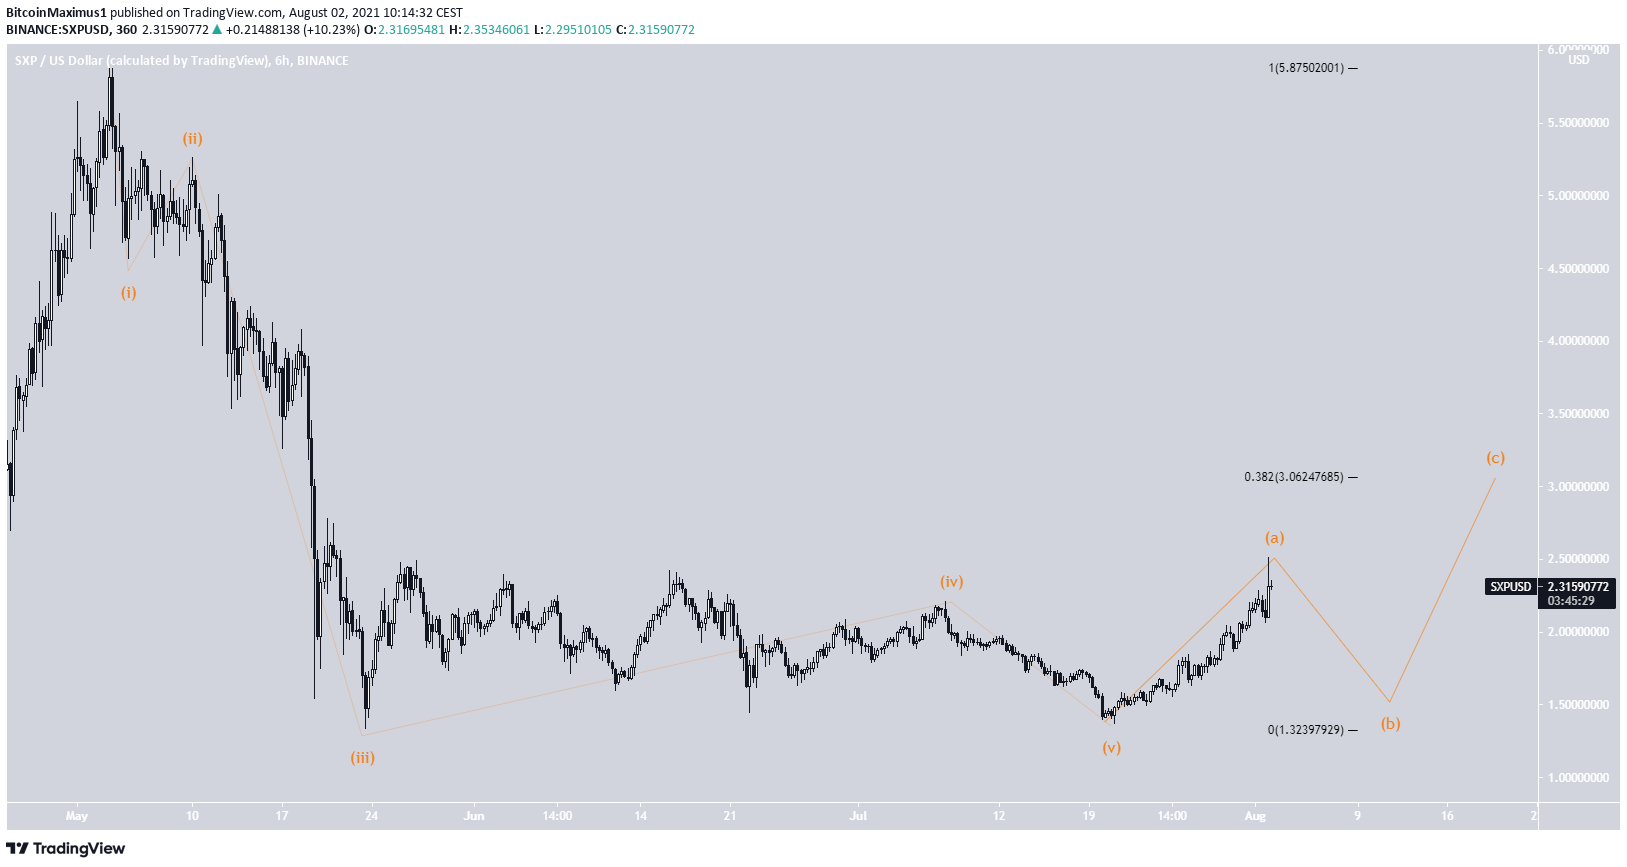
A potential wave count suggests that a bearish impulse ended with the July 20 low. In this case, wave five was truncated, since it ended above the wave three low.
If correct, SXP has now begun an A-B-C corrective structure. After a short-term drop, it would be expected to increase toward $3.10.
SXP Chart By TradingView
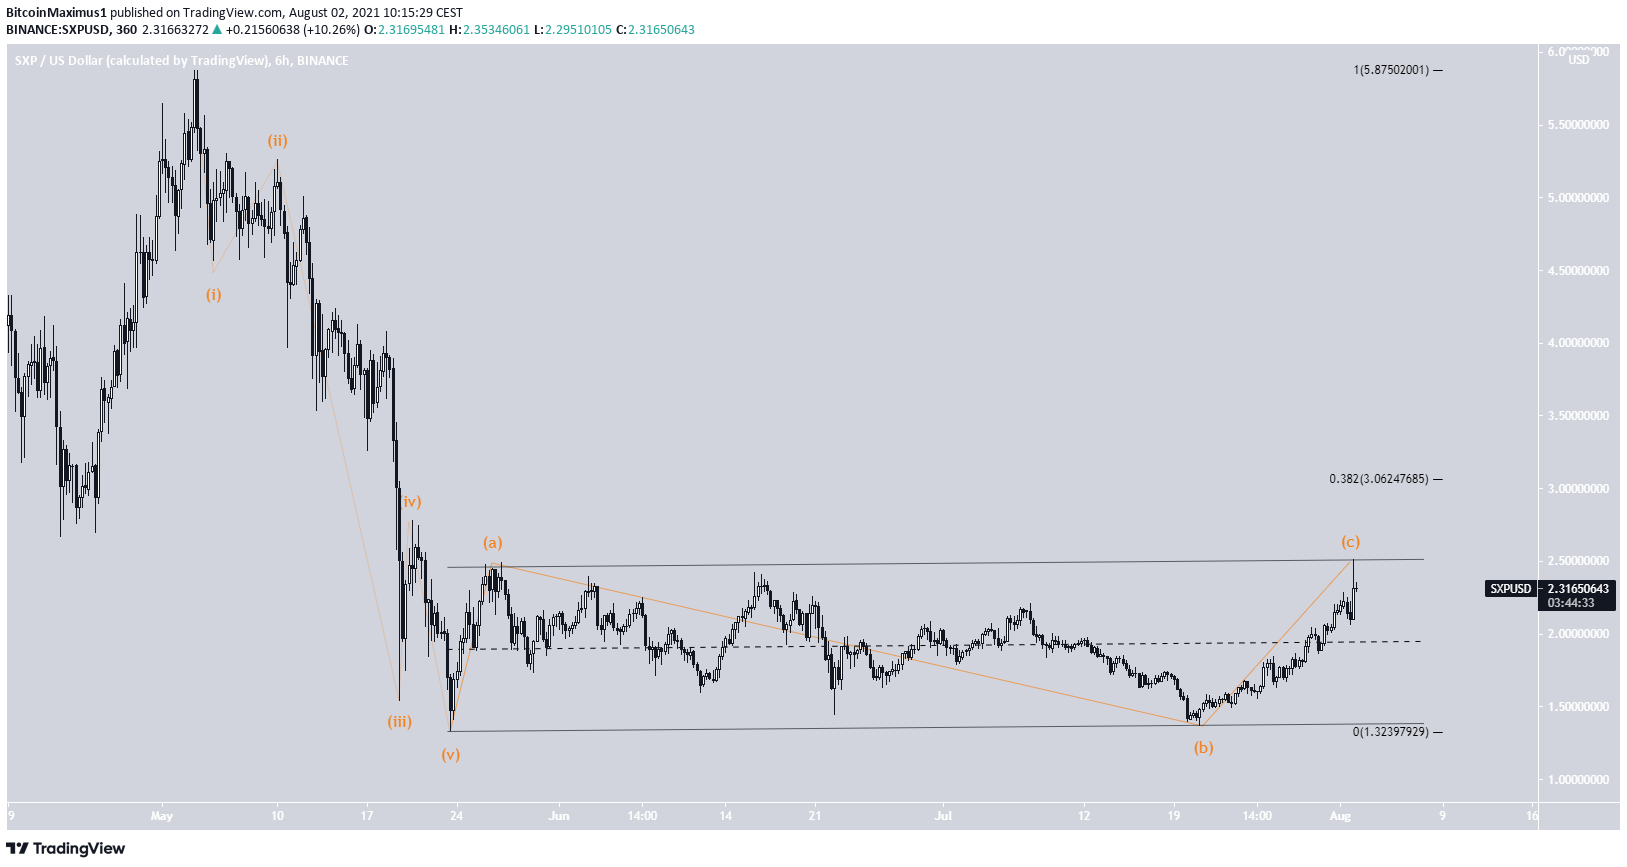
Another potential count indicates that the bearish impulse ended with the May 19 low. In this case, there is no truncation for wave five.
If correct, SXP would be in the C wave of an A-B-C corrective structure. The fact that the structure is contained inside an ascending parallel channel indicates that this is likely to be the correct count.
Unless Swipe manages to break out from the channel, this seems to be the most likely movement.
SXP Chart By TradingViewFor BeInCrypto’s latest bitcoin (BTC) analysis, click here.
In line with the Trust Project guidelines, this price analysis article is for informational purposes only and should not be considered financial or investment advice. BeInCrypto is committed to accurate, unbiased reporting, but market conditions are subject to change without notice. Always conduct your own research and consult with a professional before making any financial decisions. Please note that our Terms and Conditions, Privacy Policy, and Disclaimers have been updated.
Valdrin discovered cryptocurrencies while he was getting his MSc in Financial Markets from the Barcelona School of Economics. Shortly after graduating, he began writing for several different cryptocurrency related websites as a freelancer before eventually taking on the role of BeInCrypto's Senior Analyst.
(I do not have a discord and will not contact you first there. Beware of scammers)