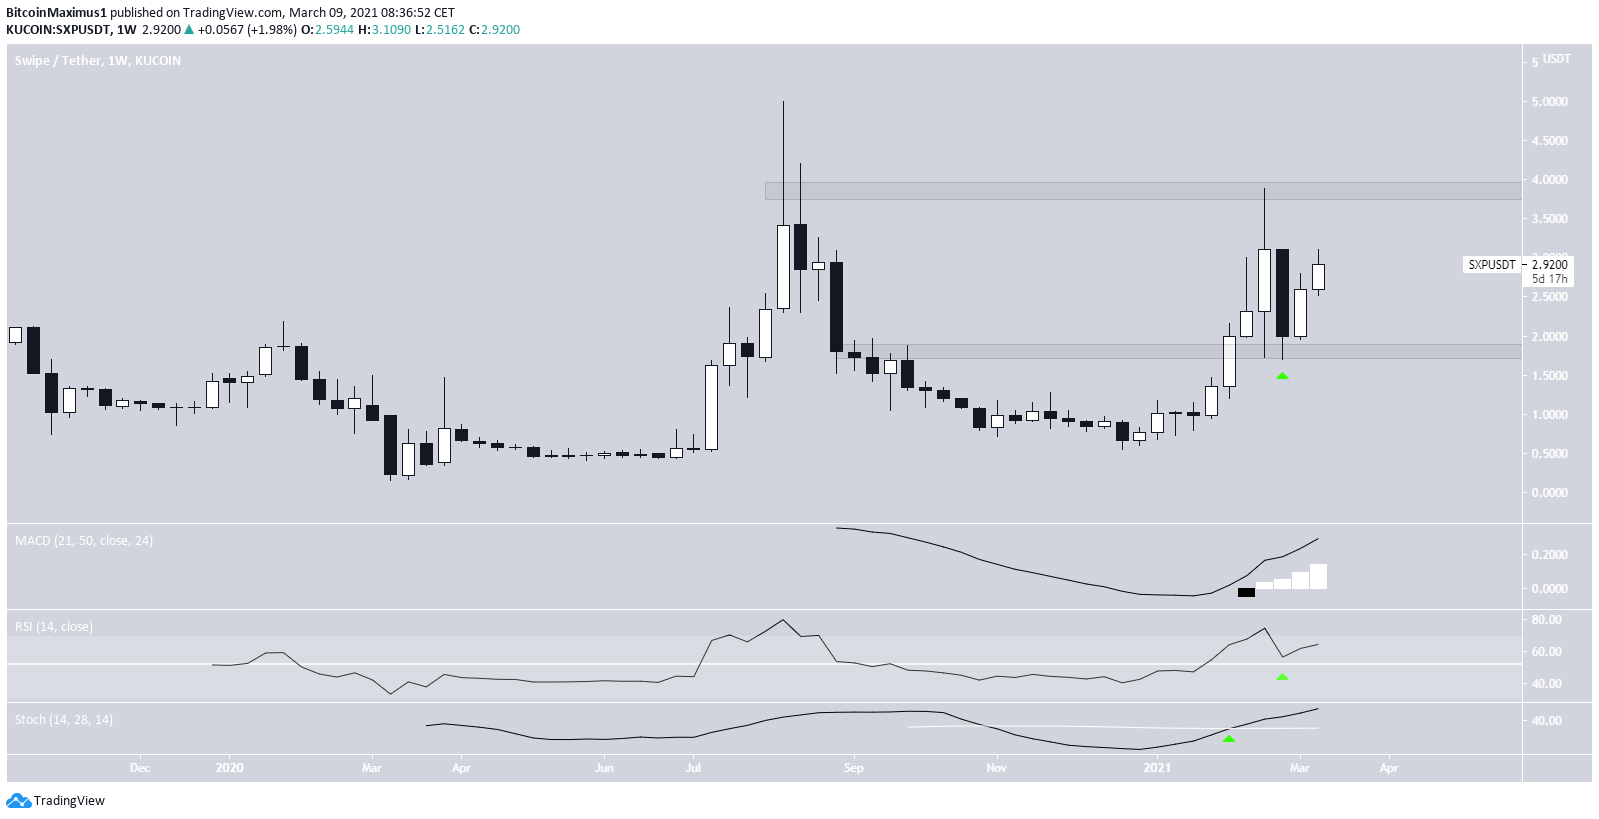
The Swipe (SXP) price has been trading inside a long-term range since Sept. 2020.
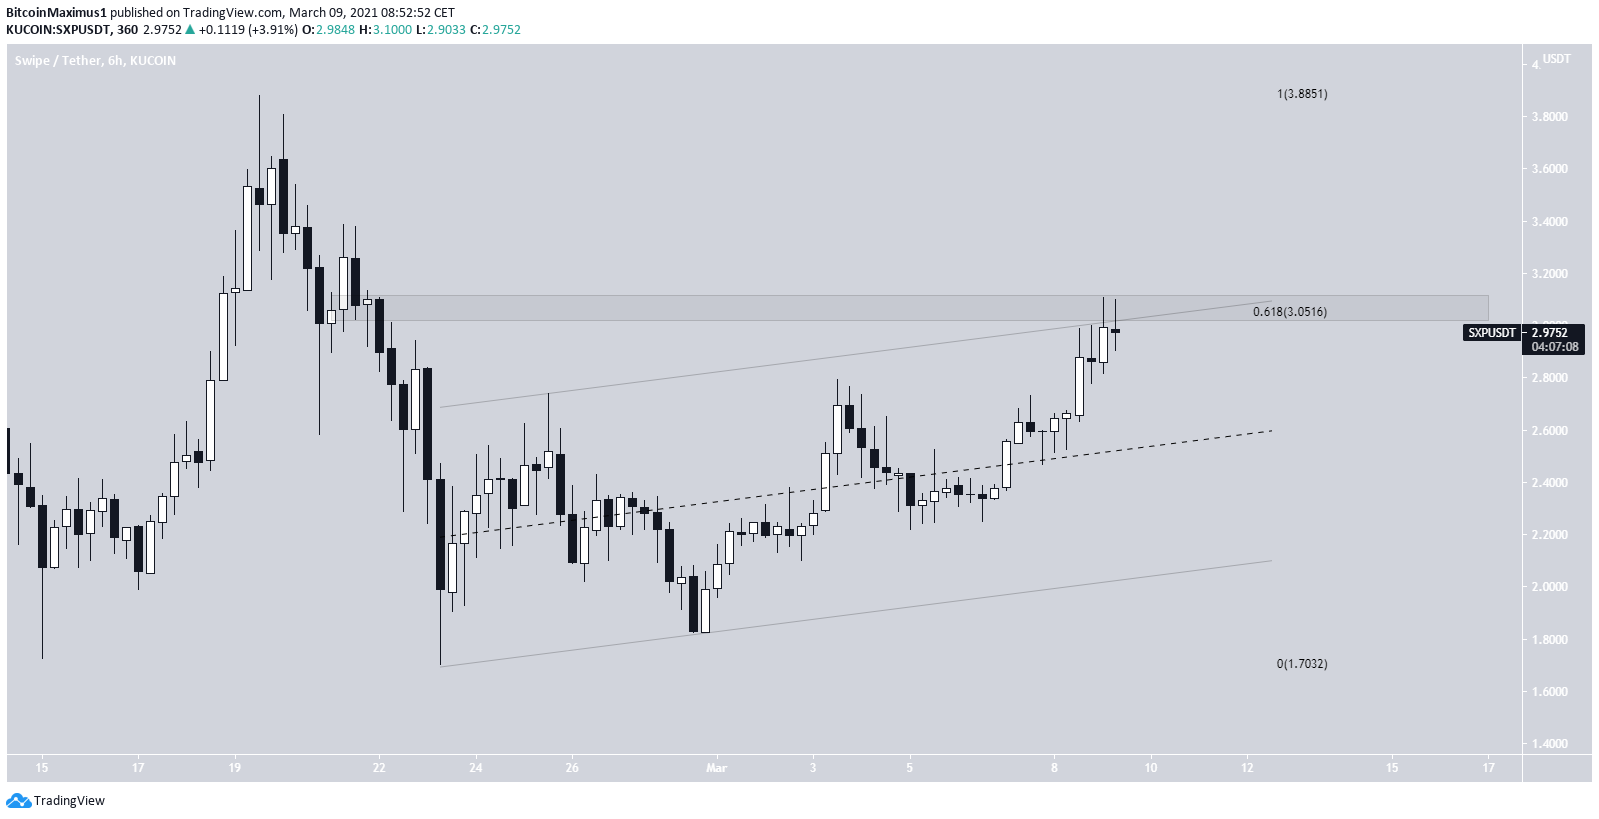
Swipe is also trading inside a short-term resistance area and channel. Whether it gets rejected from these levels or breaks out will likely determine the direction of the short-term trend.
Swipe Long-Term Range
In August 2020, SXP reached an all-time high price of $3.99 but failed to sustain. It created a very long upper wick. SXP has been decreasing since, culminating with a low of $0.55 in December 2020. However, SXP has been moving upwards since.
On Feb. 21, SXP managed to increase considerably and reached the $3.90 resistance area. Nevertheless, the resistance cannot be accurately isolated due to numerous long upper wicks.
The dip that followed took SXP to the $1.80 support area.
Currently, SXP is trading in a range between these two levels.
Technical indicators are bullish. There has been a bullish cross in the Stochastic oscillator and the MACD has turned positive.
New Impulse or Retracement?
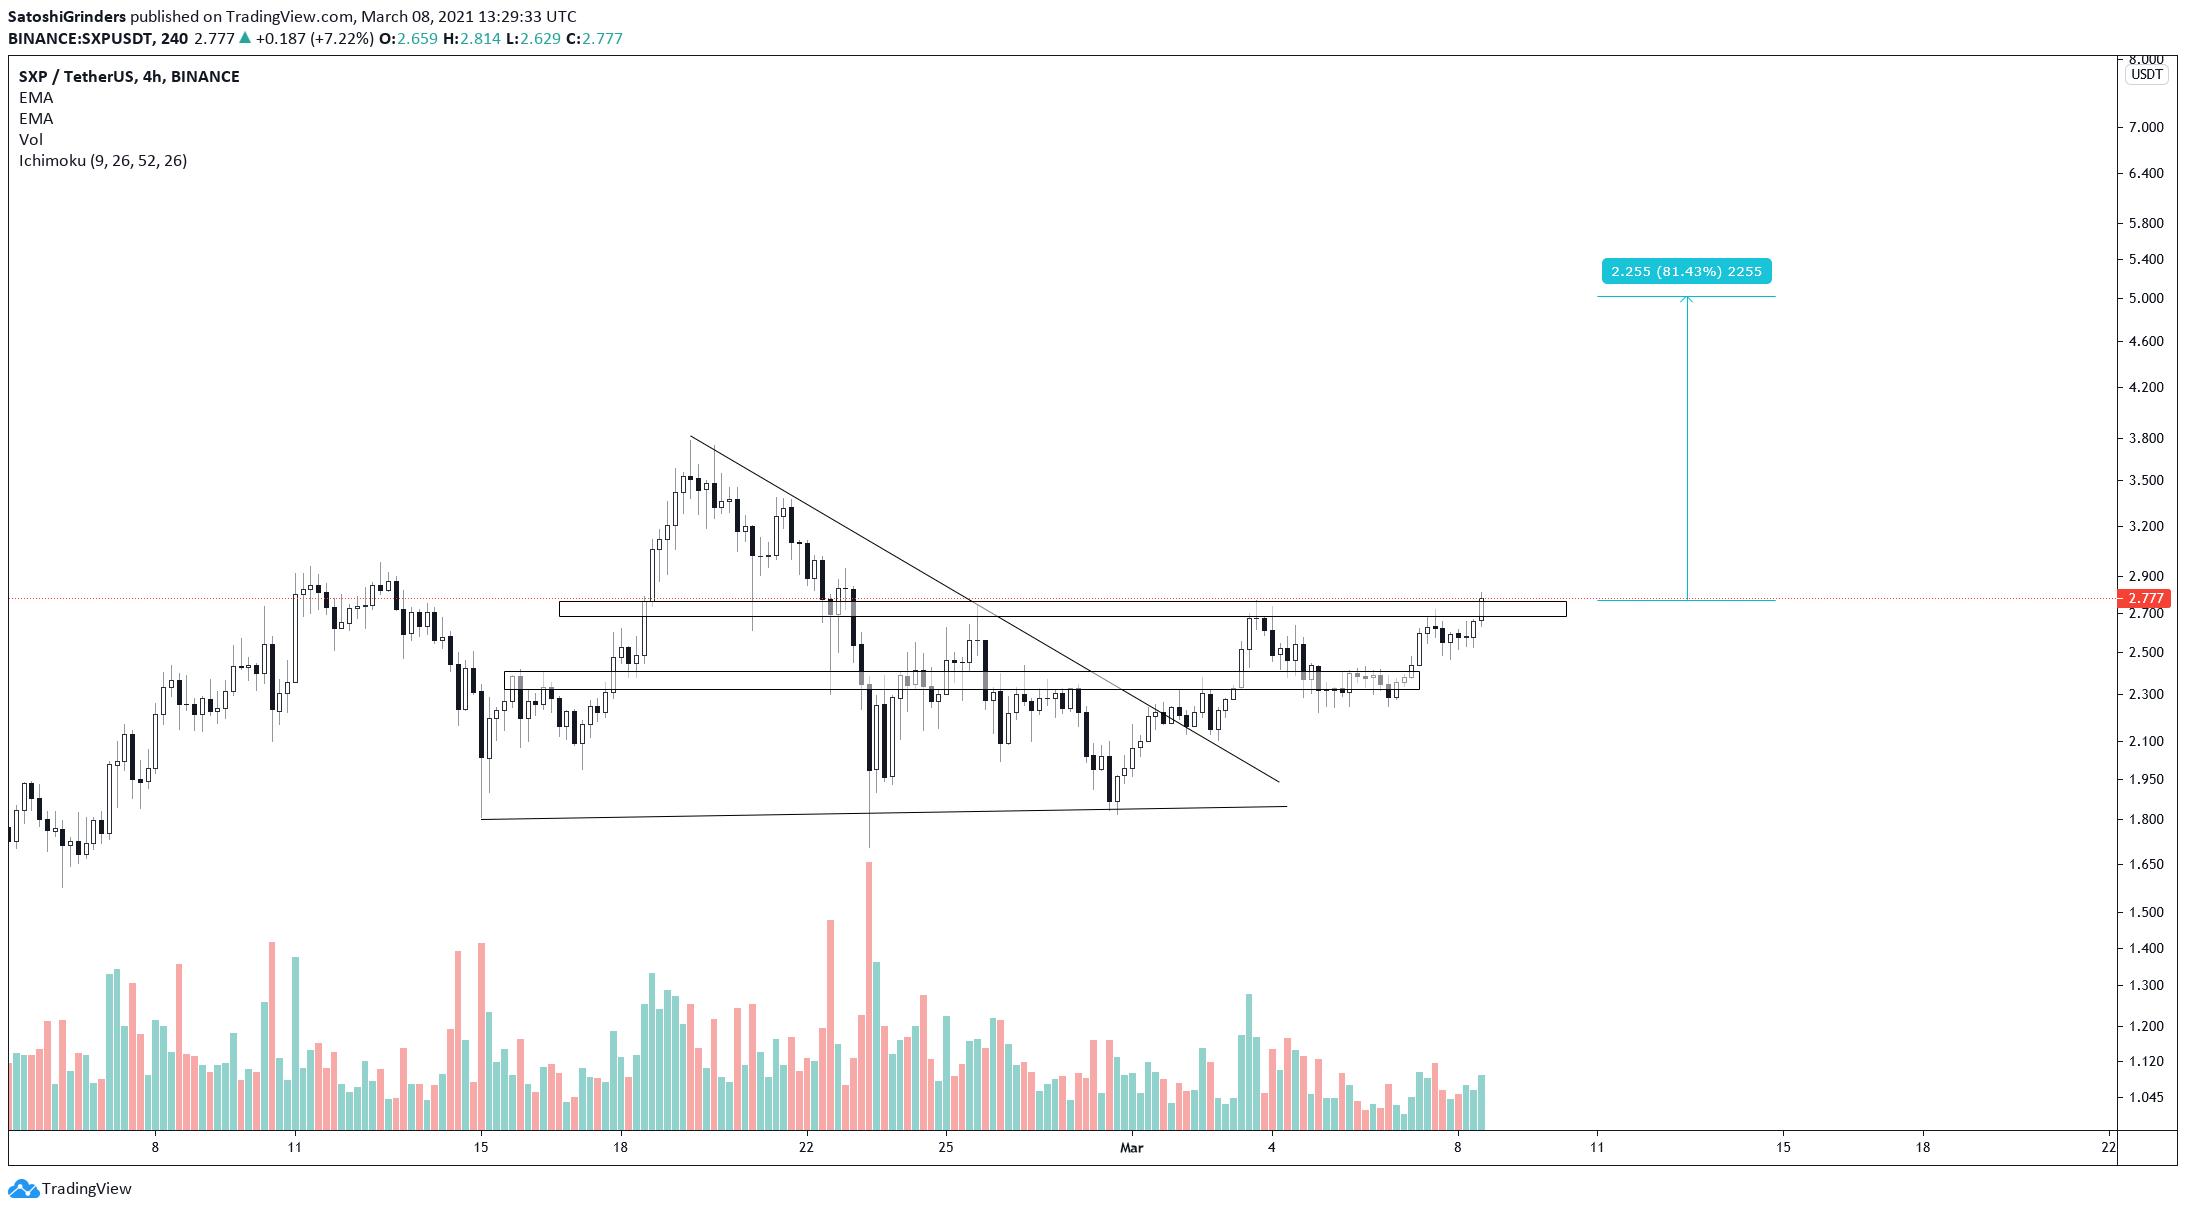
Cryptocurrency trader @Thebull_Crypto stated that once SXP moves above this horizontal level, it’s expected to increase all the way to $5.
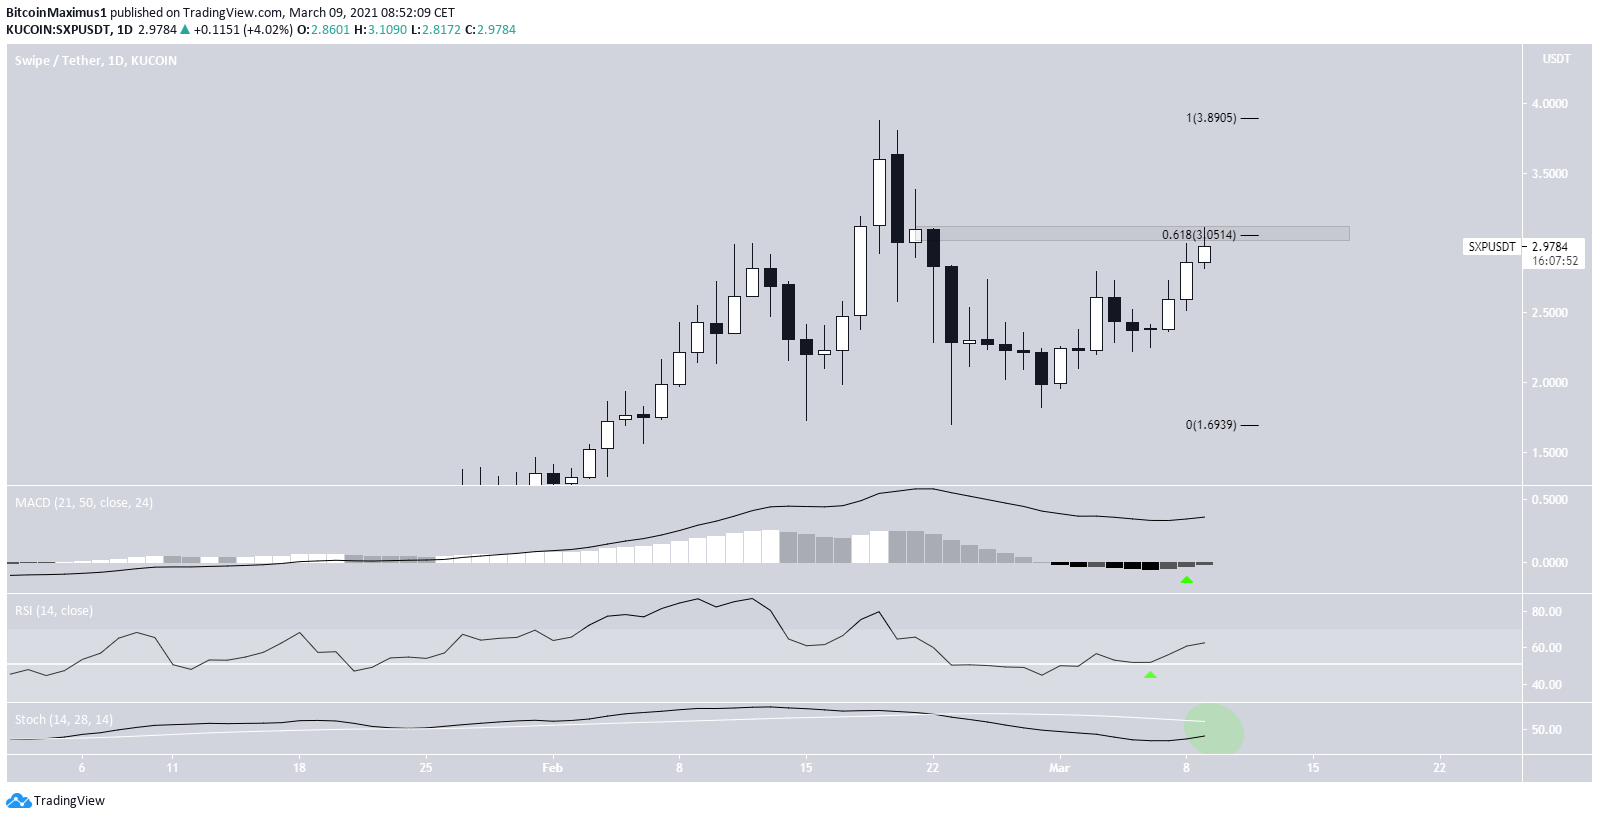
The aforementioned horizontal level is found at $3.05. This price coincides with the 0.618 Fib retracement level from the most recent decrease.
Similarly to the weekly time-frame, technical indicators are bullish. This is evidenced by the bullish reversal in the MACD.
However, until SXP manages to close above this area, we cannot confidently indicate that the correction is over.
The six-hour chart supports this. It shows that SXP is trading inside a parallel channel. Movement contained within parallel lines is often corrective.
Since the resistance of the channel coincides with the horizontal resistance area, a breakout is required for confirmation of the bullish trend.
SXP Wave Count
The wave count indicates that SXP has either just begun wave five or is in wave four of a bullish impulse (white). It’s not yet certain if wave four has completed or if it will develop into a triangle or a complex correction.
However, the price is expected to eventually complete wave five, which would likely take it to a new all-time high. The most likely target for the top of the movement is found between $4.94-$5.05

Conclusion
The short-term Swipe trend remains uncertain until it gets rejected or breaks out above $3.05.
However, the long-term trend is considered bullish and a new all-time high price is eventually expected.
For BeInCrypto’s latest Bitcoin (BTC) analysis, click here.
Disclaimer
In line with the Trust Project guidelines, this price analysis article is for informational purposes only and should not be considered financial or investment advice. BeInCrypto is committed to accurate, unbiased reporting, but market conditions are subject to change without notice. Always conduct your own research and consult with a professional before making any financial decisions. Please note that our Terms and Conditions, Privacy Policy, and Disclaimers have been updated.


