


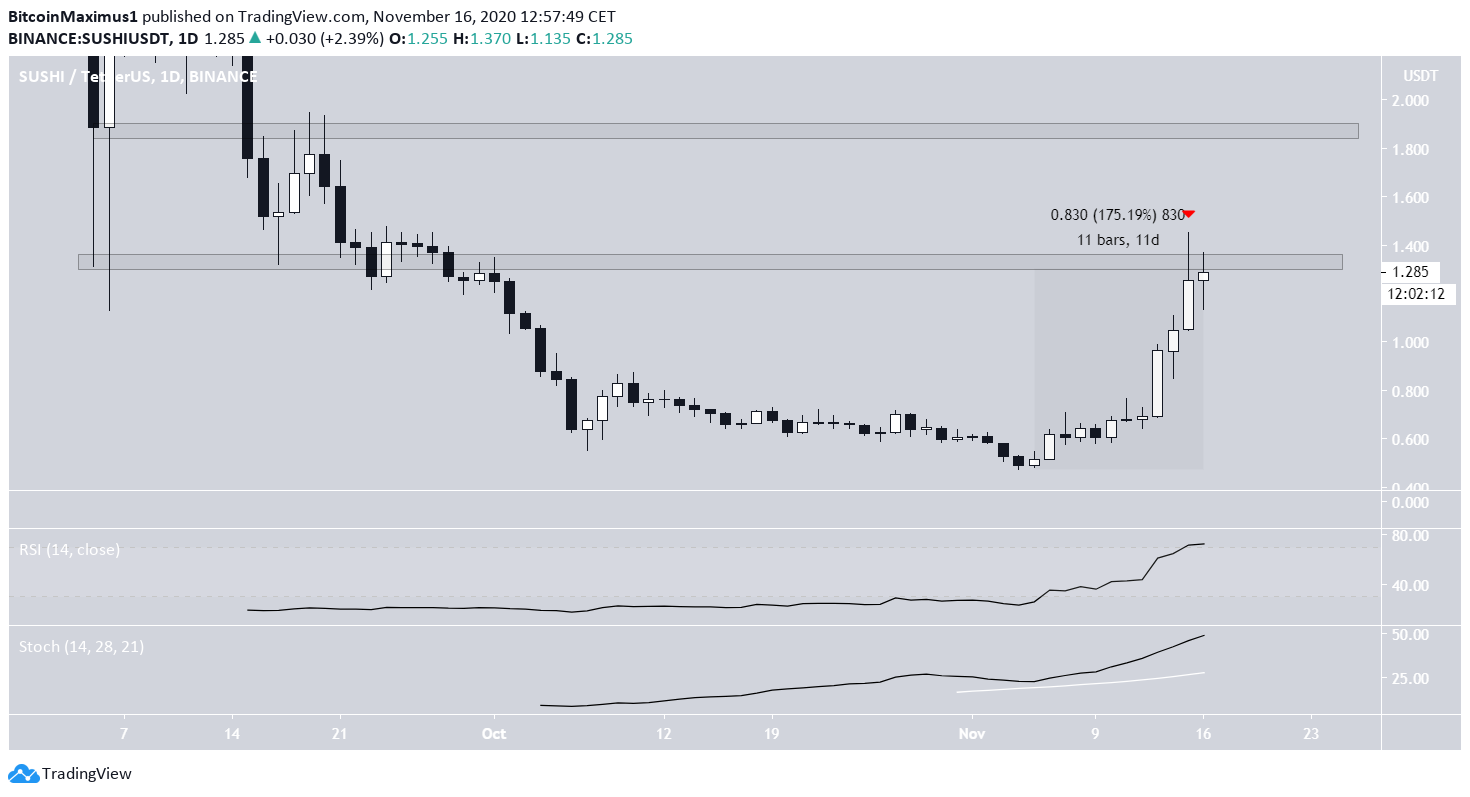
Since Nov 6, the SushiSwap (SUSHI) price has increased by a massive 175% but has failed to reach a close above an important resistance level.
After a short-term retracement, the price is expected to eventually be successful in moving above this area.
SUSHI Faces Resistance
Since reaching an all-time low price of $0.47 on Nov 4, the SUSHI price has been subject to a massive price increase, measuring 175% to date. The price reached a high of $1.45 on Nov 15, but created a long upper wick and decreased slightly afterward. SUSHI is currently trading for $1.33.
The upper wick also highlighted a failure to close above the main resistance area found at $1.33. Despite the rejection, both the RSI and Stochastic oscillator are still increasing, even if the former is overbought.
Due to the rate of the increase, there is almost no support below the current price.
If SUSHI was successful in breaking out above the current resistance area, the next would be found at $1.88.
Possible Retracement
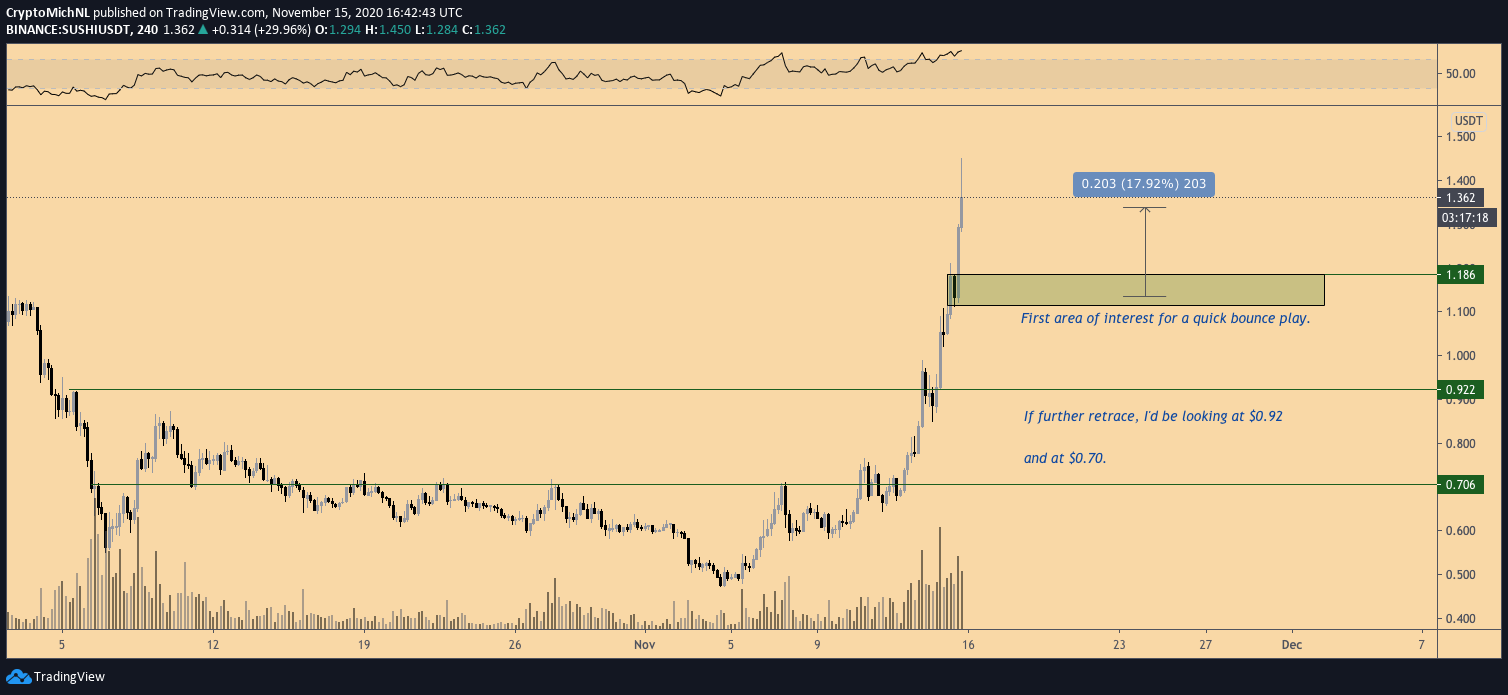
Cryptocurrency trader @CryptoMichNL tweeted a SUSHI chart, stating that he is expecting a retracement towards $1.10 or $0.90 before any further action to the upside.
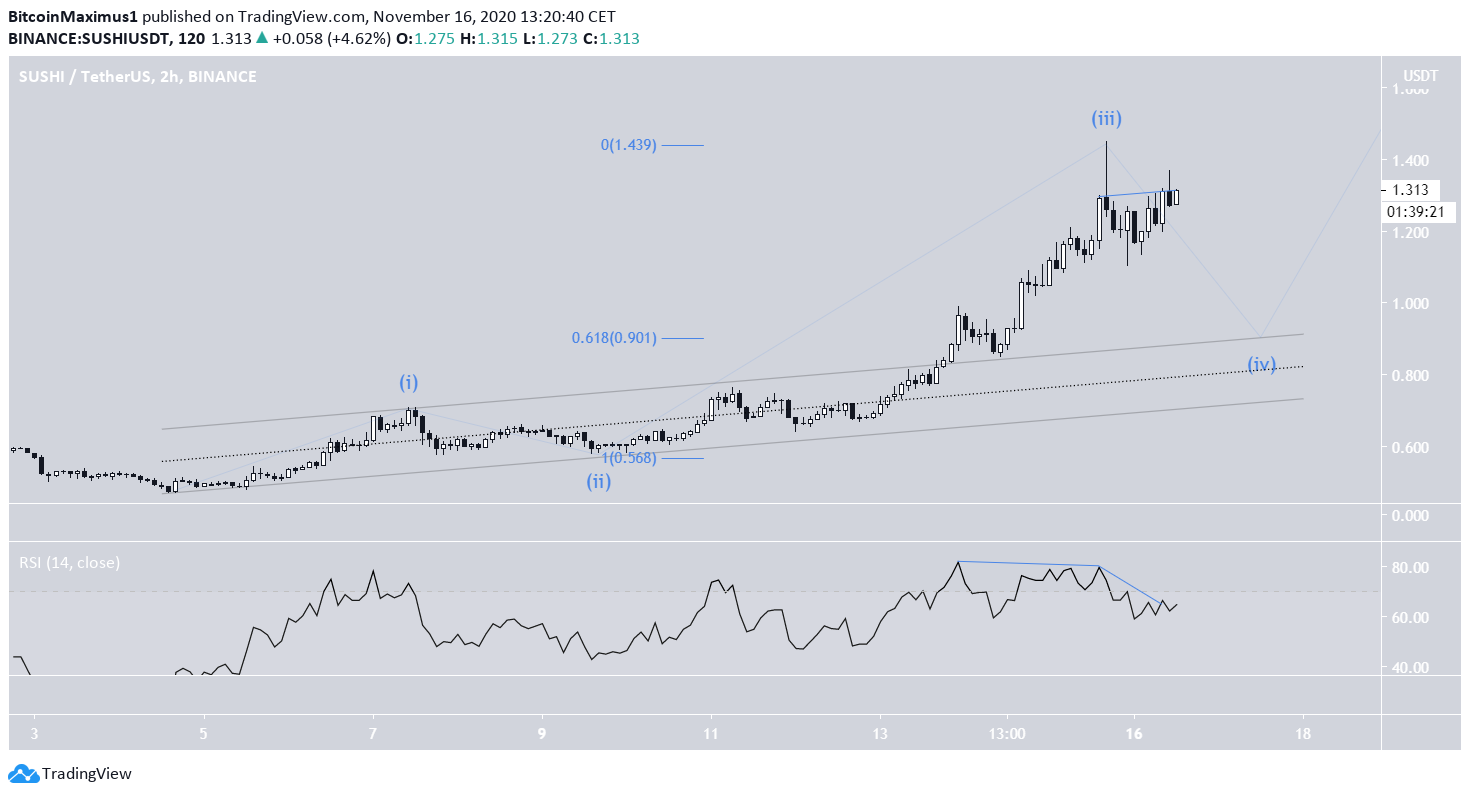
The shorter-term two-hour chart does indeed show signs of weakness. There is a possible double top pattern developing near $1.30, which has been combined with a bearish divergence in the RSI. This is a sign of weakness that indicates that the price might decrease. In addition, it coincides with a possible wave 3 top (shown in blue below).
If so, a confluence of support levels would be found at $0.90, the 0.618 Fib retracement level, and the resistance line of a channel drawn when connecting the top and bottom of waves 1 and 2.
The proposed decrease would create what is known as a fourth wave pullback, after which the price would be expected to increase and complete the fifth and final wave.
DeFi Index
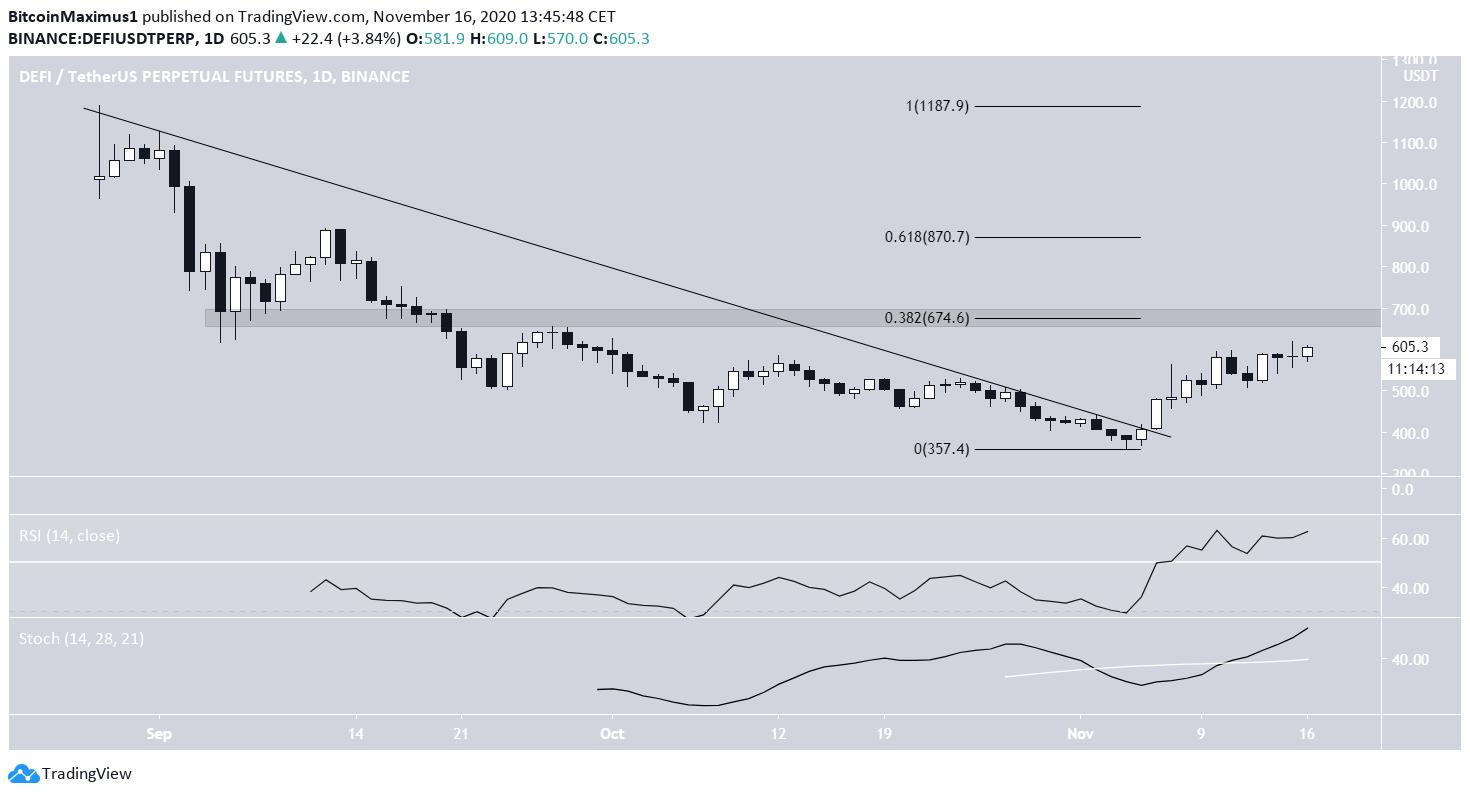
The DeFi index has also been increasing since breaking out from a descending resistance line on Nov 6. Despite the increase, the price has yet to reach the first significant resistance area, found at $675.
Technical indicators do not yet show any weakness, so the price is expected to continue increasing until it reaches the area.
Conclusion
While short-term decreases could occur, both SUSHI and the DeFi index are expected to continue moving upwards towards the resistance areas outlined above.
For BeInCrypto’s previous Bitcoin analysis, click here!
Disclaimer: Cryptocurrency trading carries a high level of risk and may not be suitable for all investors. The views expressed in this article do not reflect those of BeInCrypto
