


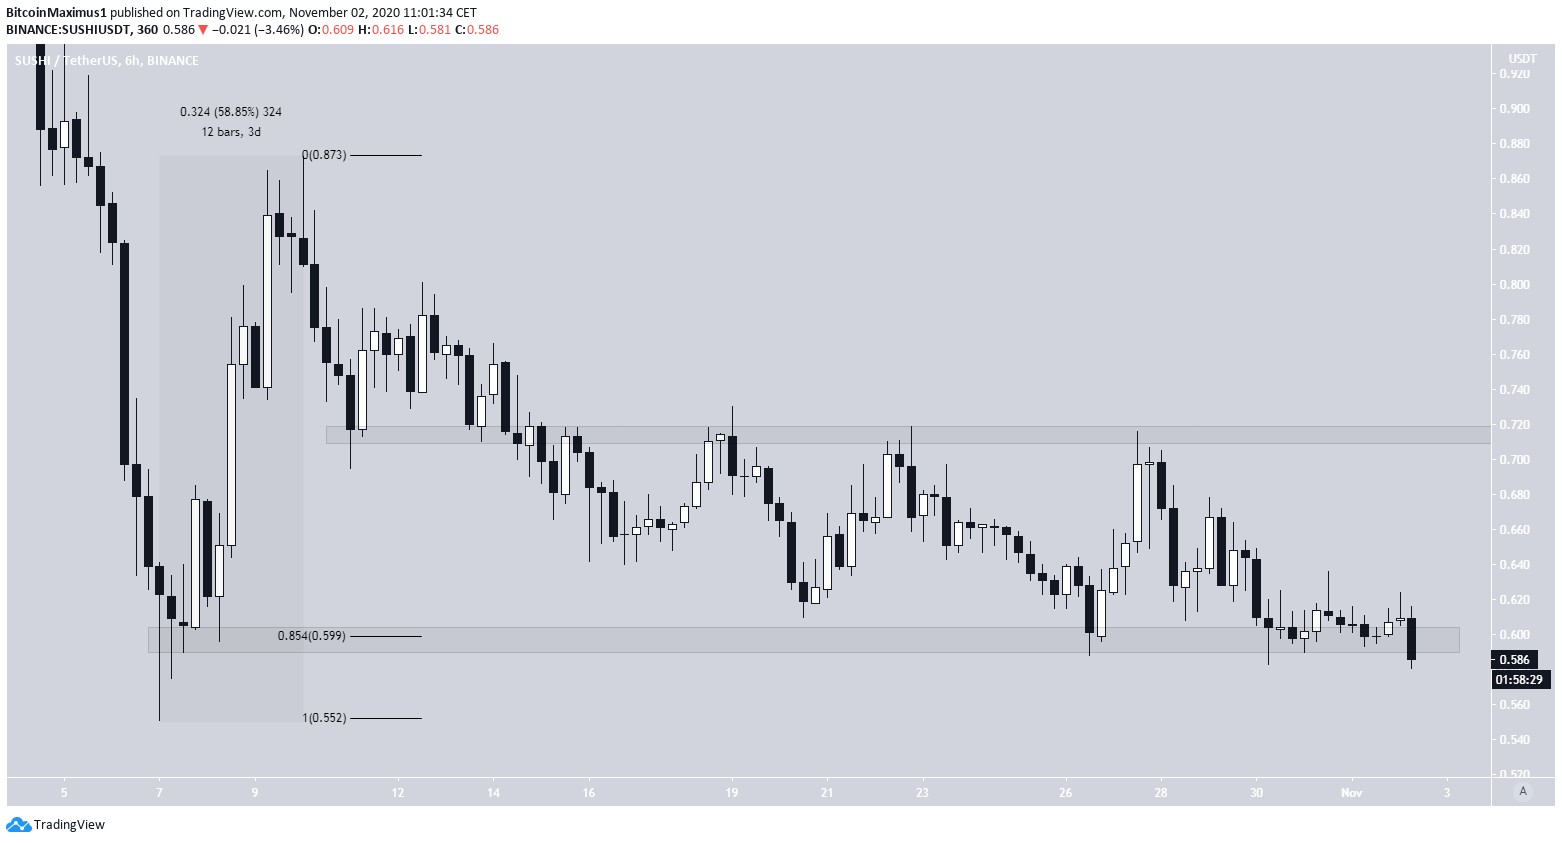
Sushi (SUSHI) seemingly began an upward move on Oct 7 but failed to sustain the increase and has lost almost all of its gains since.
On Oct 7, the SUSHI price reached a low of $0.551. An upward move began the next day and SUSHI increased by 57% in three days, reaching a local high of $0.873 on Oct 10.
Sushi Retraces To Support
At the time of writing, SUSHI had dropped back to the $0.60 support area, which is the 0.85 Fib level of the entire upward movement. In addition, it is the final support level before the Oct 7 lows, a decrease back to which would mark a 100% retracement.
On the other hand, a bounce could take the price to the closest resistance level at $0.71.
Descending Channel
Cryptocurrency trader @Mesawine1 outlined a SUSHI chart, stating that the price could soon begin to increase and could possibly return to the $1.40 level.
The increase is expected to begin once the if SUSHI can break out from the current descending channel.
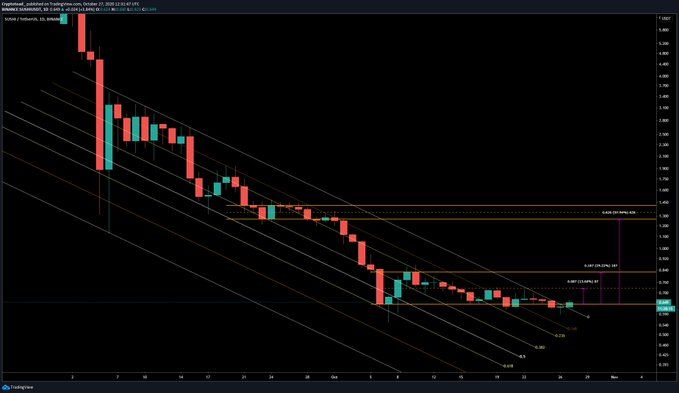
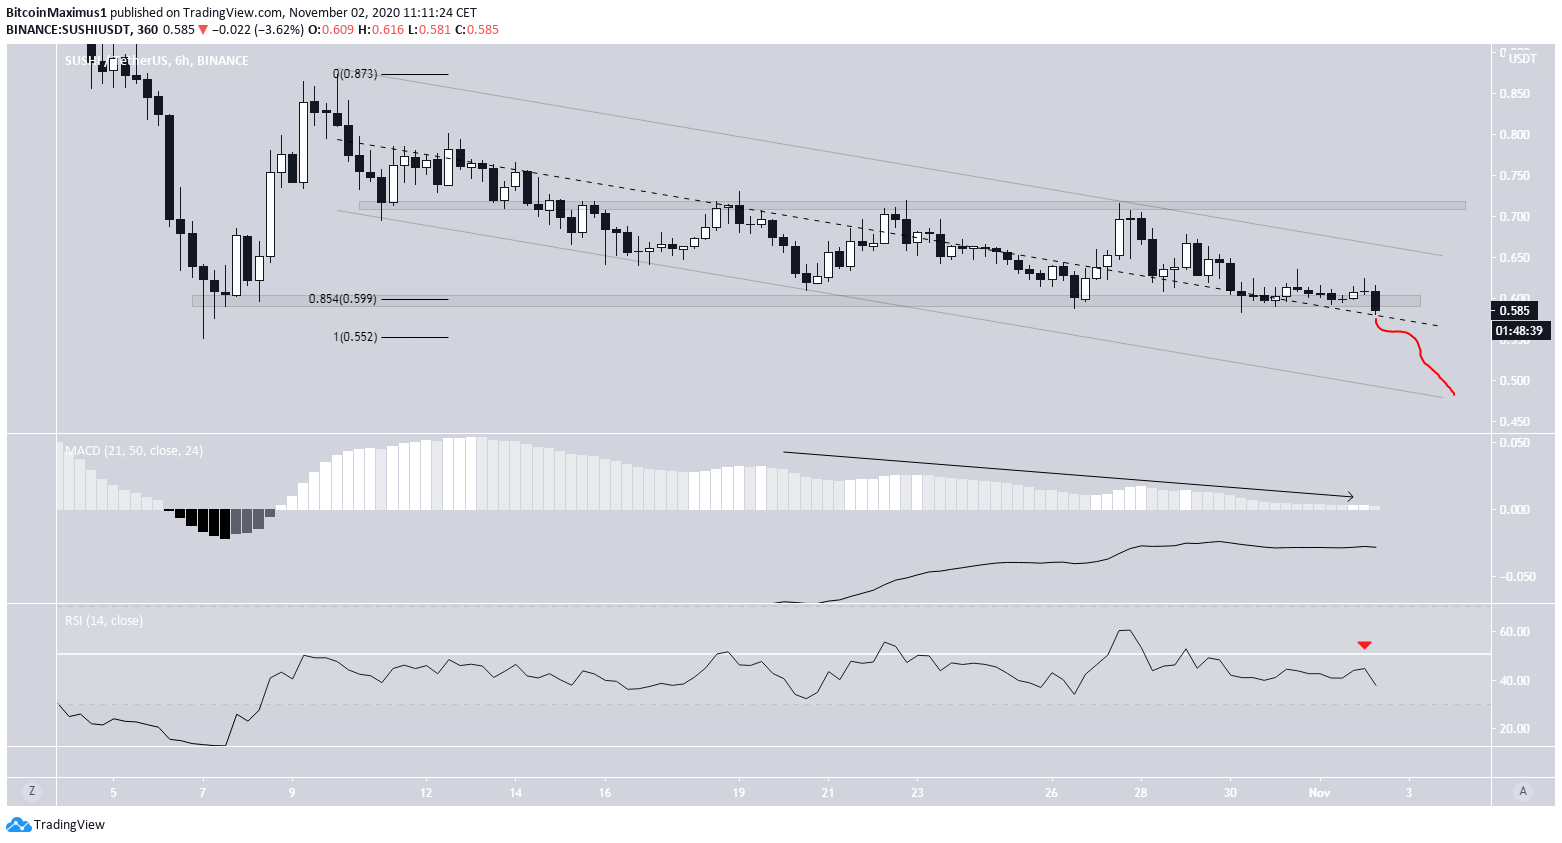
While the price is indeed trading inside a descending channel, there are no clear indications that it will break out.
On the contrary, both the MACD and RSI are indicating that the trend is bearish since the signal line of the former is below 0 and the latter is below 50. There are no bullish divergences in either.
The previously mentioned $0.60 support area coincides with the middle of the descending channel, so a breakdown could trigger a drop towards the support line of the channel near $0.50.
Conclusion
There are no signs that the SUSHI price will be able to stop the bleeding in the short term. On the contrary, a loss of the $0.55 area could take it into a new phase of bearish price discovery.
For BeInCrypto’s latest Bitcoin analysis, click here!
Disclaimer: Cryptocurrency trading carries a high level of risk and may not be suitable for all investors. The views expressed in this article do not reflect those of BeInCrypto.


