
SushiSwap (SUSHI) has been decreasing since reaching an all-time high on March 13.
However, it has broken out from a descending resistance line, potentially beginning a new upward movement.
SUSHI breaks out
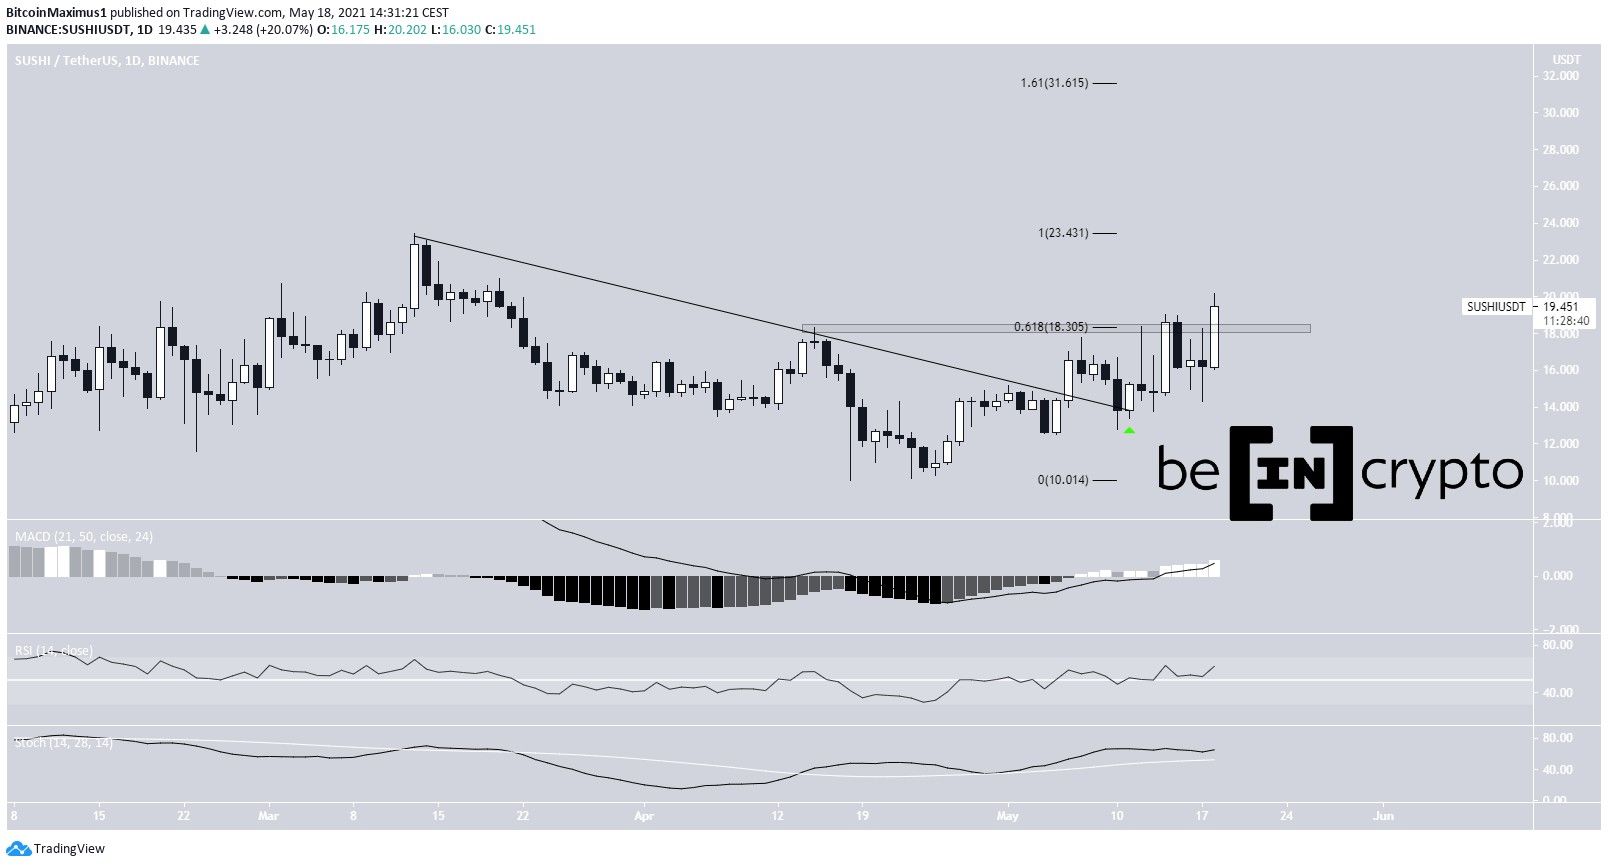
SUSHI has been following a descending resistance line since March 13, when it reached an all-time high price of $23.43. After three unsuccessful attempts, it was finally successful in moving above it, on May 6.
Initially, it struggled to move above the $18.30 resistance area, which is the 0.618 Fib retracement level of the most recent downward movement. However, it has finally broken out, and is in the process of reaching a daily close above it.
Technical indicators are bullish. The MACD is positive and increasing. The RSI has crossed above the 50 line, and the Stochastic oscillator has made a bullish cross.
The next resistance areas are found at $23.43 and $31.61, respectively. The latter is found using an external Fib retracement on the most recent drop.
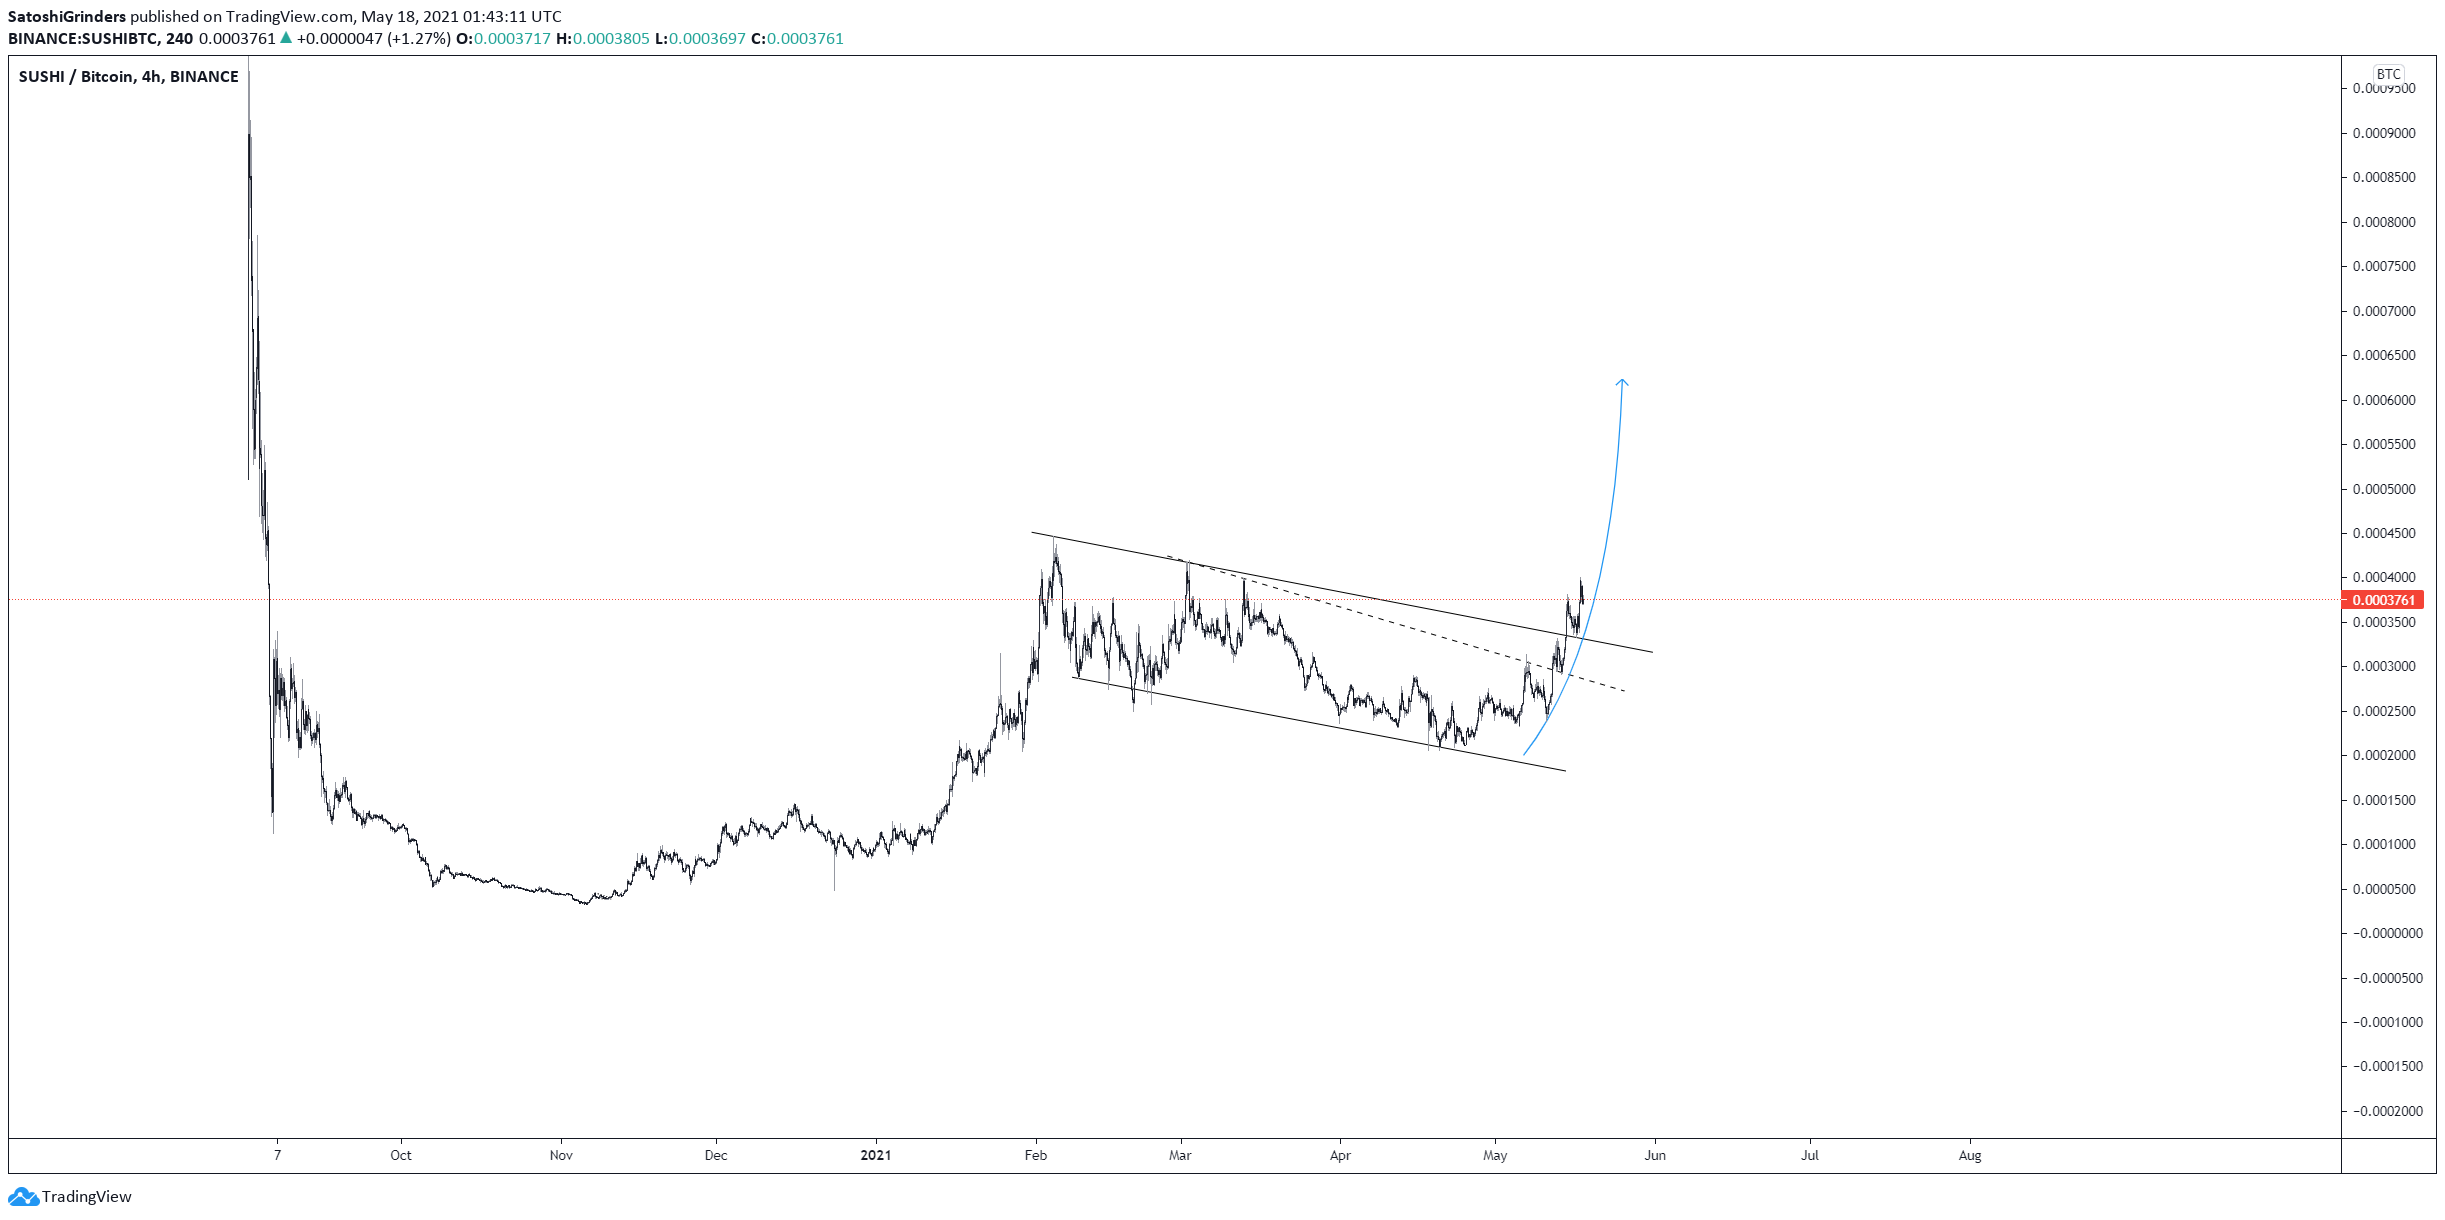
Cryptocurrency trader @Thebull_Crypto outlined a SUSHI chart, stating that the token is likely to go parabolic soon. This falls in line with the breakout from the descending resistance line and reclaim of horizontal area afterwards.
Short-term movement
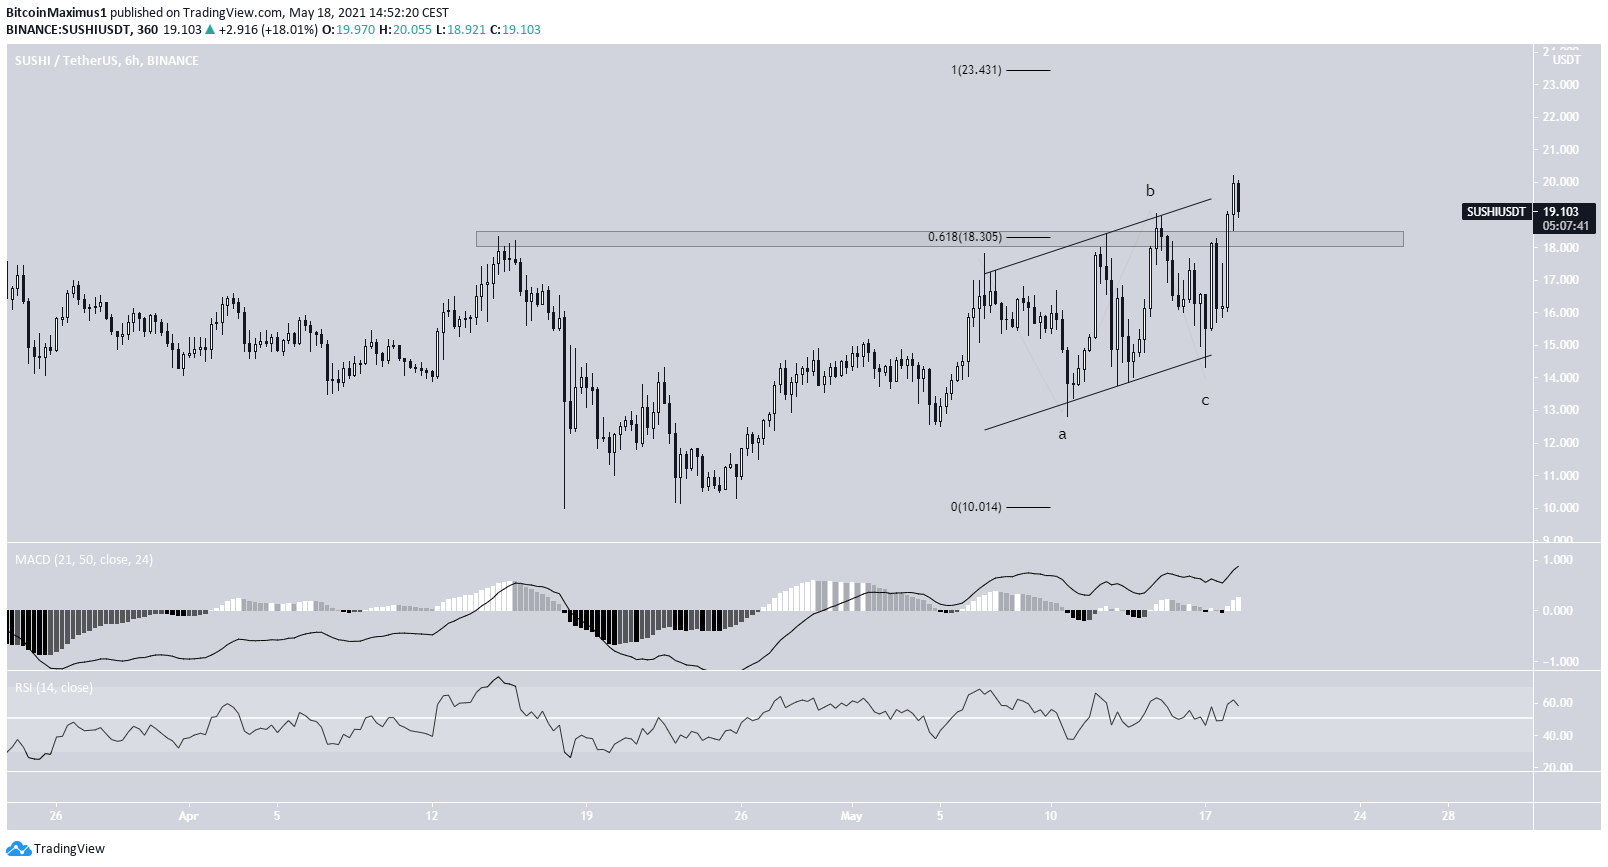
The shorter-term six-hour chart shows that the token is in the process of validating the previous resistance area at $18.30 as support.
Similar to the daily time-frame, both the MACD and RSI are increasing.
It is also possible that the token has just completed a running flat correction. This often leads to a significant movement in the other direction. It would be confirmed by a decisive movement above the resistance line of the channel.
SUSHI/BTC
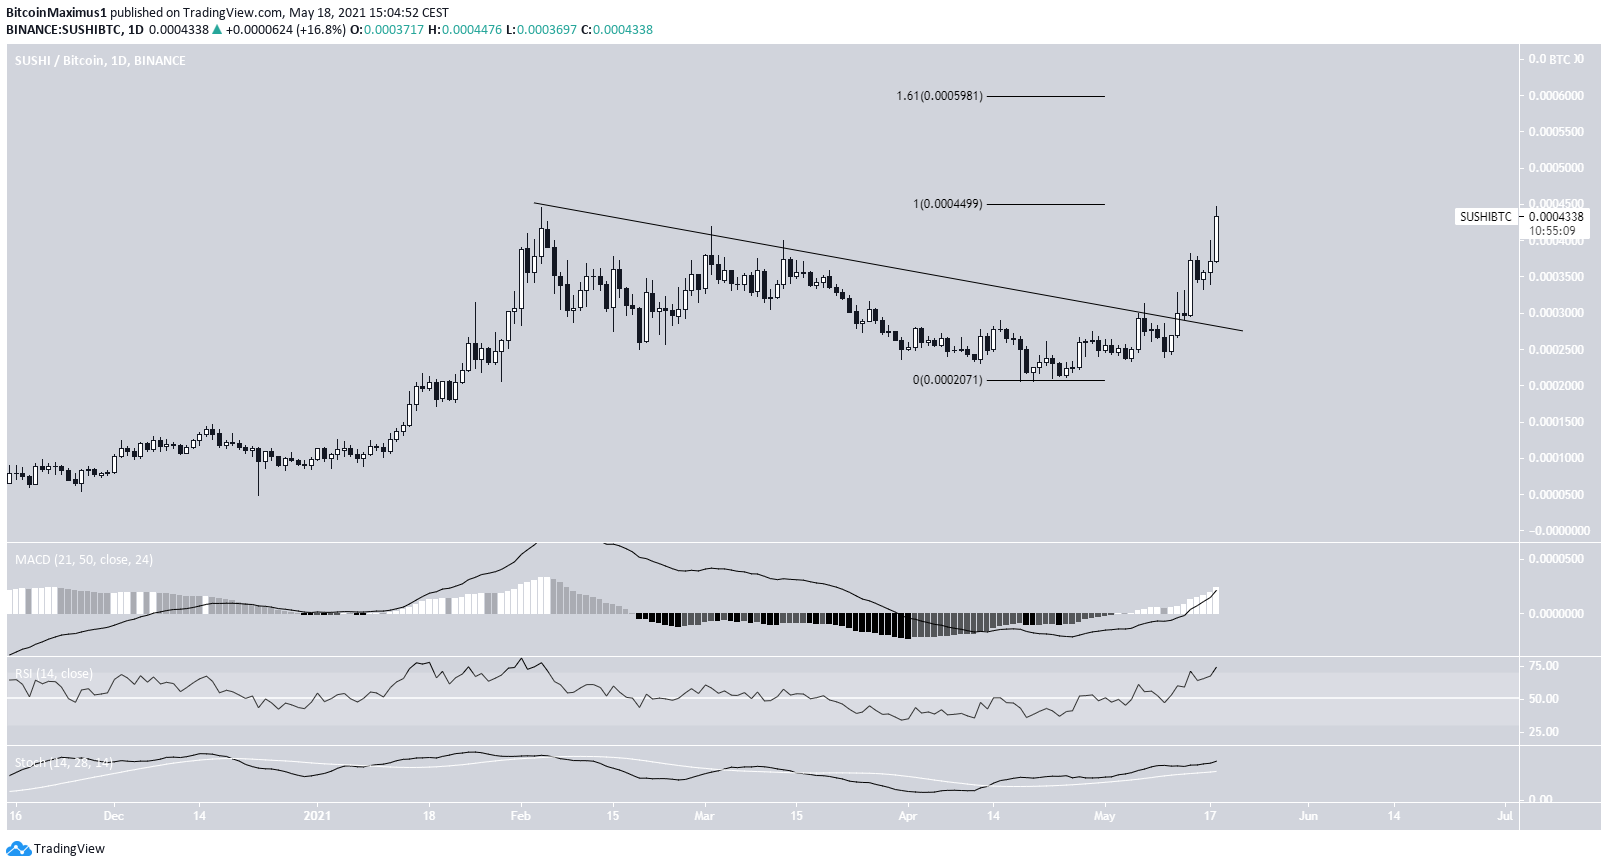
The chart for SUSHI/BTC looks similar. The token has broken out from a descending resistance line. In addition, technical indicators are bullish.
However, SUSHI is very close to moving above its February highs at 45,000 satoshis. If it is successful in doing so, it would likely increase all the way to the next resistance at 59,800 satoshis.
To conclude, SUSHI is expected to continue increasing towards the all-time high resistance area. A breakout is possible.
For BeInCrypto’s latest bitcoin (BTC) analysis, click here.
