


The Stratis (STRAT) price has fallen back into its previous long-term trading range after initially breaking out.
There are no clear signs that the price will break out or drop from this range, making consolidation the most likely scenario.
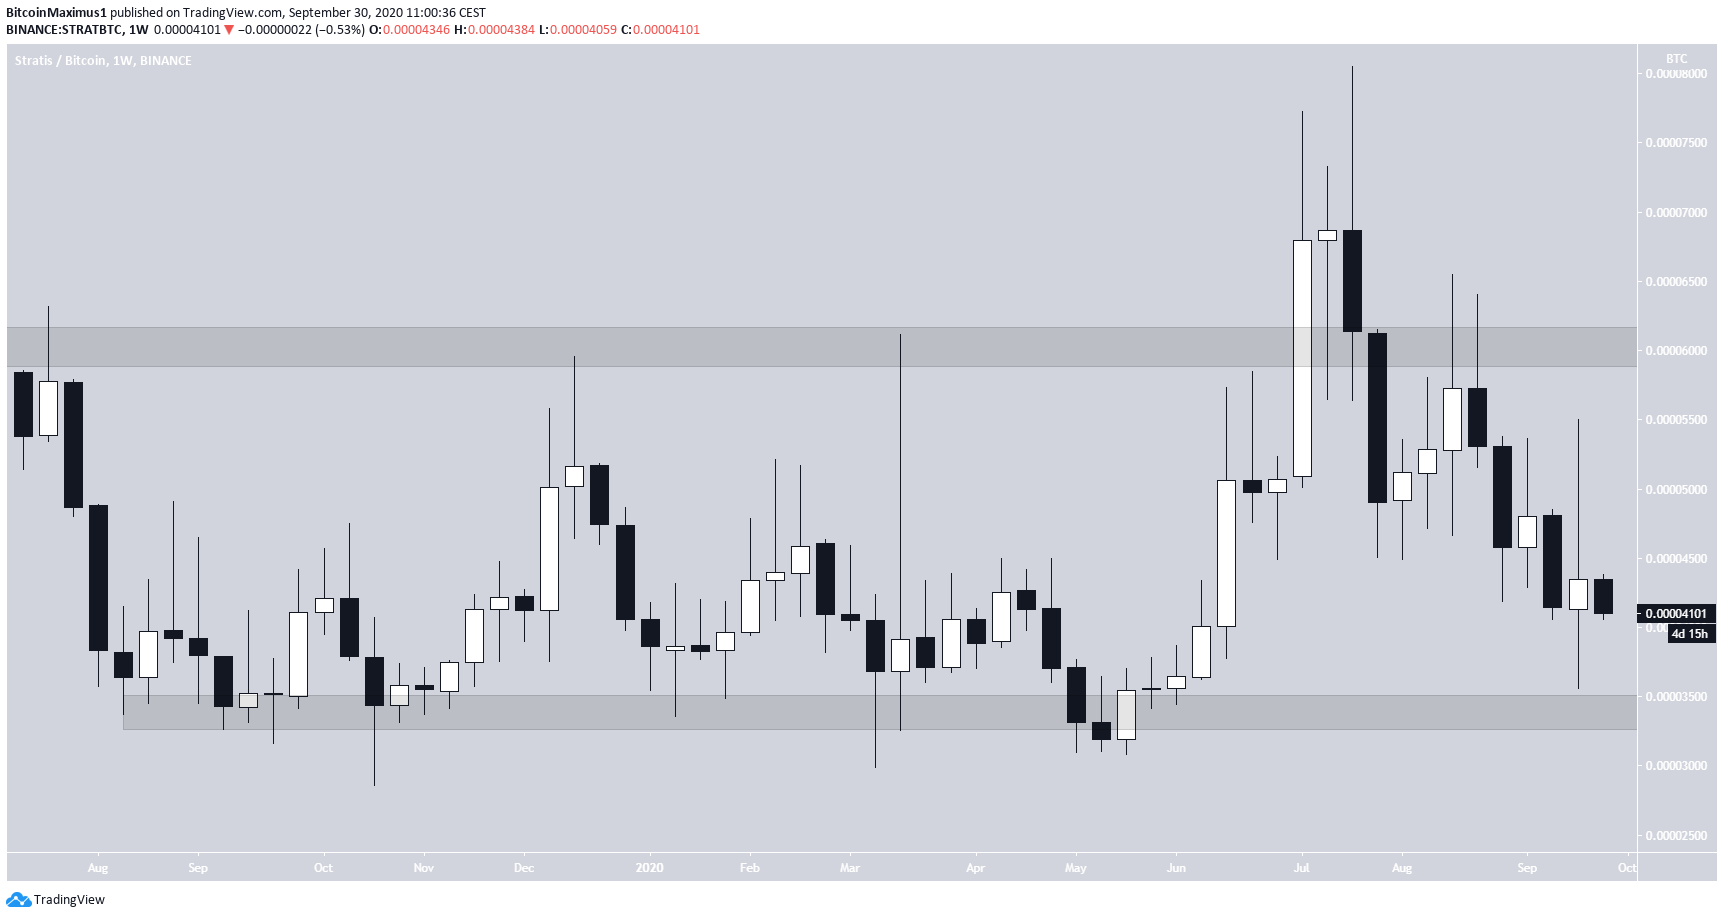
STRAT Trading Range
The STRAT price has been trading in a range between 3,400 and 6,000 satoshis since the beginning of August 2019. It looked as though STRAT broke out above the resistance area at the beginning of July when it reached a high of 8,050 satoshis, but has broken down below it since.
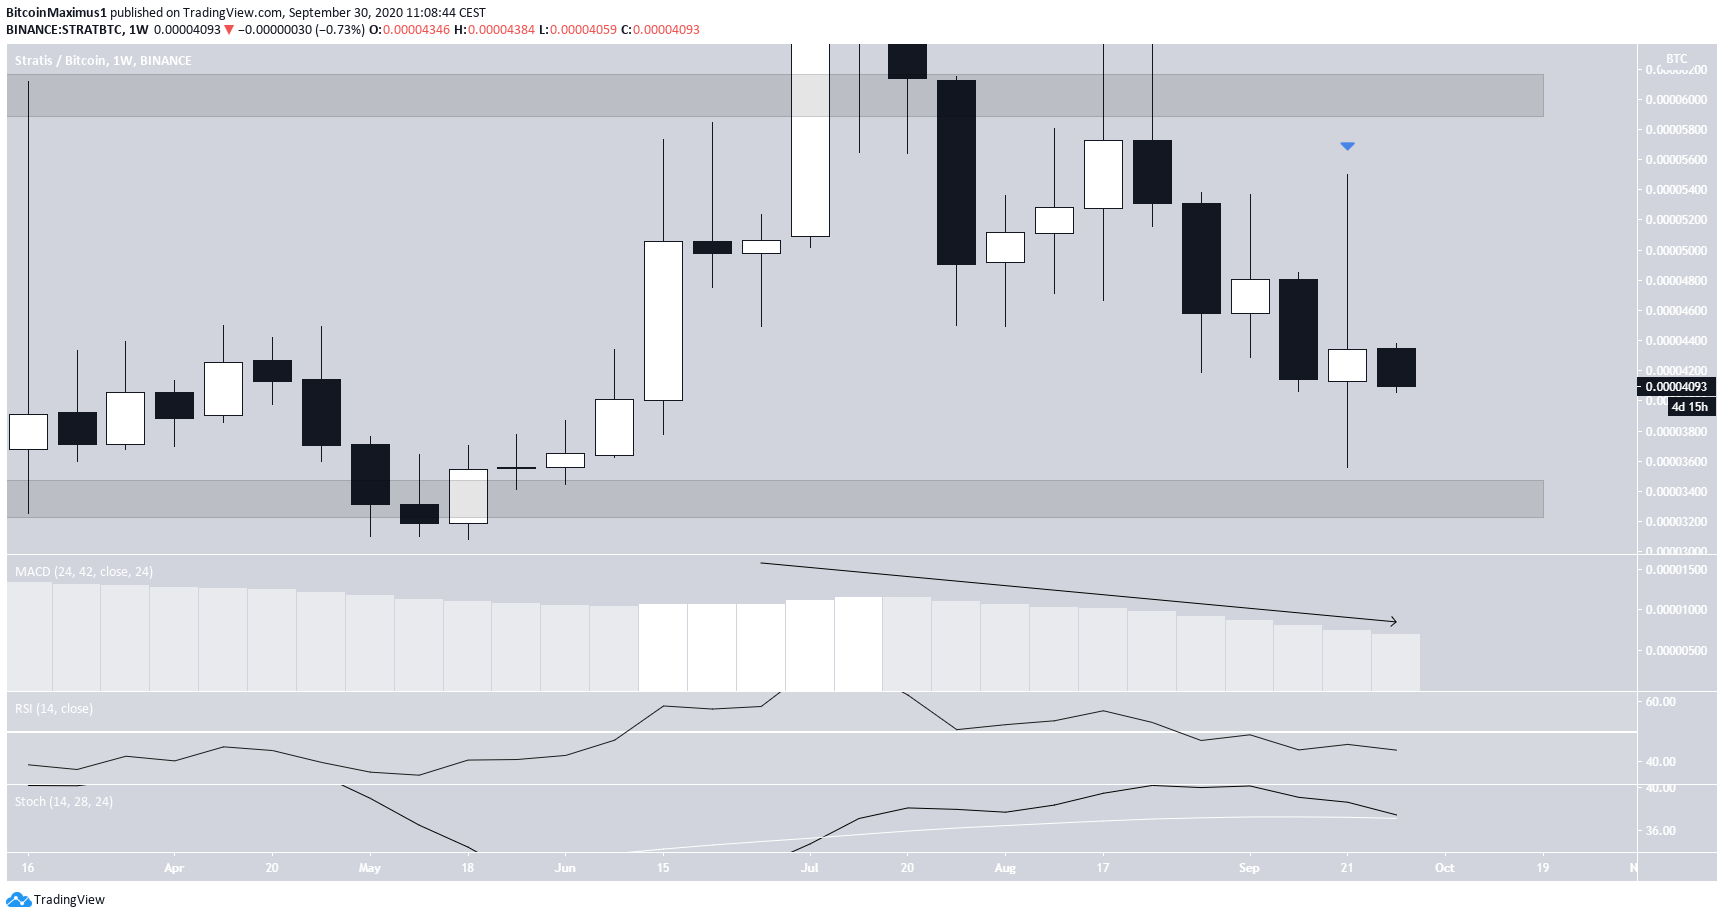
Technical indicators are bearish. The MACD, RSI, and Stochastic Oscillator are all decreasing, and the latter is currently very close to making a bearish cross.
Despite the bullish Doji candle from last week, the price has not yet shown clear signs of a reversal in the weekly time-frame. Doji candles are normally a sign of indecision but could also be seen as bullish since in this case, it came after a downward trend.
Possible Breakout
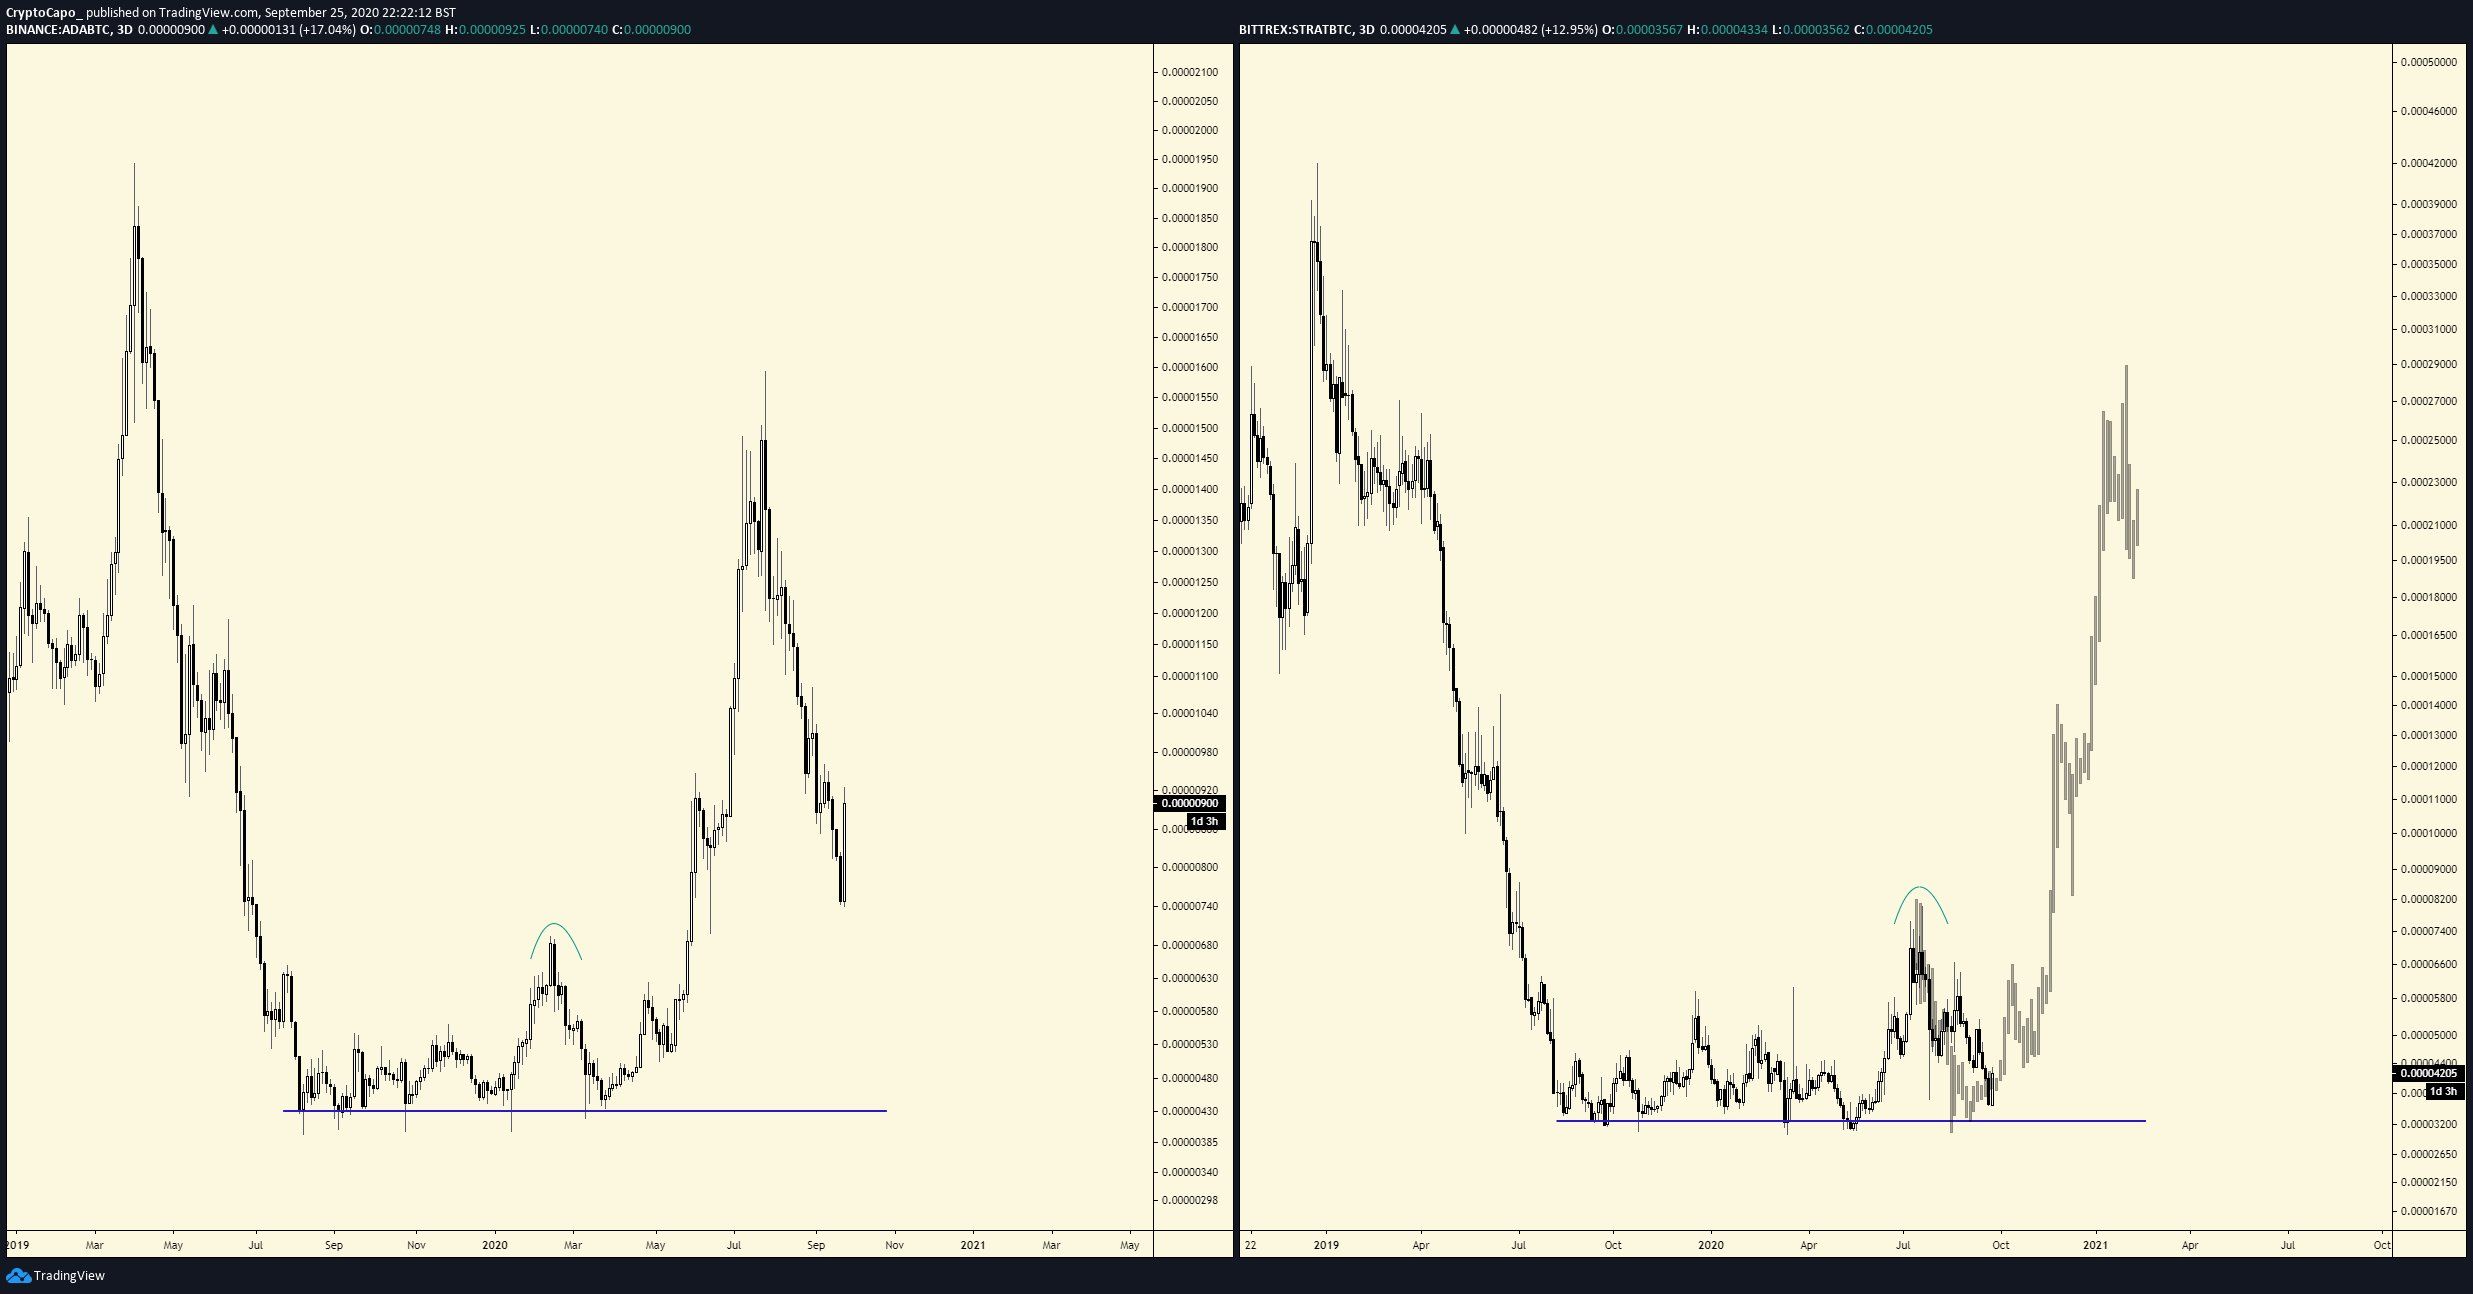
Cryptocurrency trader @CryptoCapo_ outlined a STRAT/ADA fractal, suggesting that the STRAT price could behave similarly to that of ADA, projecting a high of 29,000 satoshis.
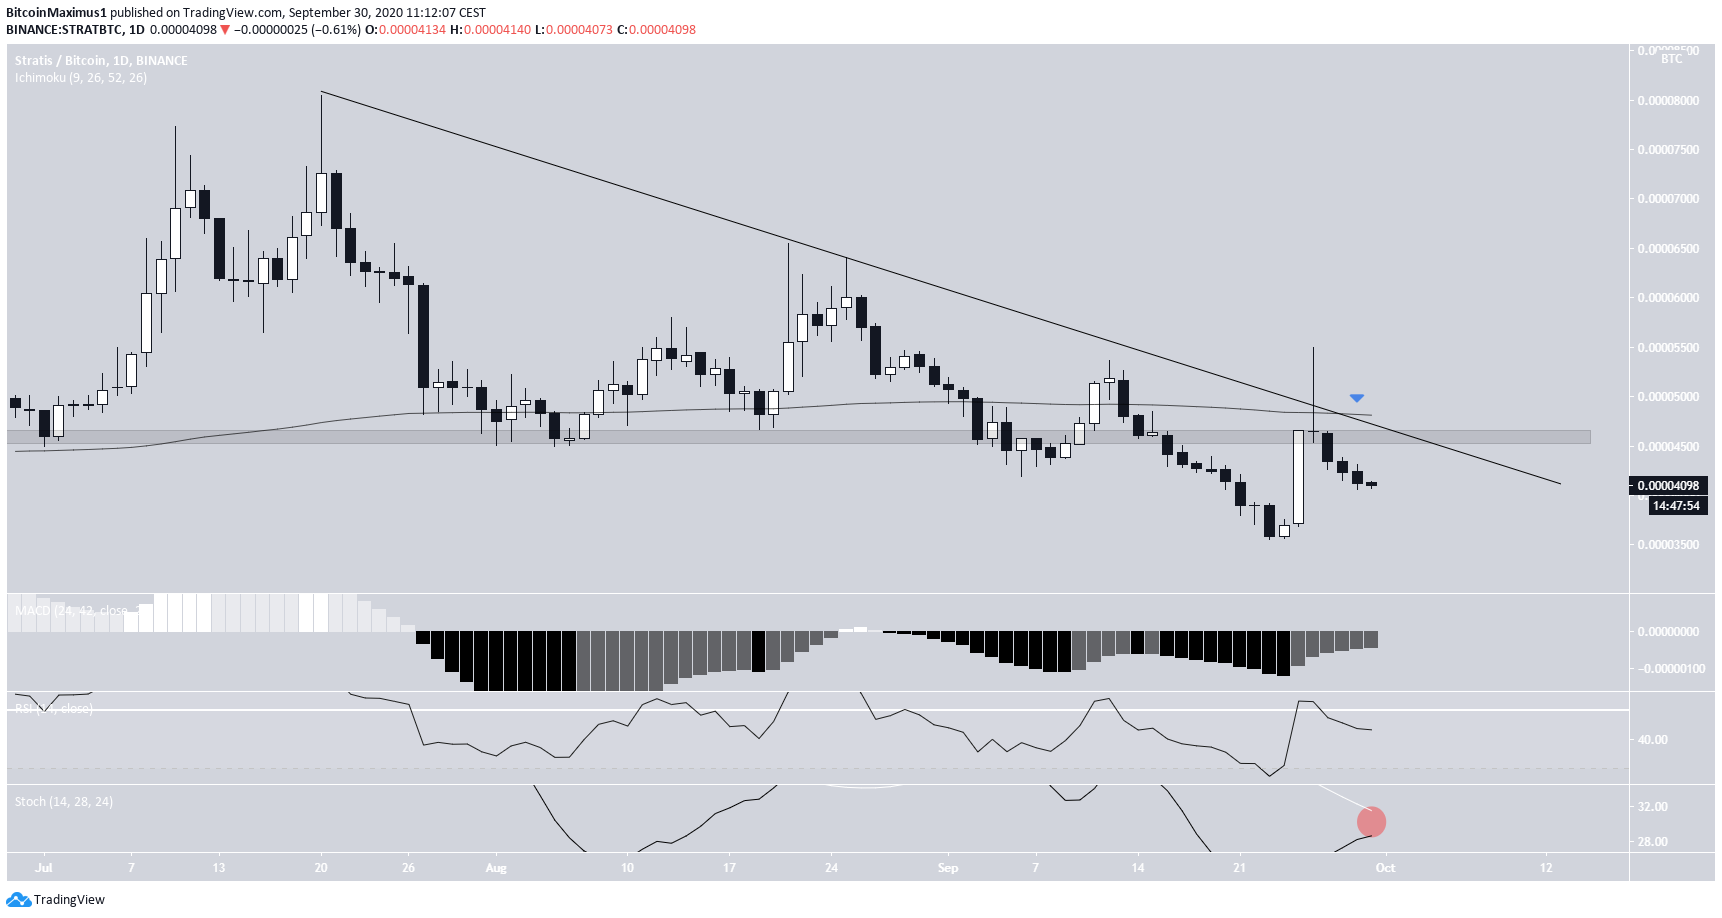
The daily time-frame shows that the price is currently facing a confluence of resistance levels created by:
- A descending resistance line in place since July 20
- The 4,600 minor resistance area
- The 200-day MA
Similar to the weekly time-frame, technical indicators are undecided. While the MACD is increasing, the RSI is falling and the Stochastic Oscillator has not yet made a bullish cross.
Since there are no definite signs of movement in either direction, consolidation inside the long-term range remains the most likely option, while an increase similar to that of ADA seems unlikely.
To conclude, the STRAT price is expected to continue trading inside its long-term range between 3,400-6,000 satoshis.
For BeInCrypto’s Bitcoin analysis, click here!


