
Stellar (XLM) price action remains uncertain after its blistering 89% monthly rally. While broader market optimism holds, XLM has slipped nearly 7% over the past week and is now trading around $0.45.
The correction might not be over, but some early technical signals suggest a reversal setup could be forming beneath the surface.
Bullish Pressure Slowly Returns as Bears Lose Edge
One of the first signs of a shift comes from the Bull-Bear Power (BBP) indicator, a tool that captures the ongoing tug-of-war between buying and selling momentum.
After a couple of days of bearish strength, BBP has just crossed into positive territory. While the bulls haven’t taken over convincingly, this flip shows that downside momentum may be weakening. Sellers no longer have full command, and the slow reappearance of buyer dominance could be the first stage of a price action reversal.
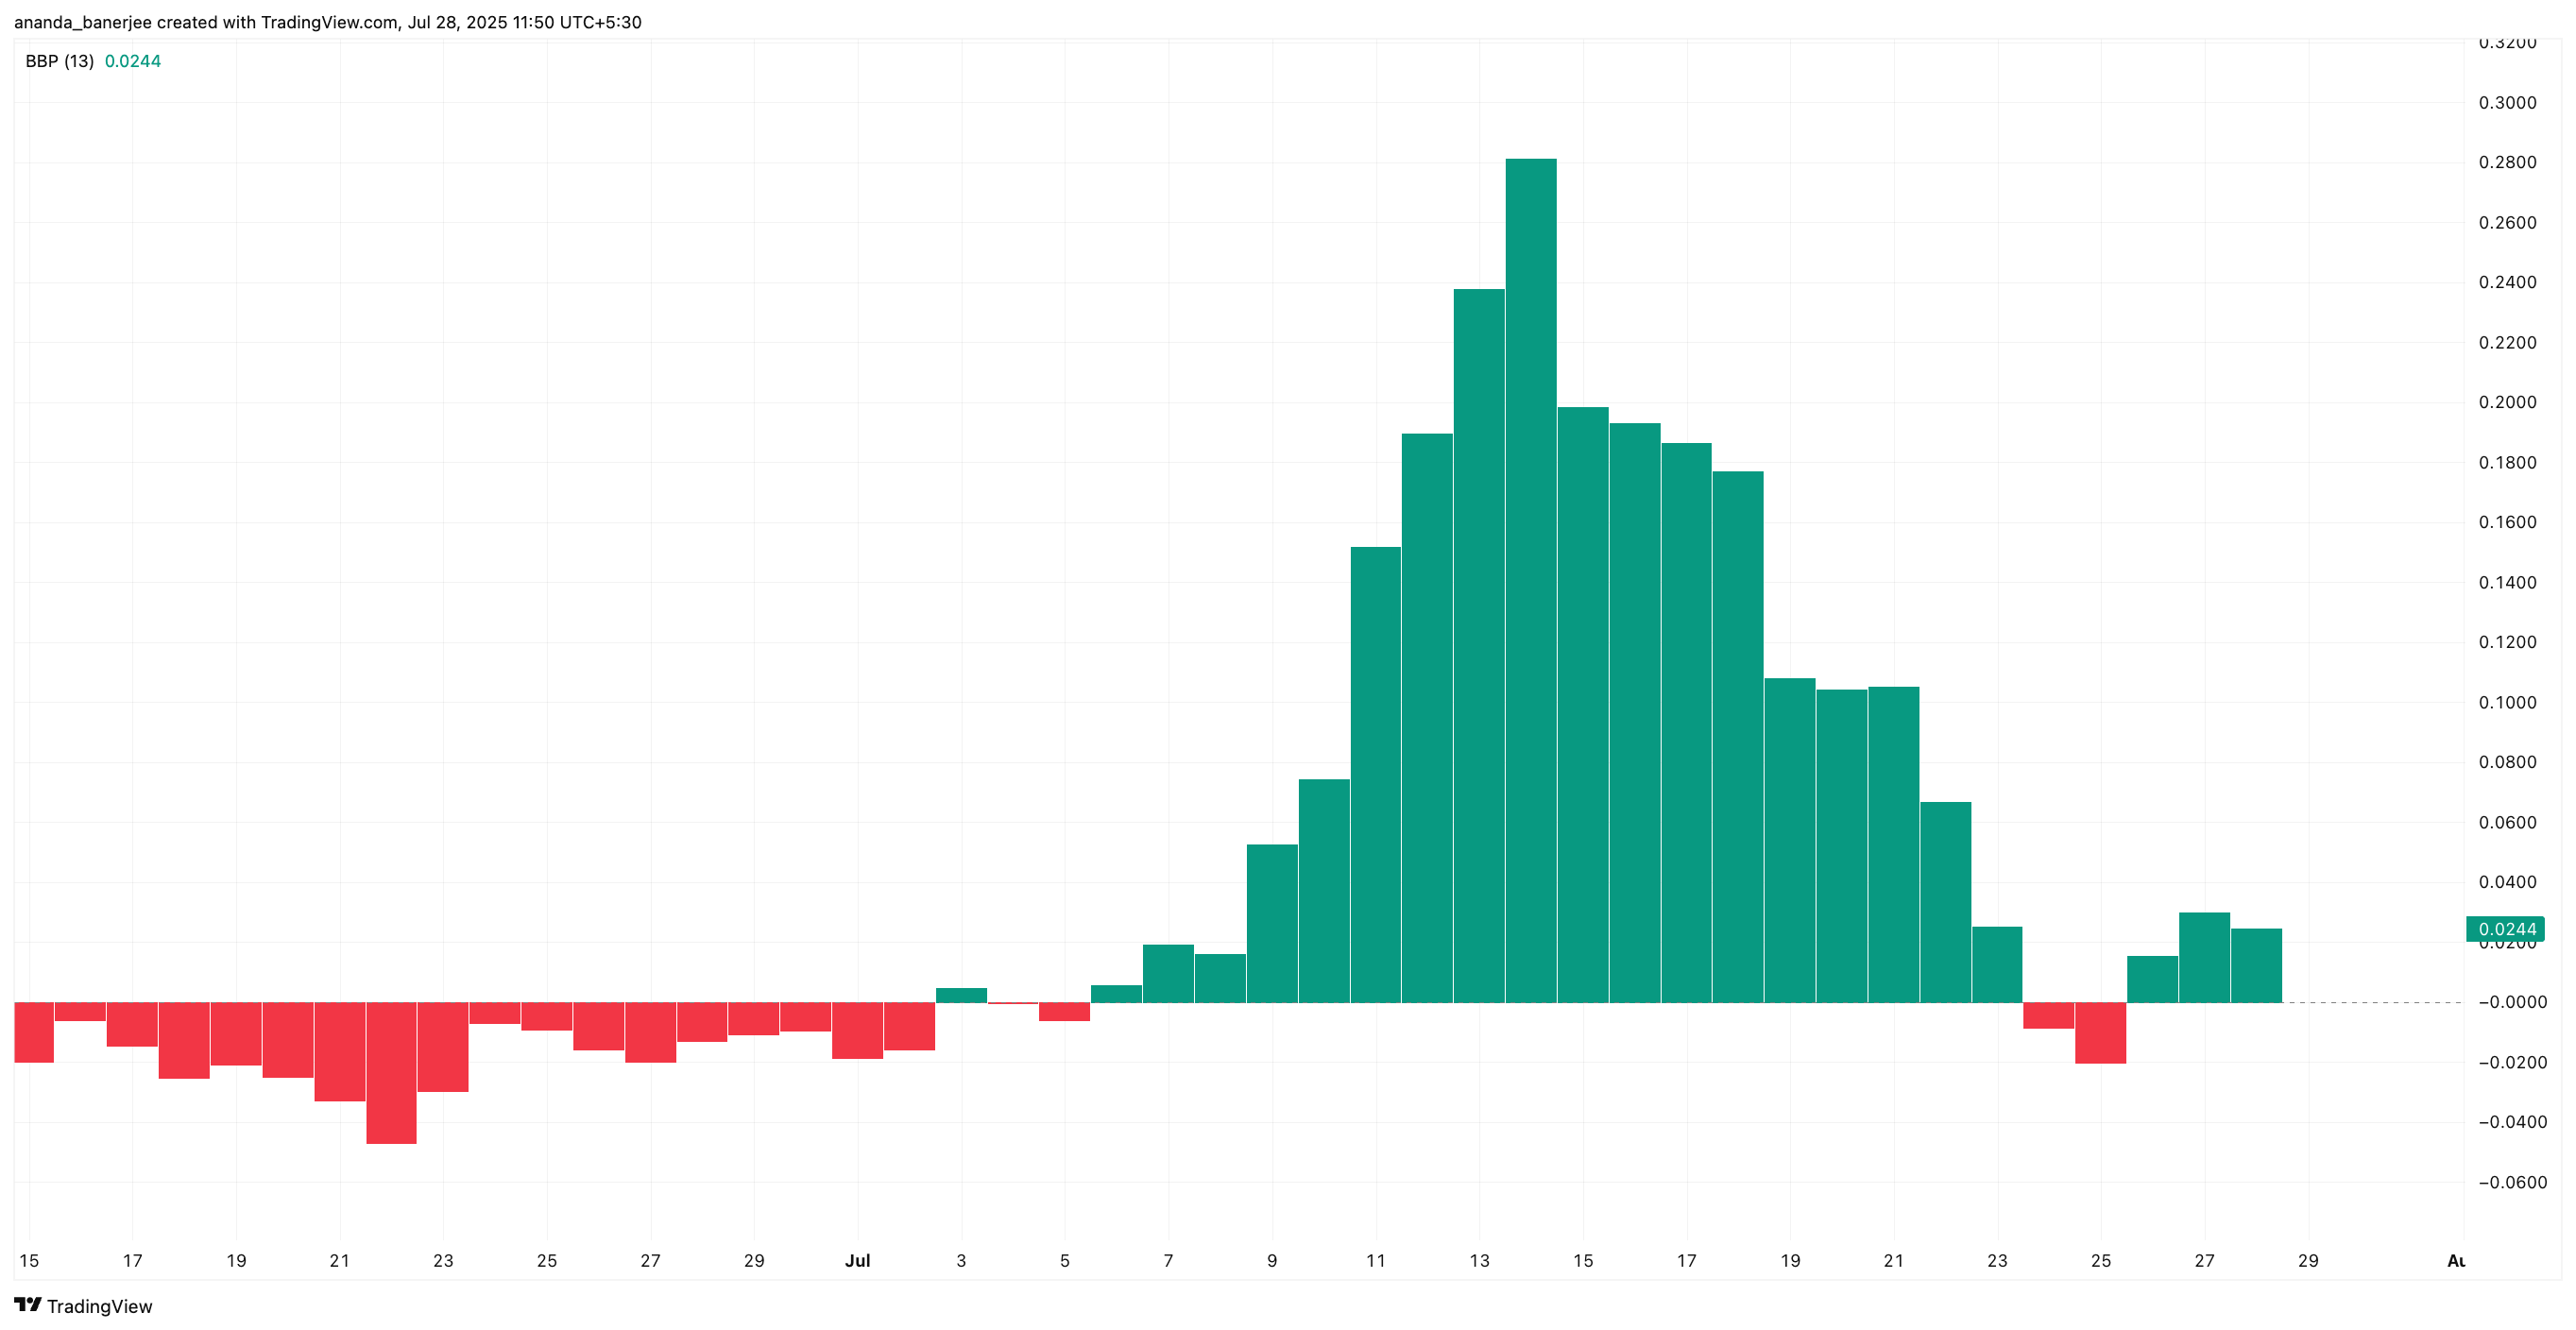
The BBP indicator, which measures the difference between price highs and EMA values, helps highlight these momentum inflection points. A bullish shift here doesn’t confirm an XLM price rally, but it flags a possible change in short-term structure, especially when paired with other metrics.
For token TA and market updates: Want more token insights like this? Sign up for Editor Harsh Notariya’s Daily Crypto Newsletter here.
4H Chart Hints at Incoming EMA Crossover
Short-term trends often surface first on lower timeframes, and Stellar (XLM)’s 4-hour chart shows a potentially critical development. The 20-period Exponential Moving Average (EMA), the blue line, is inching closer to the 50-period EMA (orange line), teasing a bullish crossover that could attract fast-moving traders.
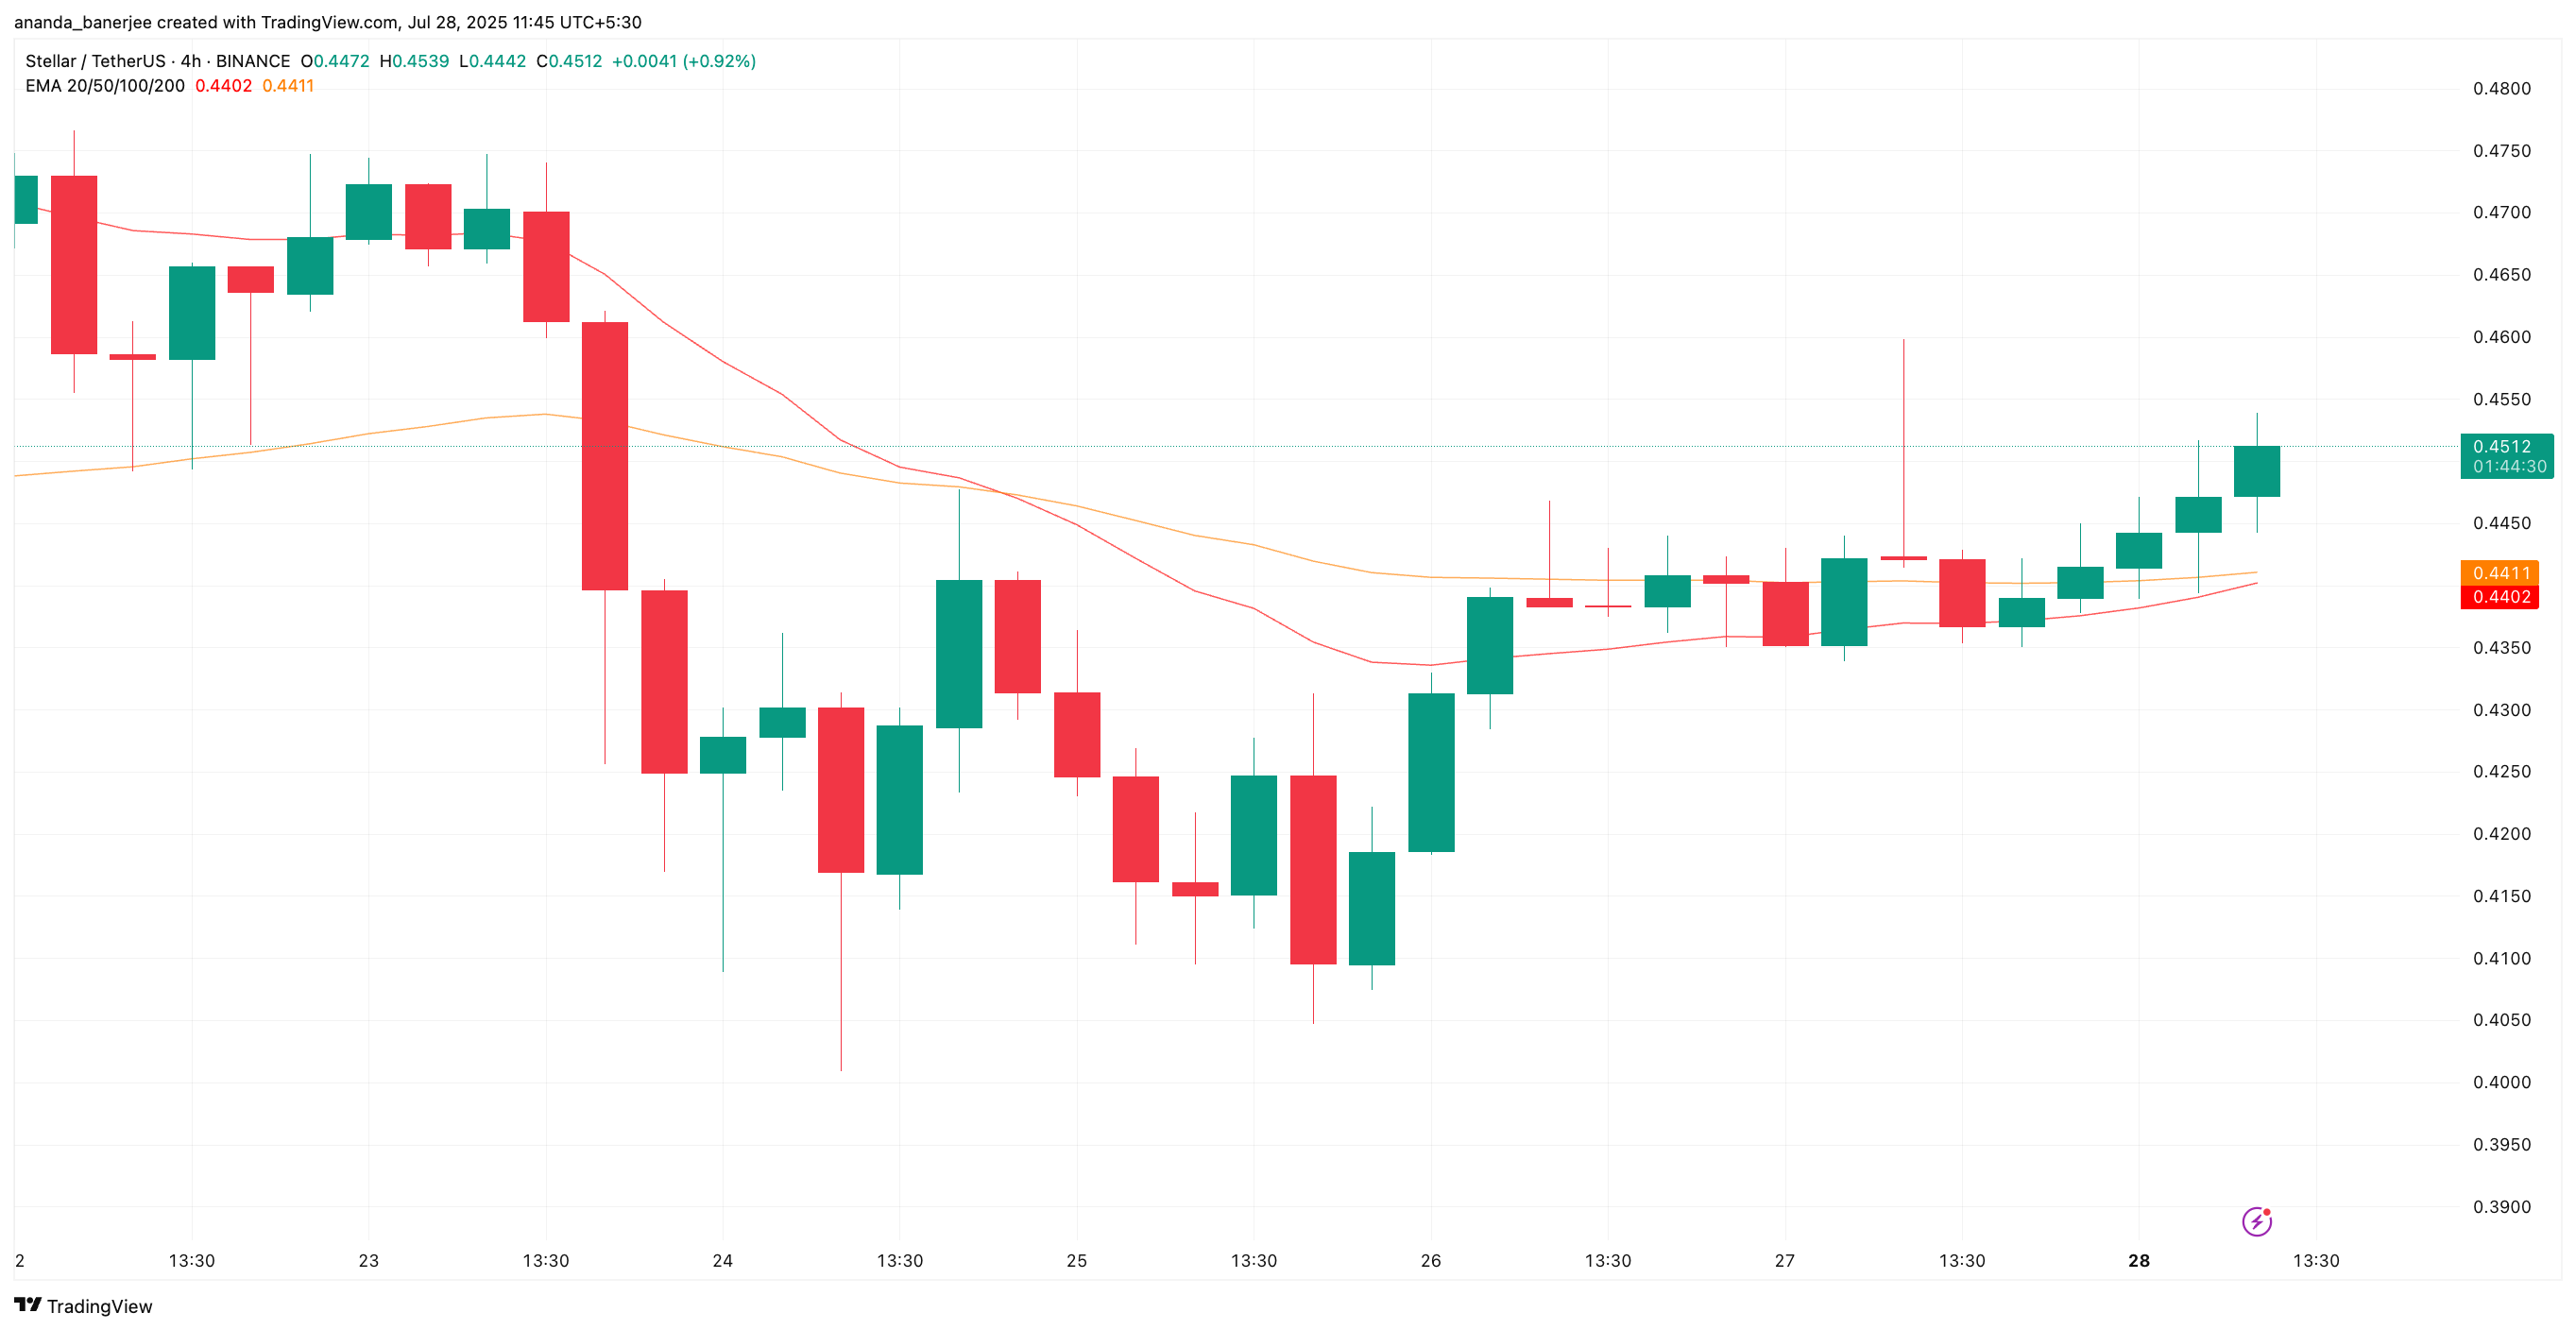
Such a crossover typically signals a shift in directional momentum, especially after an extended correction. With the 20-EMA currently around $0.44 and nudging against the 50-EMA, the next few candles could confirm the flip.
If that happens, Stellar (XLM) price could start charting a stronger recovery, at least toward immediate resistance levels. These levels are mentioned in the next section.
EMAs are lagging trend tools, but on lower timeframes, they often hint at larger directional changes, especially when combined with weakening bearish indicators like BBP.
Stellar (XLM) Price Faces Crucial Test at $0.46
Despite signs of reversal, the Stellar (XLM) price has yet to clear key technical levels. The $0.46 zone—corresponding to the 0.5 Fibonacci retracement from the $0.52 swing high to the recent $0.40 low—remains a stubborn ceiling.
A confirmed price breakout above this could trigger quick moves to $0.47 and $0.49, with $0.52 still looming as a major psychological and technical barrier for the XLM price.
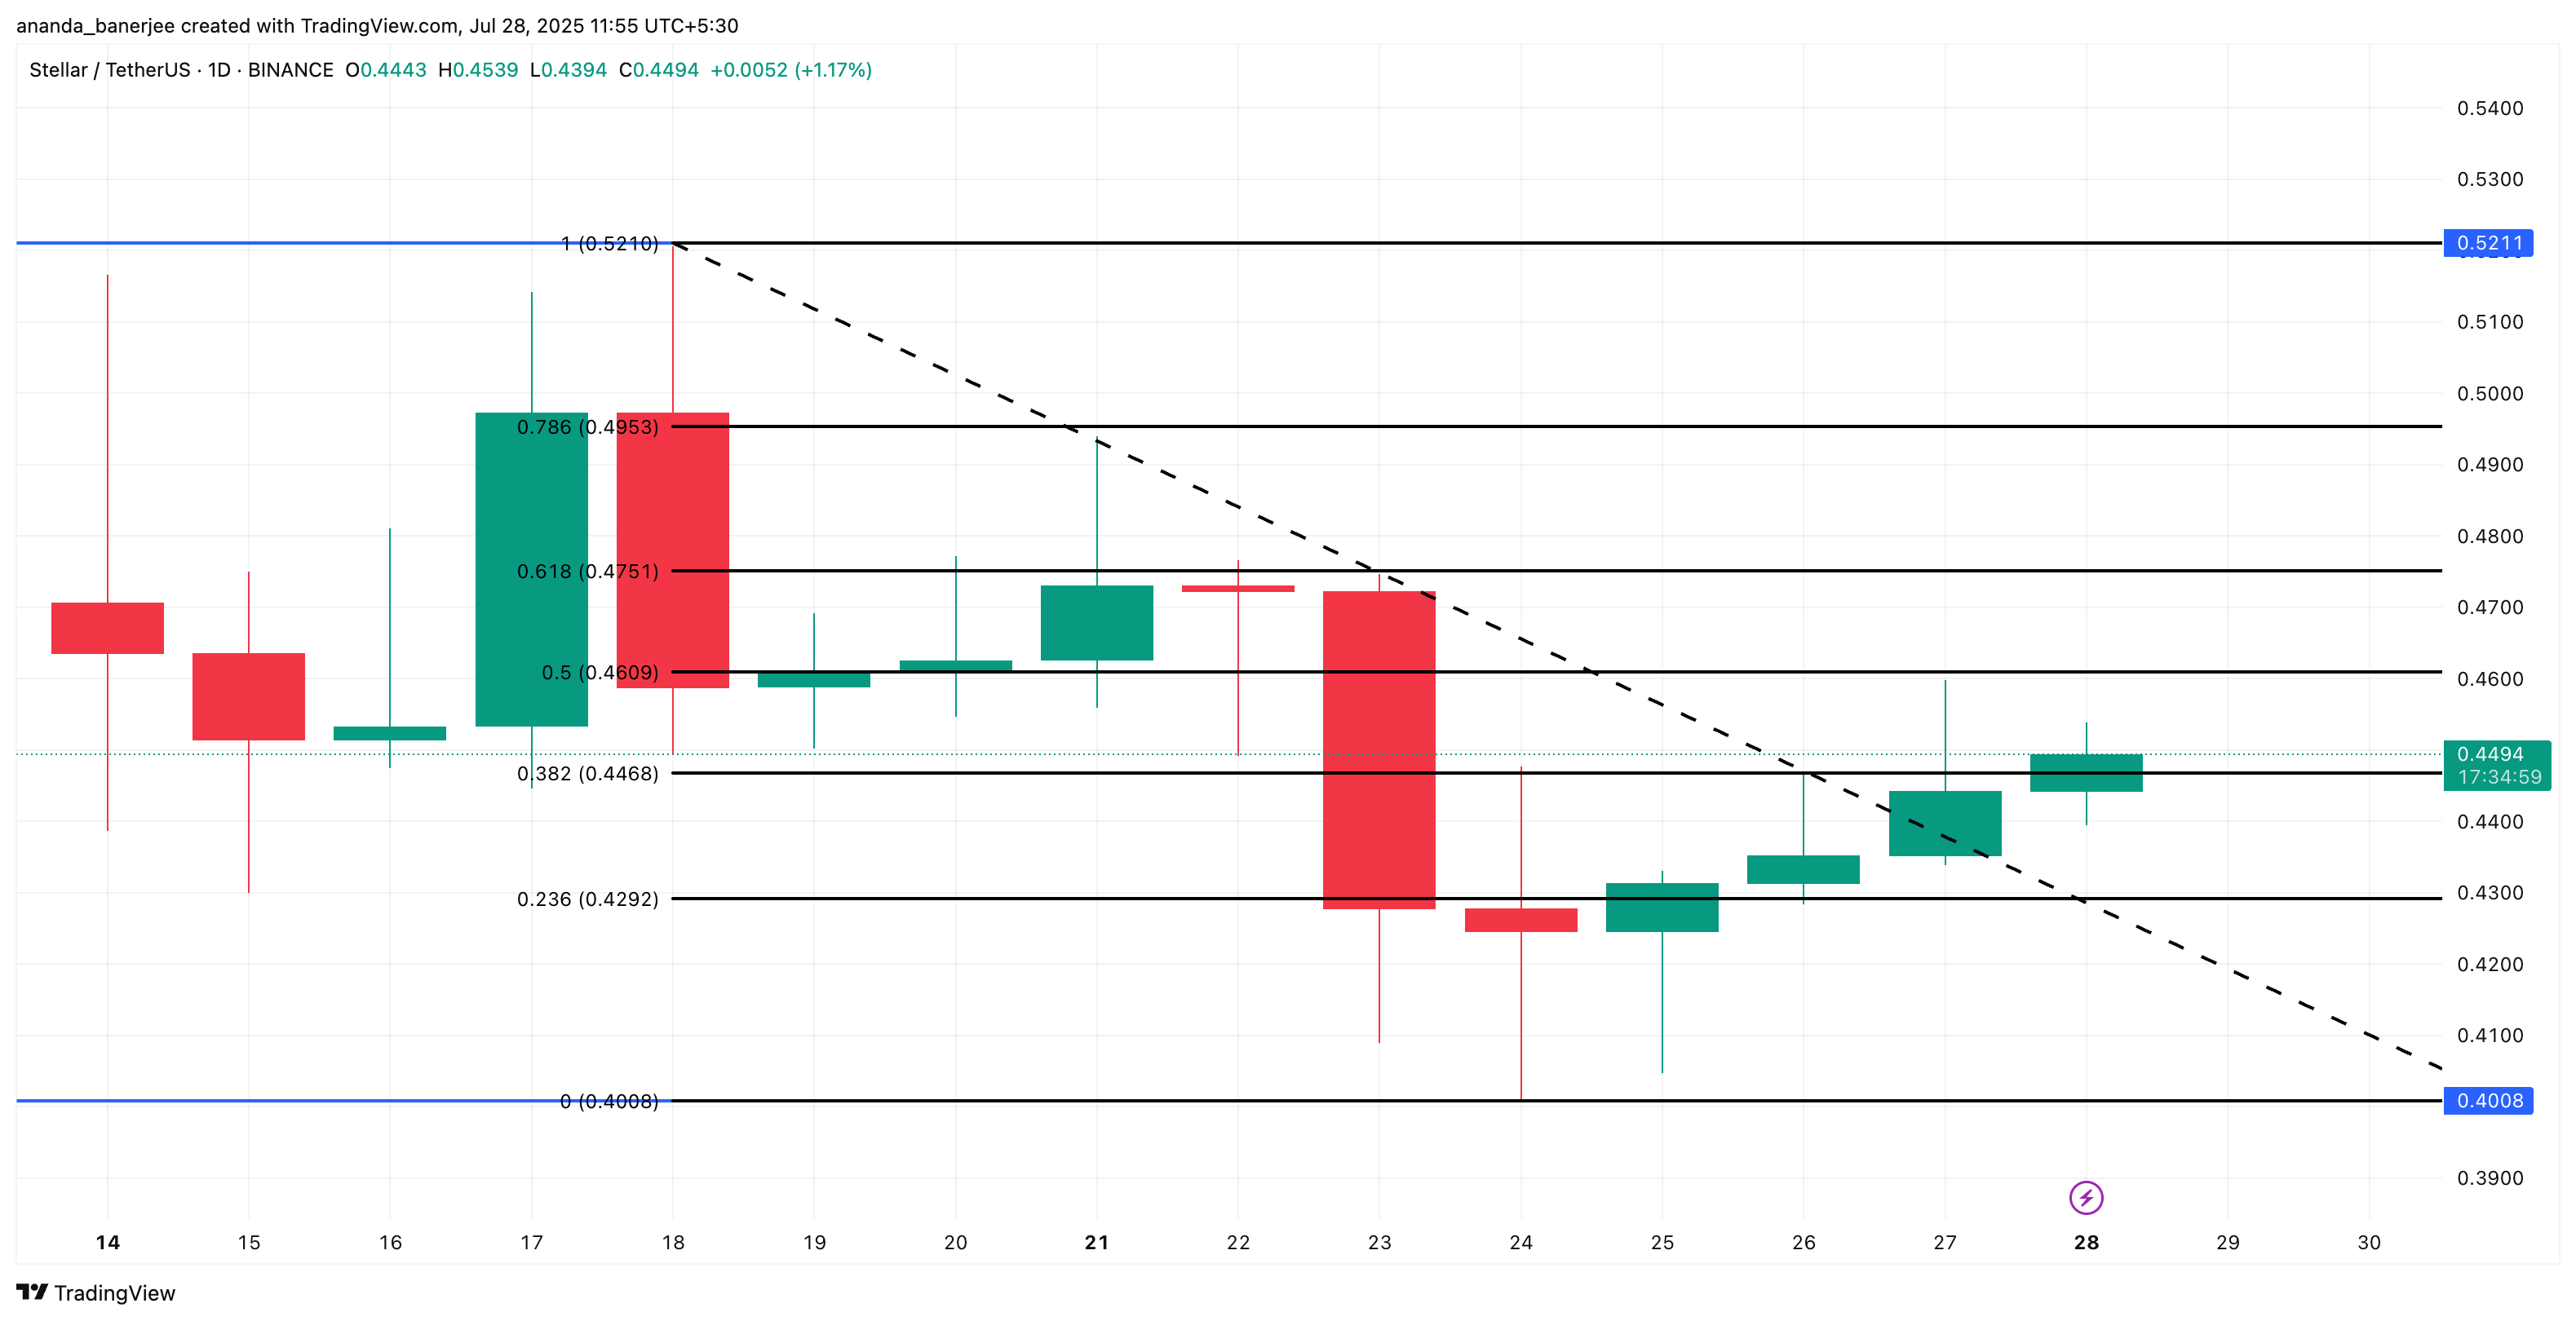
However, this reversal structure remains unconfirmed unless the XLM price holds above $0.46. A price drop below $0.42 would invalidate the short-term bullish thesis and could expose XLM to deeper pullbacks toward $0.40, rekindling broader XLM crash fears.
The Fibonacci retracement tool, used here to gauge recovery levels post-correction, helps mark the key zones that bulls must reclaim for a full XLM price reversal to take shape.
