
Stellar (XLM) price is creating a bullish pattern in the weekly time frame after the RSI generated bullish divergence. However, a short-term price retracement could occur prior to this long-term reversal.
XLM price has been falling since reaching a high of $0.798 in May 2021. The price created a lower high (red icon) in Nov. of the same year and started to fall underneath a descending resistance line afterward. This movement then led to a low of $0.099 in July 2022.
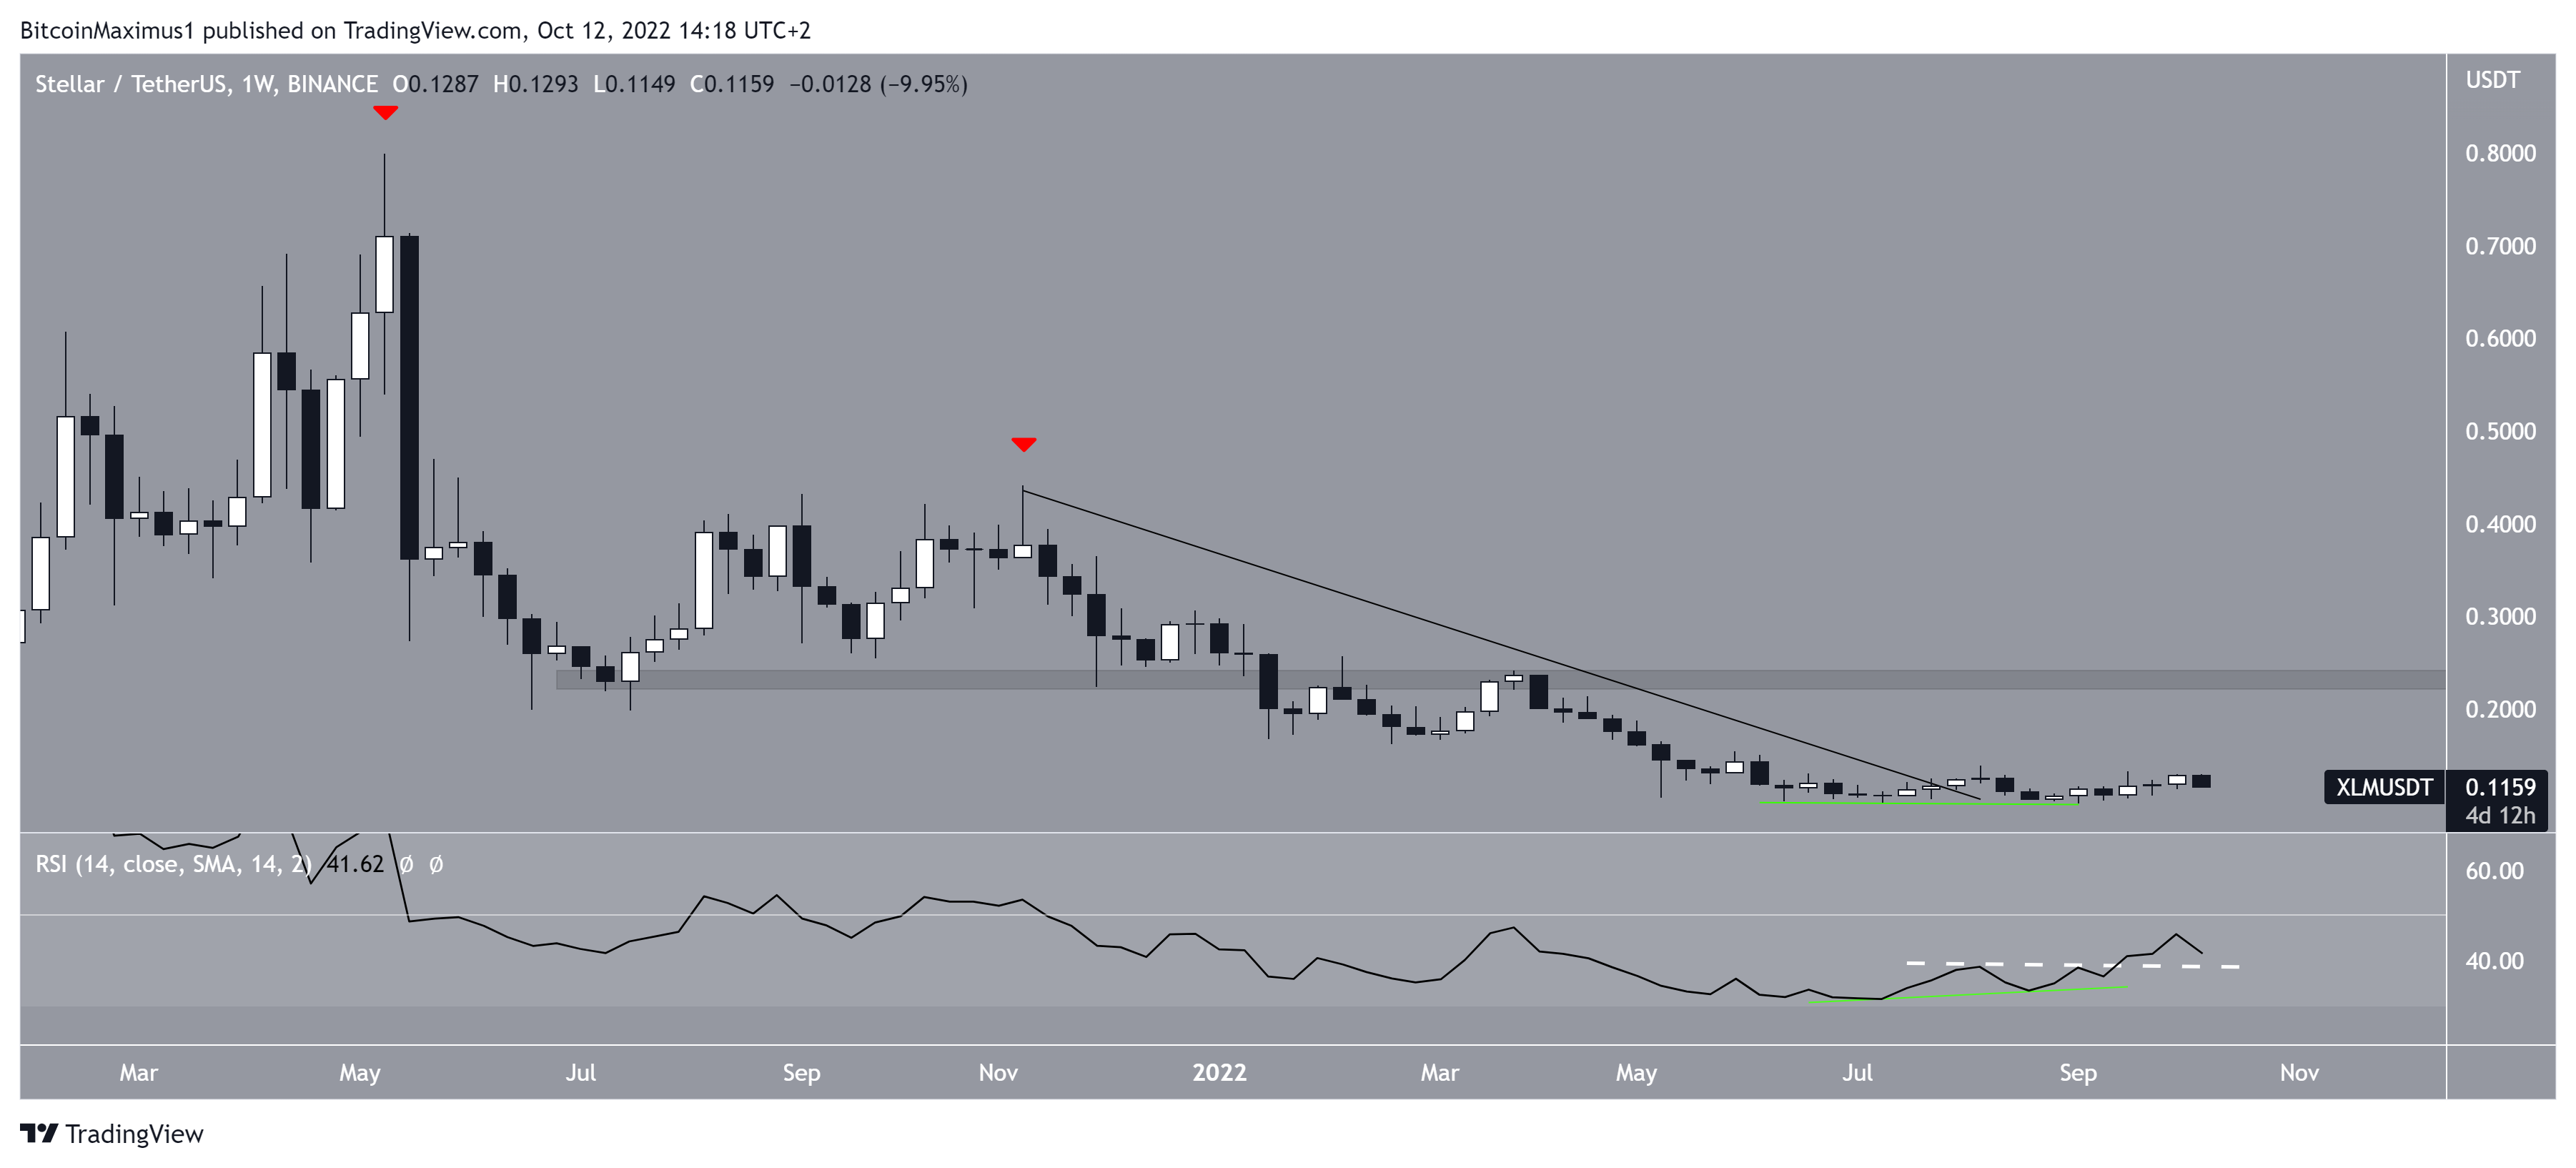
Stellar price then reversed trend and broke out from the descending resistance line. Additionally, while the price returned to pre breakout levels, the weekly RSI generated a considerable bullish divergence (green line).
Such divergences often precede significant upward movements, and one has yet to occur. If it does, the next closest resistance would be at $0.235.
Moreover, the weekly RSI has moved above the high between the divergences (white dashed line), further vindicating the possibility of a bullish reversal in price.
Therefore, an upward movement towards the XLM price target of $0.235 as a result of the bullish divergence seems to be the most likely scenario.
Additionally, it is worth noting that Meridian 2022, an annual event organized by the Stellar Foundation is will be held between Oct. 11 and 13.
The founder of Stellar Global, along with other notable people in the organization, will be in attendance.
XLM price fails to break out above resistance
Despite the bullish outlook from the weekly time frame, the daily price chart gives bearish readings.
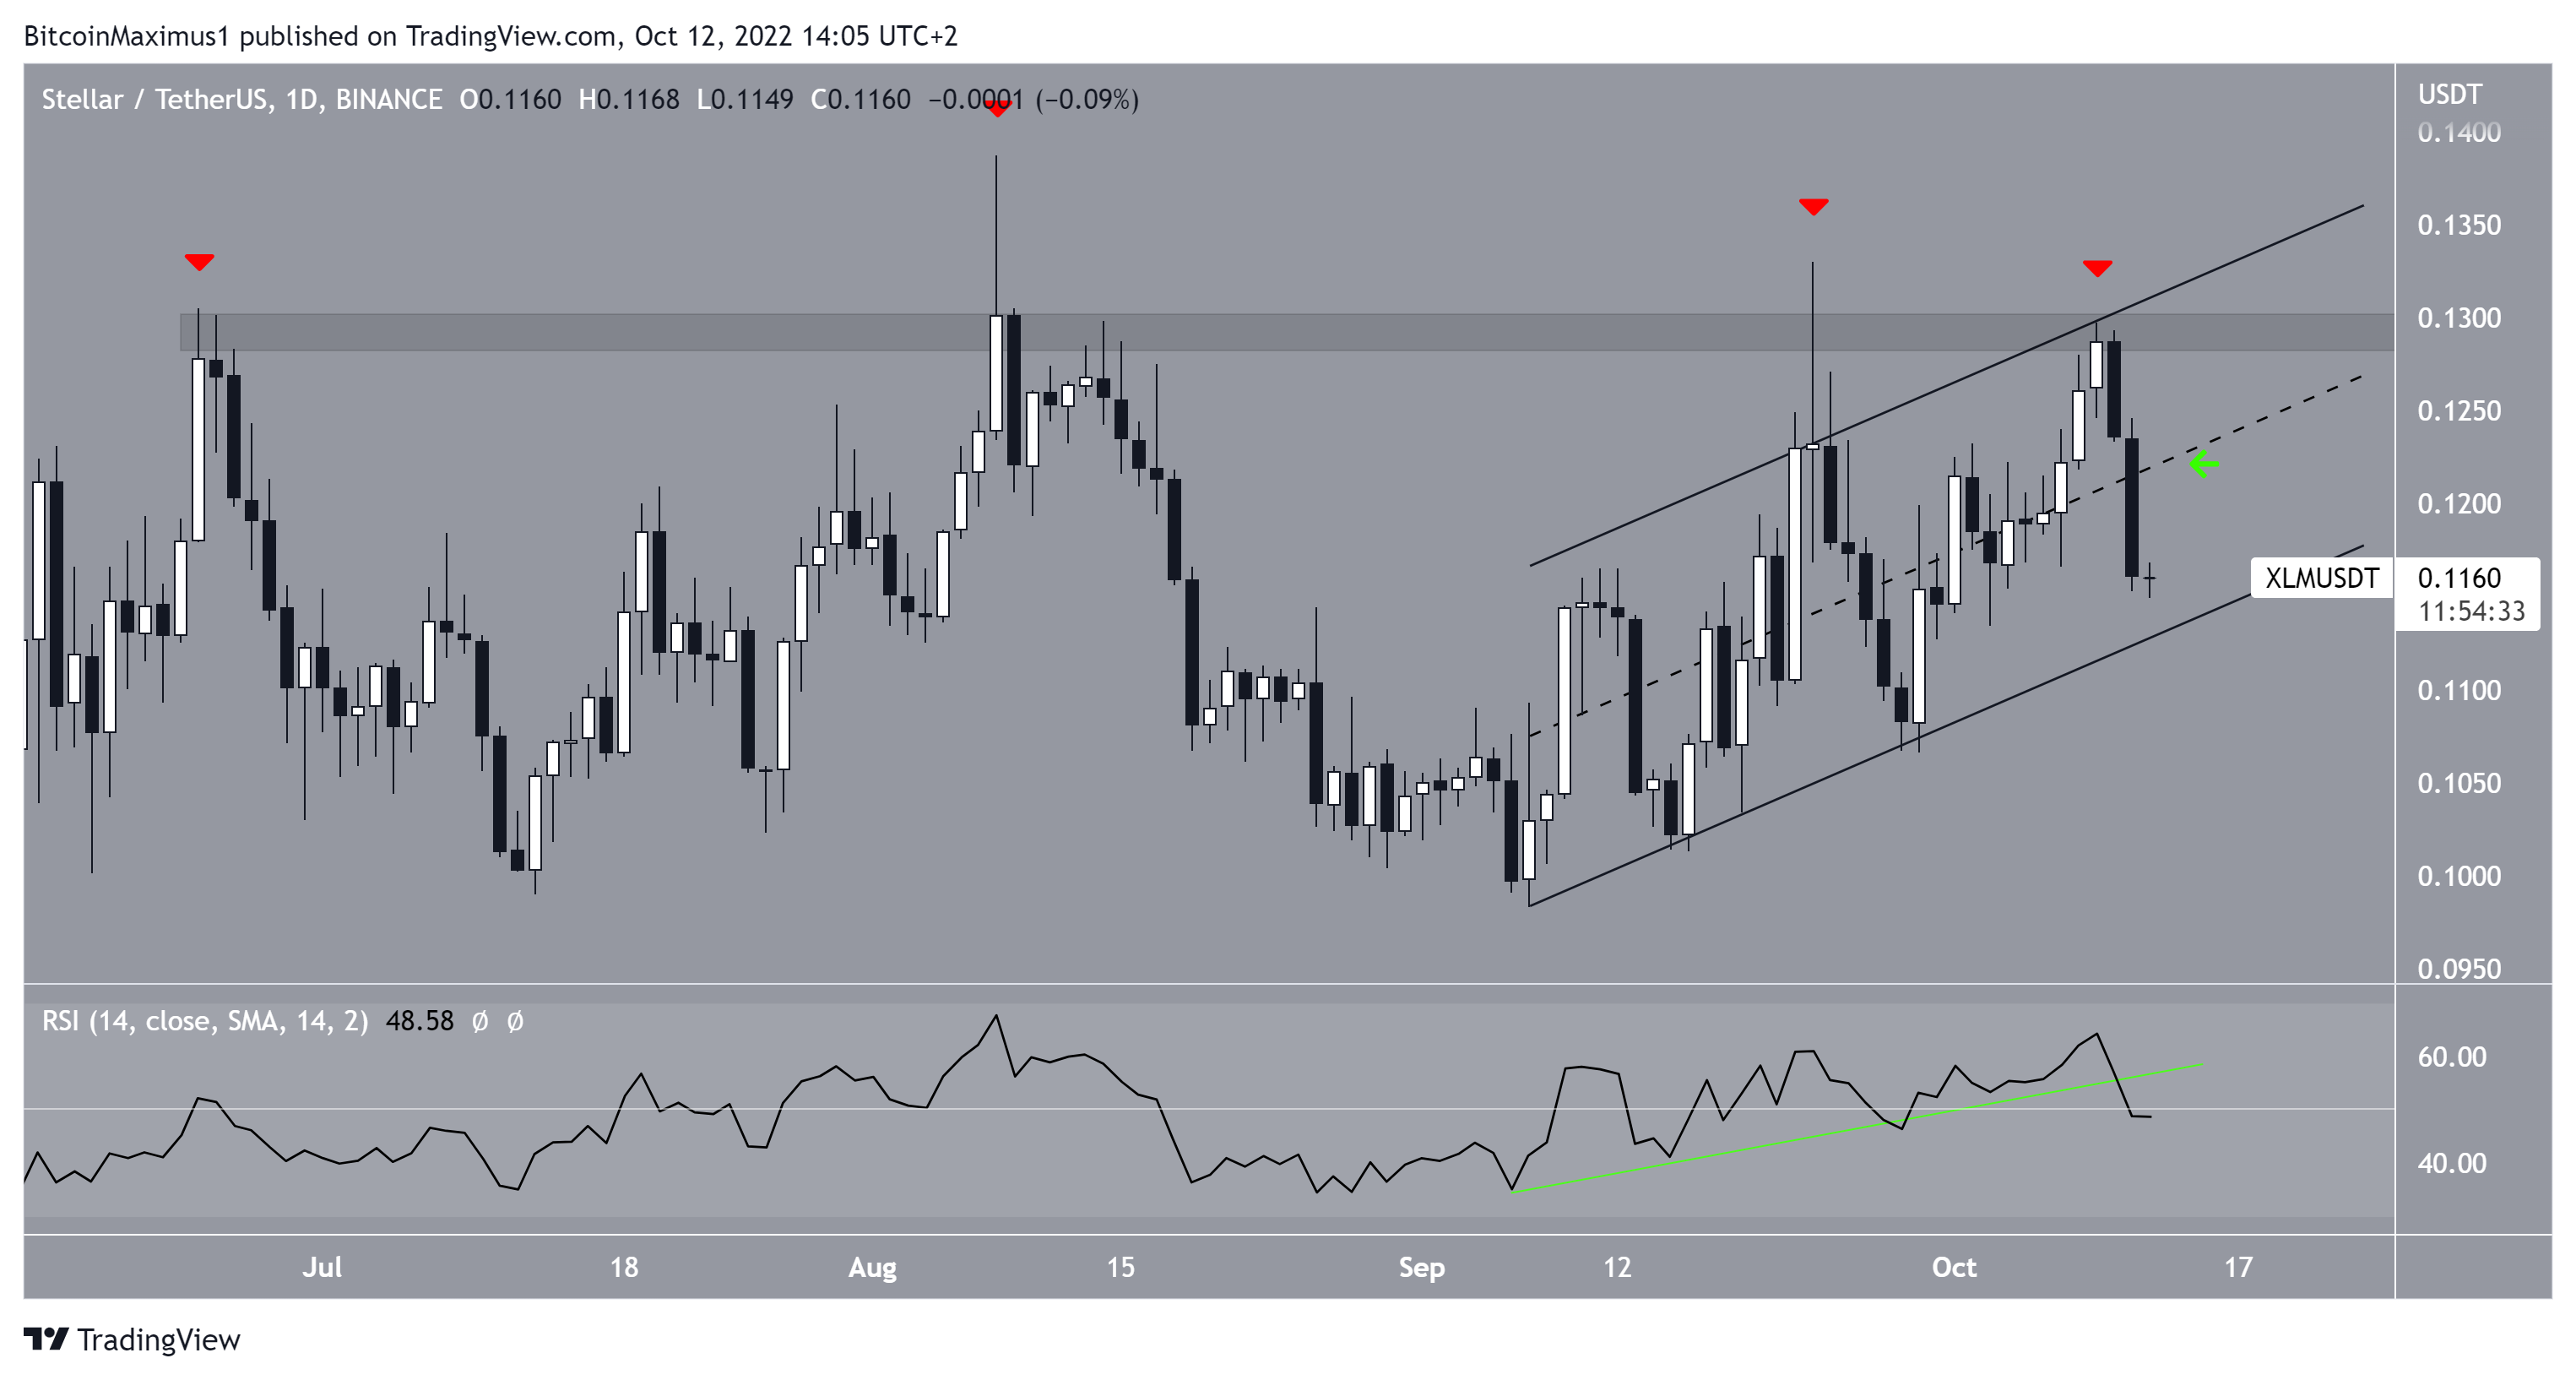
XLM price has been increasing inside an ascending parallel channel since reaching a low on Sept. 7. Such channels usually contain corrective movements, meaning that an eventual breakdown from it would be expected.
On Oct. 9, the price reached a high of $0.129. The high validated both the resistance line of the channel and the $0.129 horizontal resistance area.
It was the fourth time it validated the latter (red icons). A downward movement followed the next day and accelerated on Oct. 11.
Based on the daily timeframe, the outlook seems bearish. The daily RSI is below 50 and has broken down from an ascending support line (green line).
Moreover, the price has fallen below the midline of an ascending parallel channel (green icon). As a result of these readings, a breakdown from the channel is likely.
If this occurs, XLM price would be expected to fall towards the yearly lows near $0.100.
Future movement looking uncertain for Stellar price
To conclude, the weekly and daily RSI readings for Stellar price are diametrically opposed to each other. The former suggests that the price is in the initial stages of a more than 100% increase, while the latter indicates that a breakdown from the current channel is expected.
Due to the rejection from the $0.129 resistance area and fall below the middle of the channel, a breakdown from it is expected. After this correction is complete, the upward movement from the weekly timeframe could commence.
For Be[In]Crypto’s latest Bitcoin (BTC) analysis, click here
Disclaimer: Be[in]Crypto strives to provide accurate and up-to-date information, but it will not be responsible for any missing facts or inaccurate information. You comply and understand that you should use any of this information at your own risk. Cryptocurrencies are highly volatile financial assets, so research and make your own financial decisions.
