
After being rejected by a long-term resistance area at the end of November, Stellar (XLM) bounced at the $0.15 support level and broke out from a short-term descending resistance line.
As long as the $0.15 area holds, XLM is expected to continue moving upwards towards the target resistance levels outlined below.
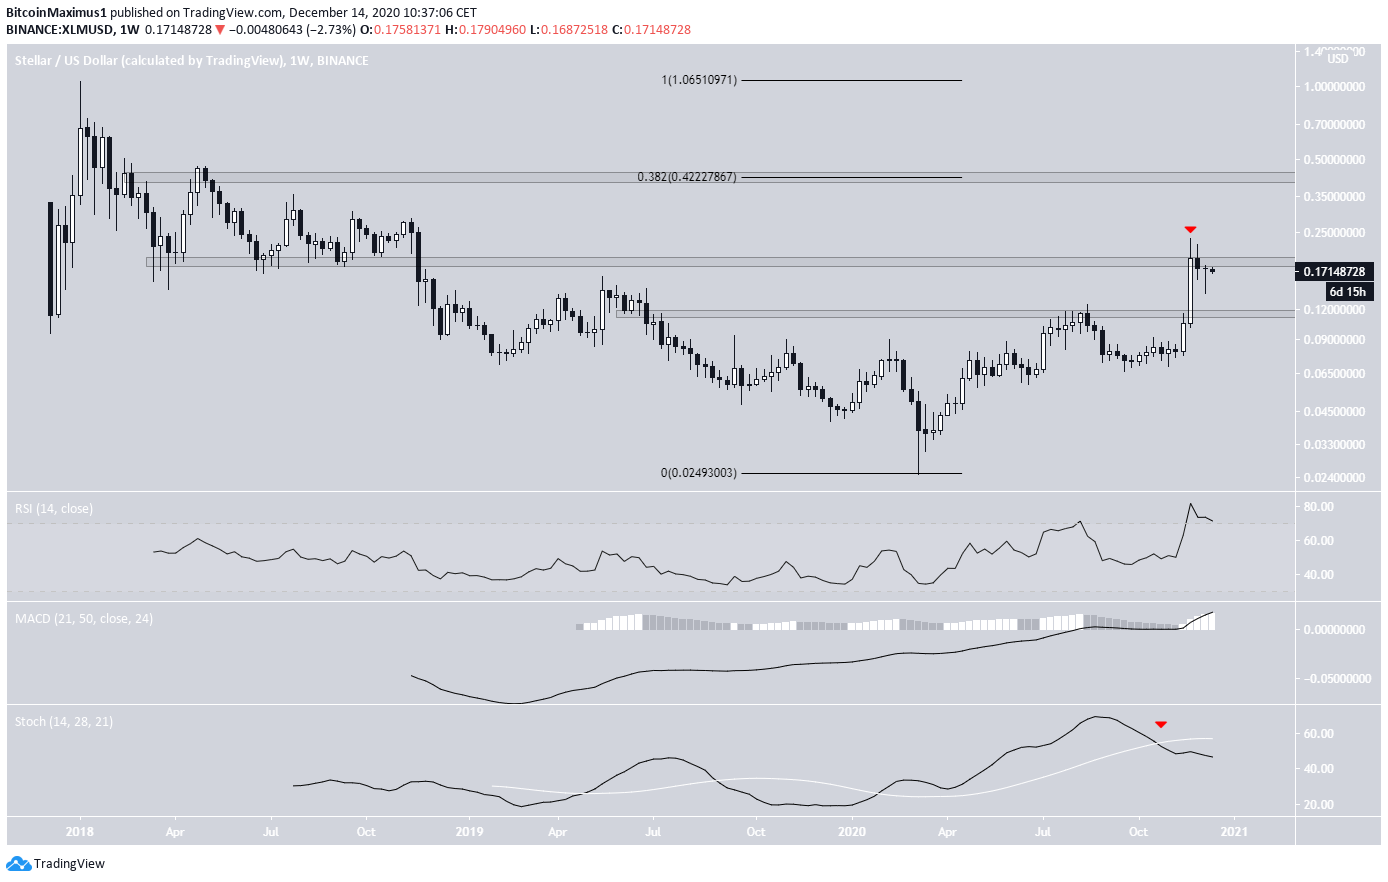
Stellar Long-Term Resistance
During the week of Nov. 23-30, the XLM price increased significantly, breaking out from the $0.115 resistance area to reach a high of $0.235.
The high was reached just above the $0.19 resistance area. XLM has not traded above this level since it initially broke down below it in November 2019.
A breakout above this level could cause a rapid move up to $0.42, the next closest resistance area and the 0.382 Fib retracement of the recent decrease. On the other hand, the closest support area is found at $0.115.
While the RSI and MACD are bullish, the Stochastic oscillator has made a bearish cross, casting doubt on the possibility of this breakout.
Note: The logarithmic chart is used in the image below in order to better visualize large price fluctuations.
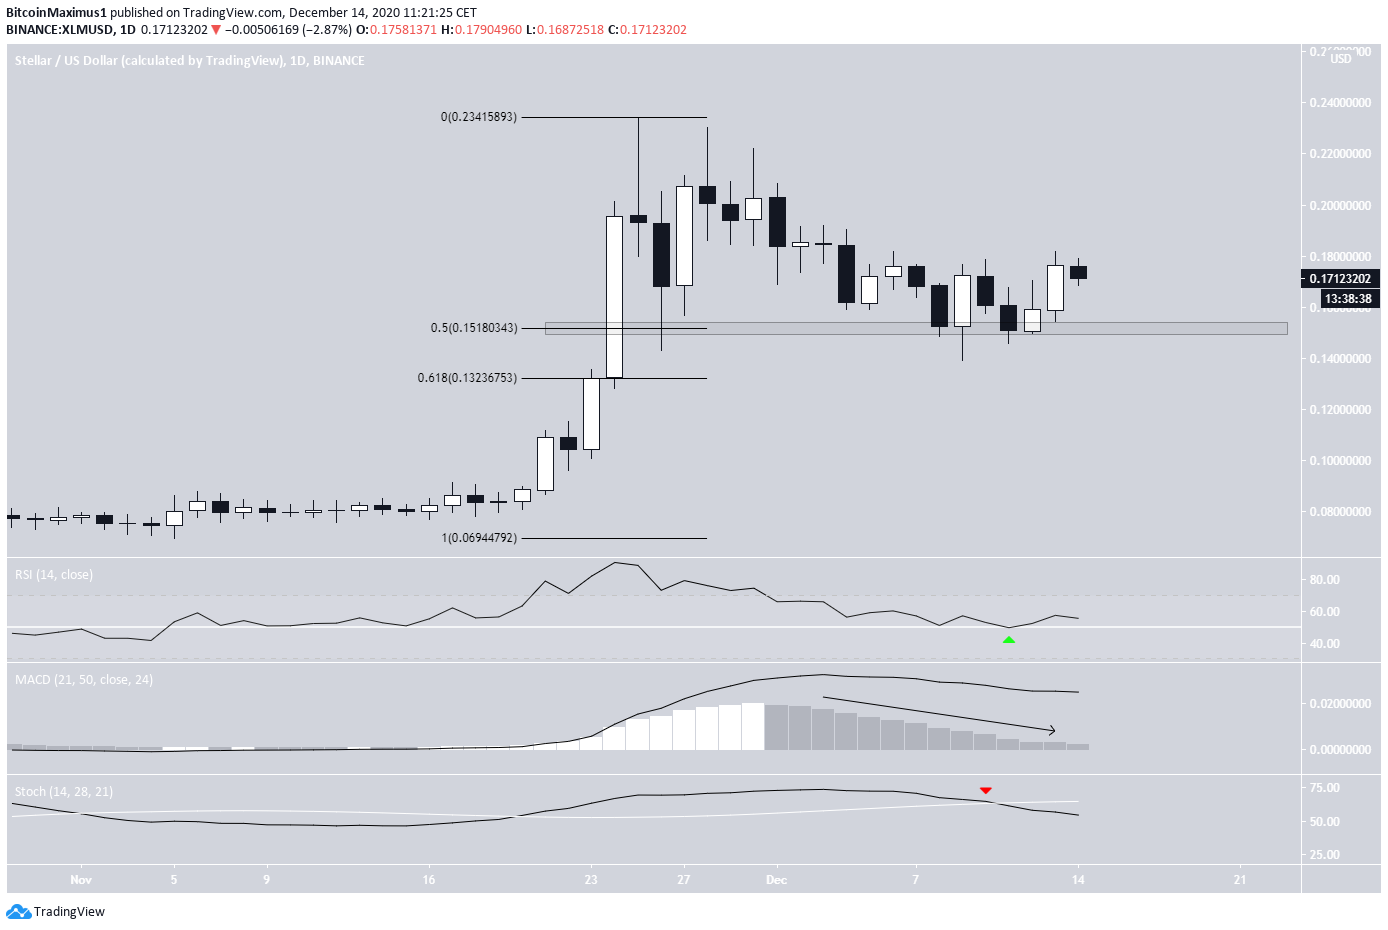
Bounce Leads to Breakout
The daily chart shows that after the rejection on Nov. 25. XLM continued to decrease until Dec. 9. However, it immediately bounced upwards, validating the $0.151 area as support. This support level is also the 0.5 Fib retracement level of the most recent upward move.
Despite the bounce, technical indicators are similarly undecided, with the RSI being bullish while the MACD and Stoch remain bearish.
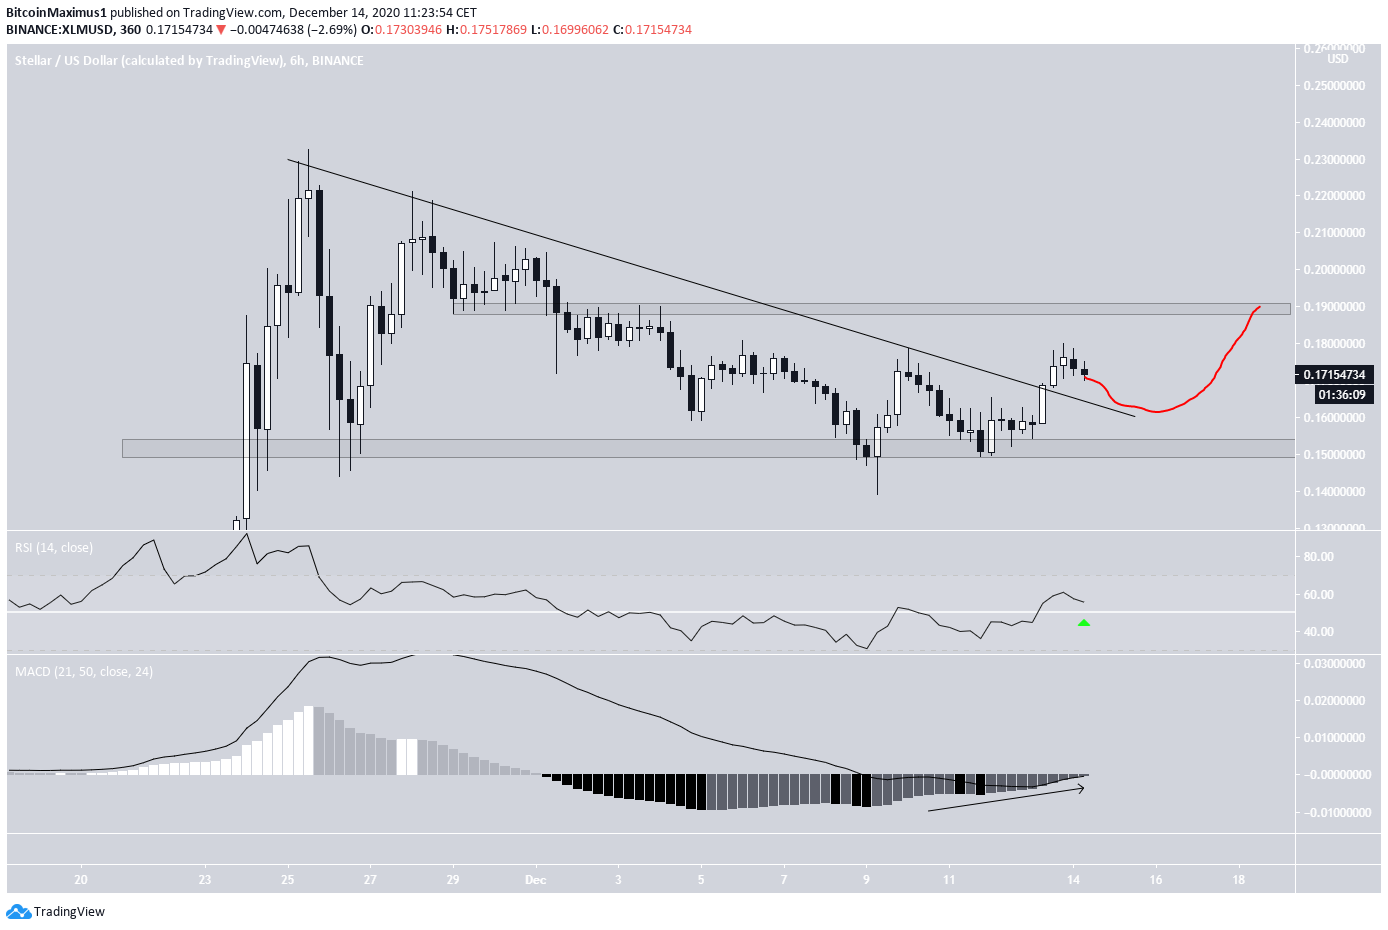
The six-hour chart is more bullish and shows a breakout from a descending resistance line in place since the aforementioned Nov. 25 high. This could be a sign that the decrease has ended and XLM has begun an upward move.
Both the RSI and MACD support this possibility.
If XLM continues to move upwards, the first minor resistance area would be found at $0.19
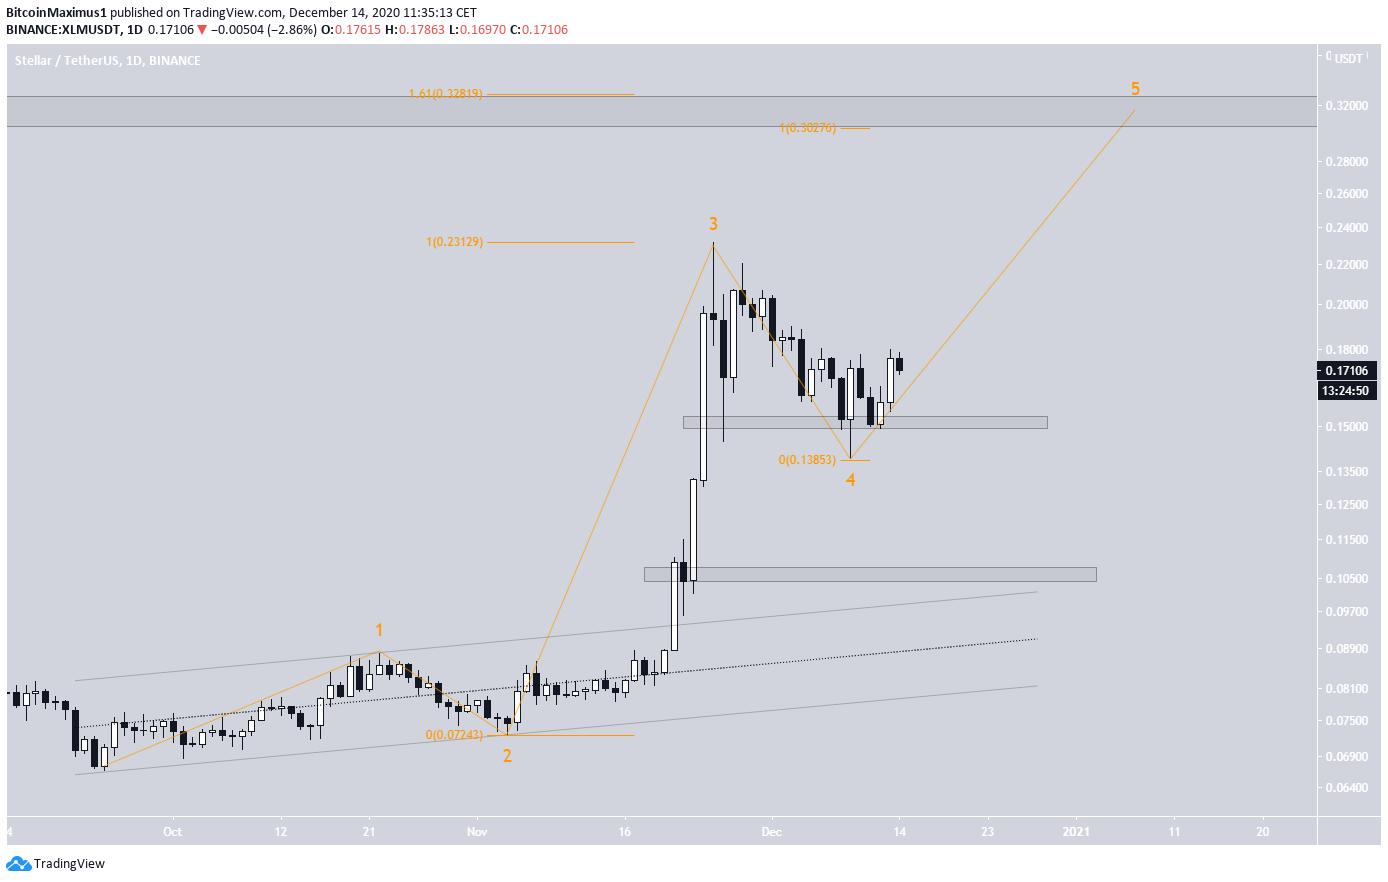
XLM Wave Count
Cryptocurrency trader @Thetradinghubb stated that the XLM price is likely trading inside a fourth wave triangle.
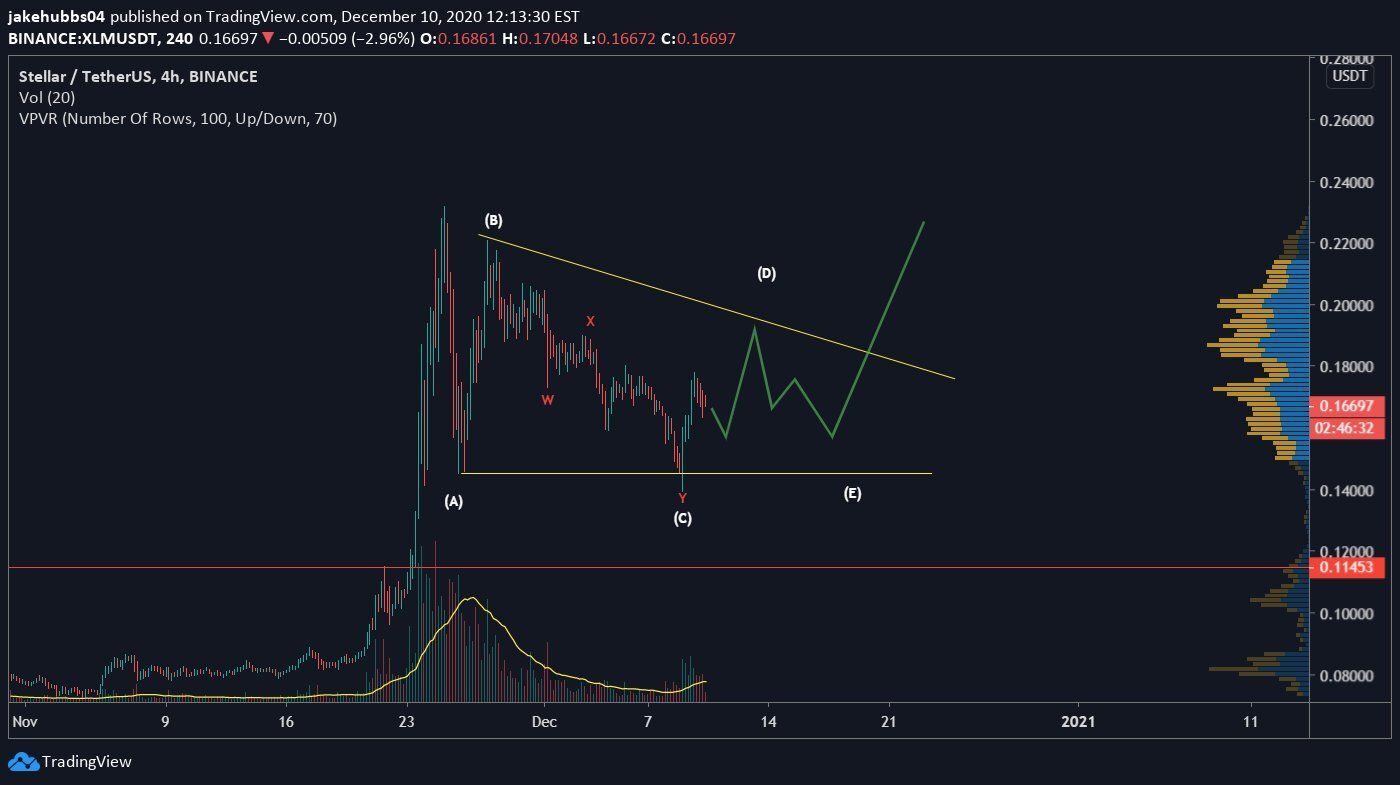
While it is possible that XLM is trading inside a symmetrical triangle, the fact that the C wave went below the A wave and the previously outlined short-term breakout level makes it more likely that a fourth wave triangle is not the correct count.
Instead, it is possible that XLM has completed wave 4 (shown in orange below) and has now begun wave 5.
A likely target for the top of this move would be between $0.302-$0.328. This range consists of a projection of the lengths of waves 1-3 and the 1.61 Fib extension of wave 3.
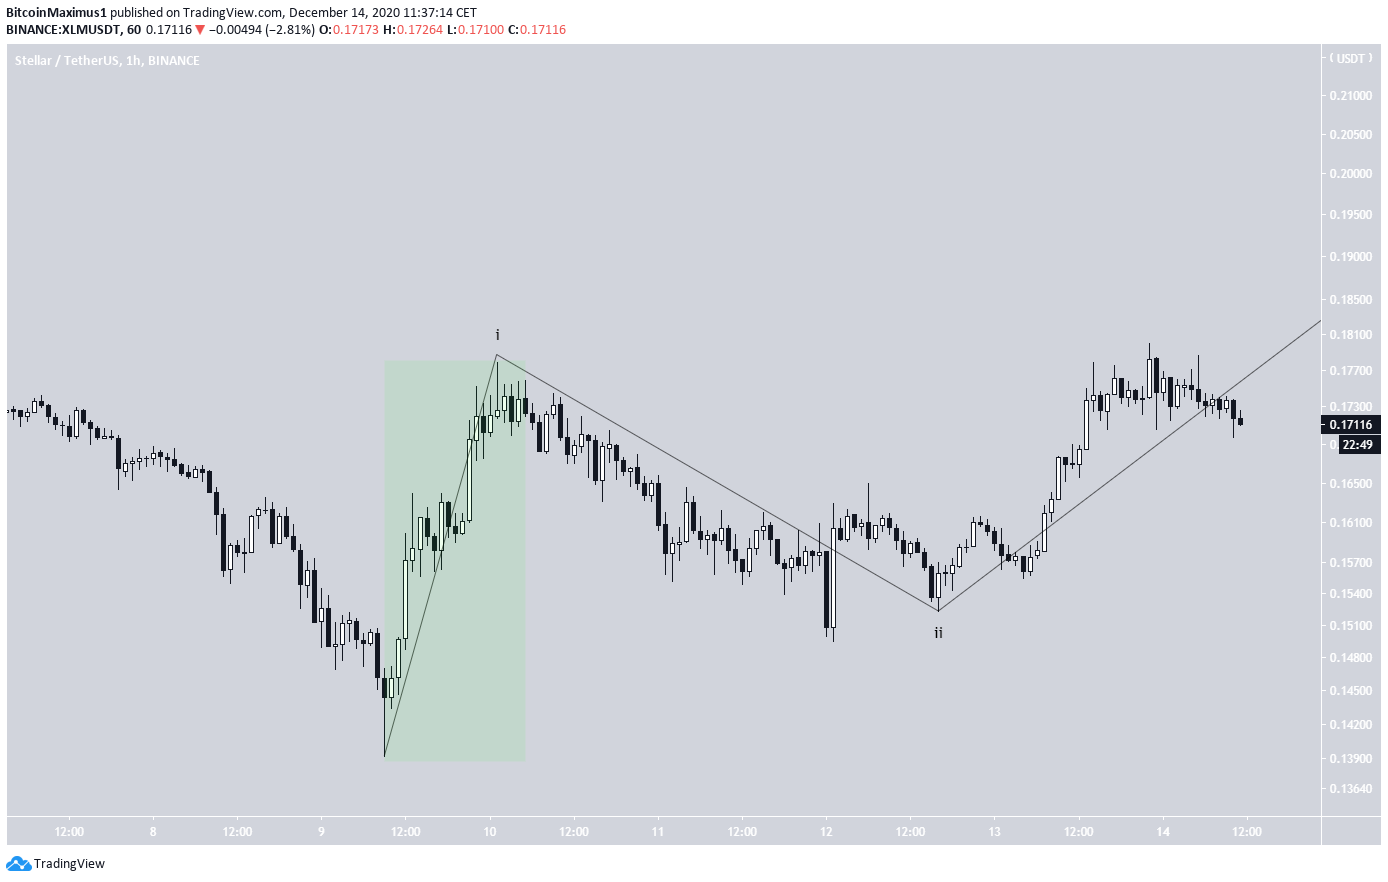
The hourly chart also shows that the move following the Dec. 9 lows was impulsive (highlighted in green below). This makes it likely that wave 4 for XLM ended at those lows and began wave 5 after.
Conclusion
The XLM price is expected to continue moving upwards towards $0.302-$0.328. A close below the $0.15 support area would invalidate this possibility.
For BeInCrypto’s latest Cardano (ADA) analysis, click here!
Disclaimer: Cryptocurrency trading carries a high level of risk and may not be suitable for all investors. The views expressed in this article do not reflect those of BeInCrypto.
