
The Stellar (XLM) price has likely begun a new bullish trend. The rate of increase is likely to accelerate for both XLM/BTC and XLM/USD once the price breaks out from the current resistance level.
Cryptocurrency trader @PostyXBT stated that the XLM price could offer a very good setup if the current resistance area can be flipped to support:
$XLM Daily chart could be offering ridiculously good R:R IF resistance can be flipped. Not the cleanest of ranges but price has been down here in this 60% range for almost one year now. First target +75%
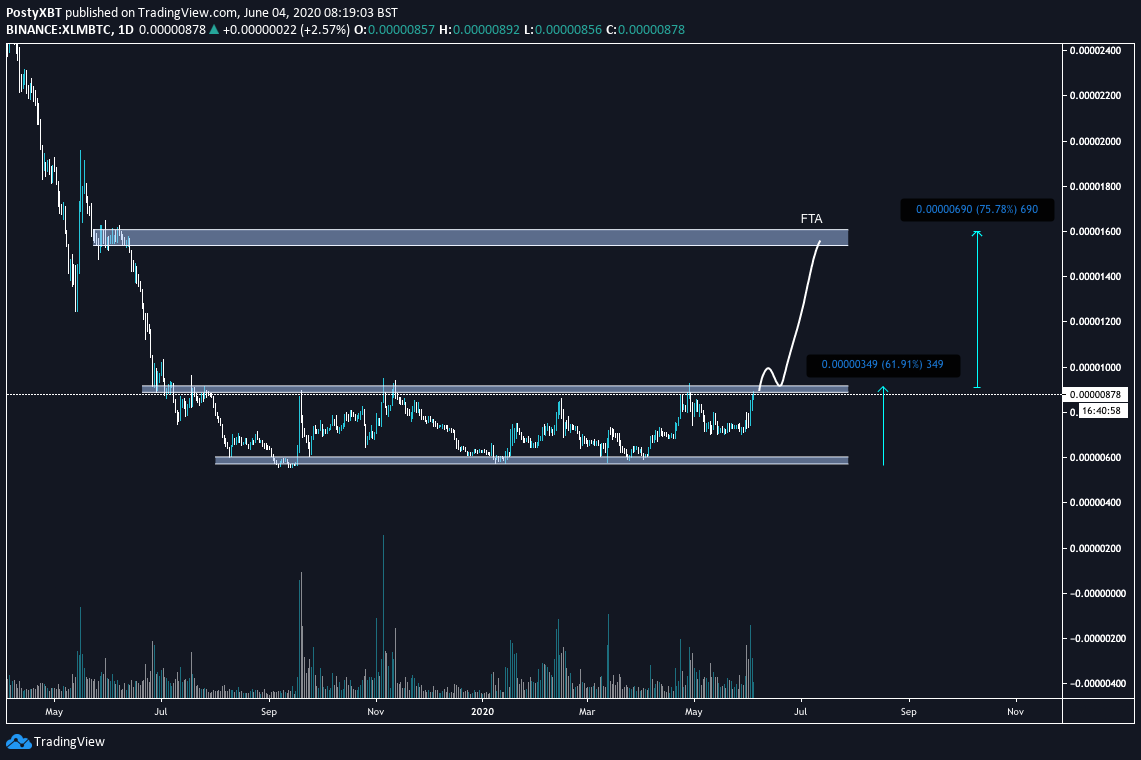
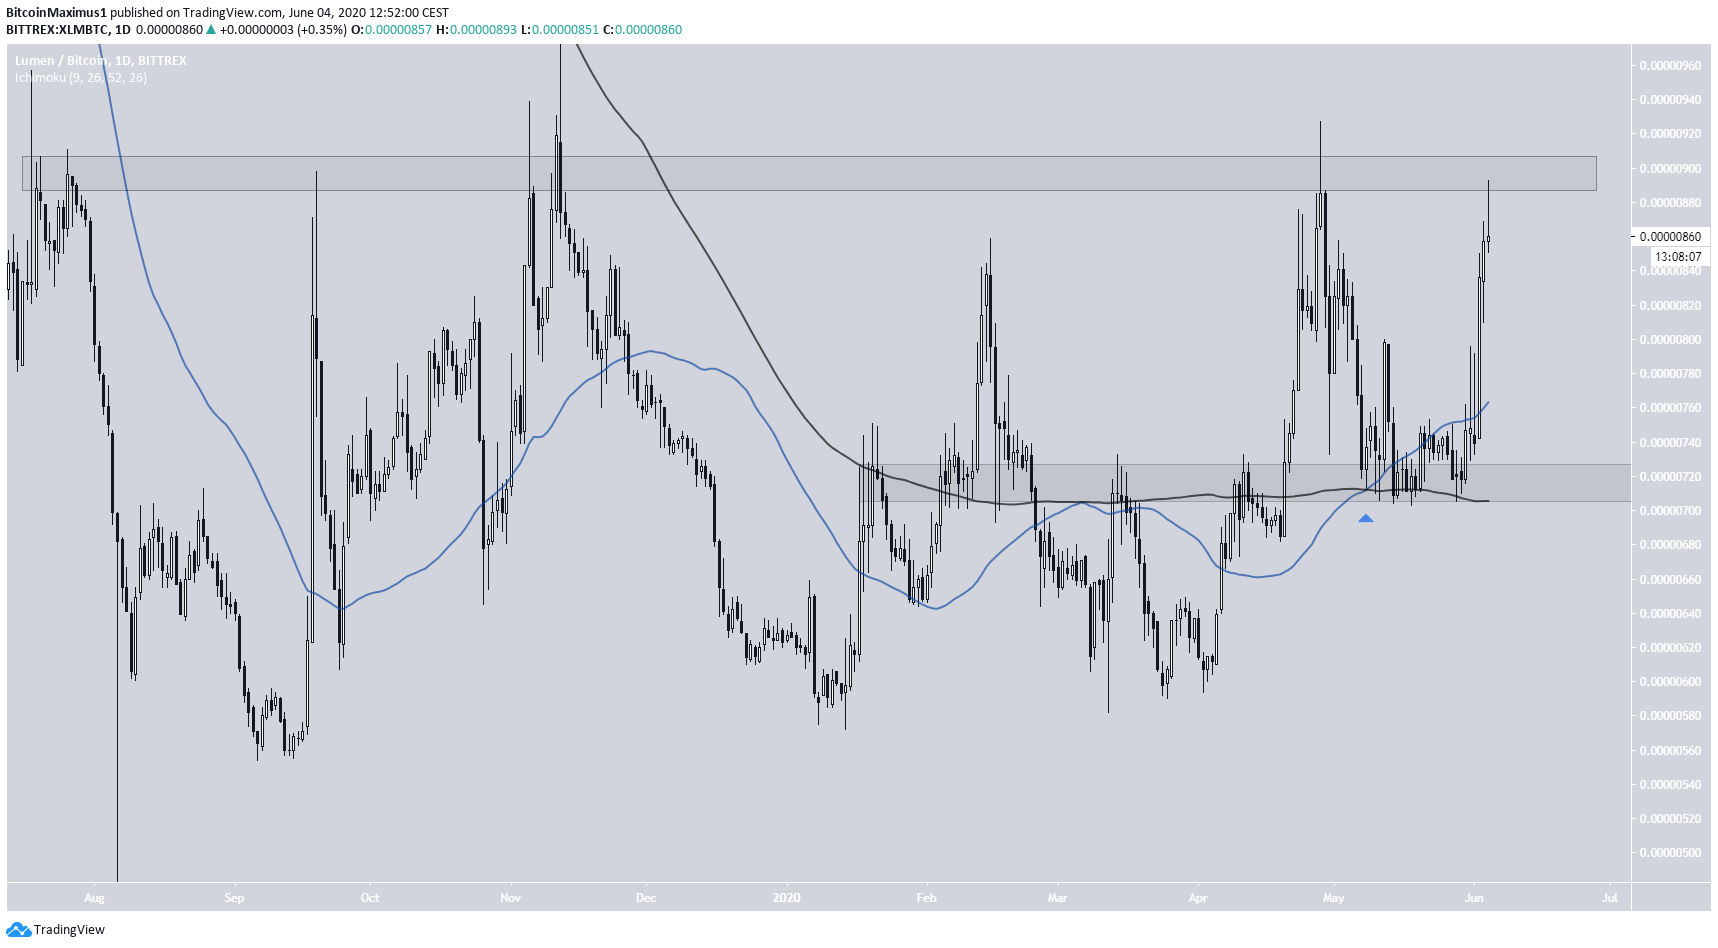
The aforementioned resistance area for XLM is found at 920 satoshis — most recently rejecting the price on April 28. However, after decreasing, the price found support above 720 satoshis at the beginning of June and has been rapidly increasing since.
In addition, a bullish cross between the 50- and 200-day moving averages (MAs) has transpired and the price is trading above both MAs, a sign that XLM has already begun a bullish trend.
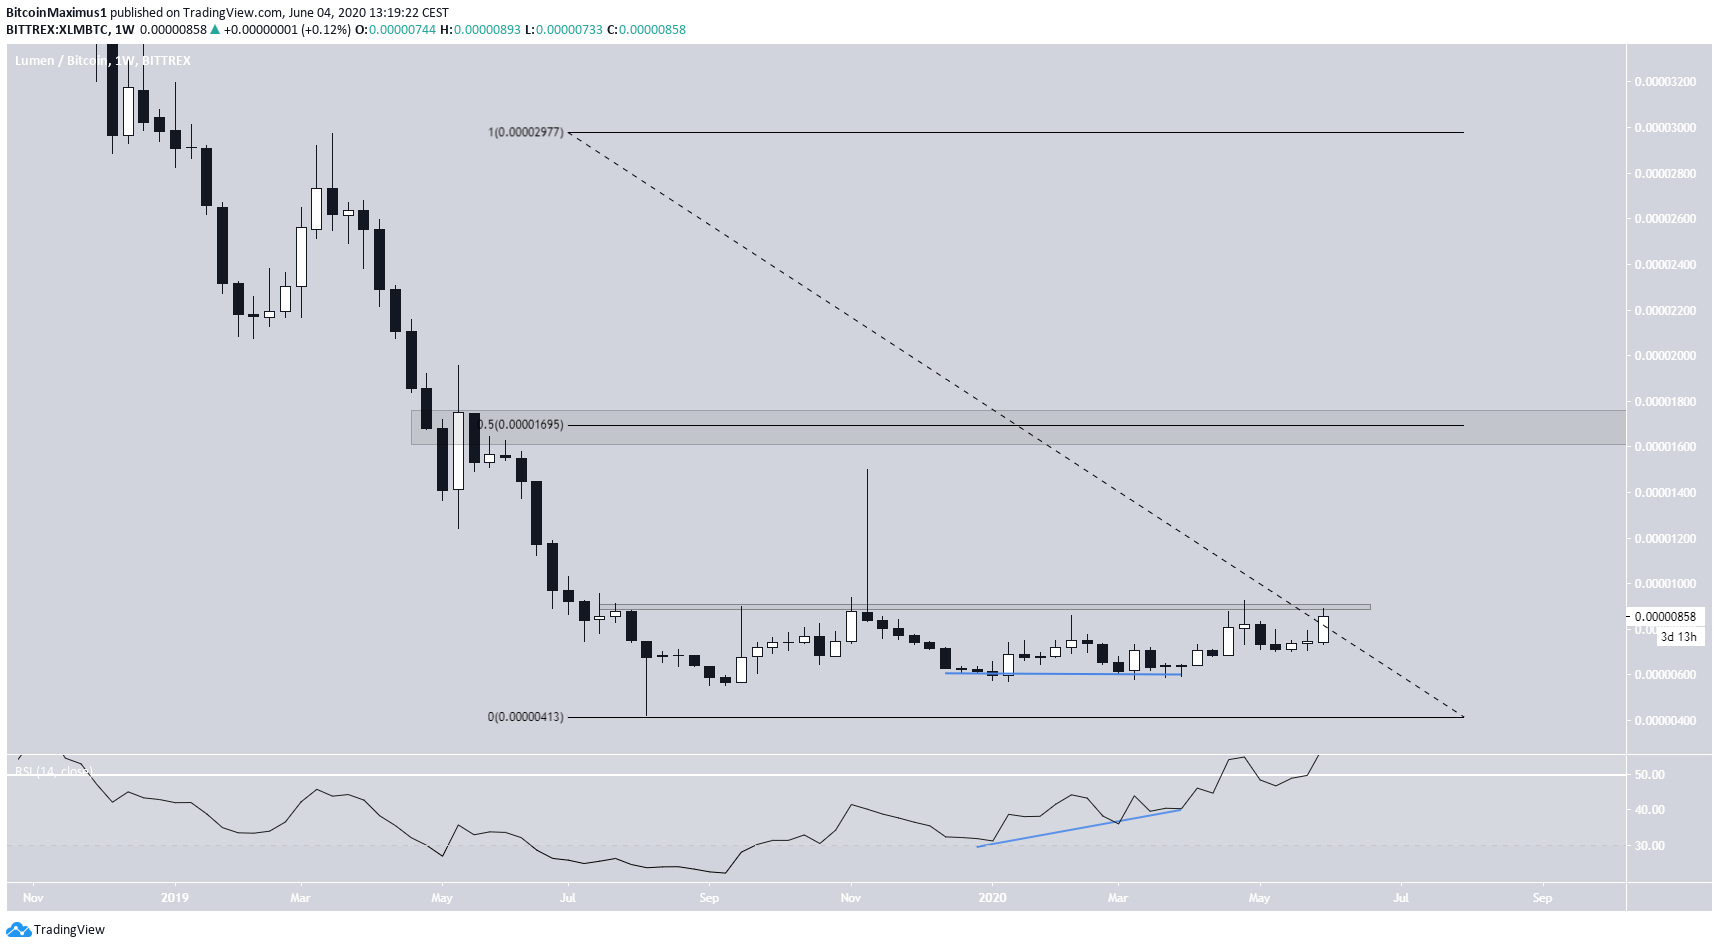
The weekly chart reveals a double bottom pattern which combined with a bullish divergence in the RSI, a sign that the price is likely to break out from the aforementioned resistance area and move upwards.
In addition, the weekly RSI has crossed above 50 for the first time since 2018, a sign that a bullish trend may soon begin. If it does, the next important resistance level is found at 1700 satoshis, which is the 0.5 Fib level of the entire downward movement and a previous resistance area.
XLM/USD
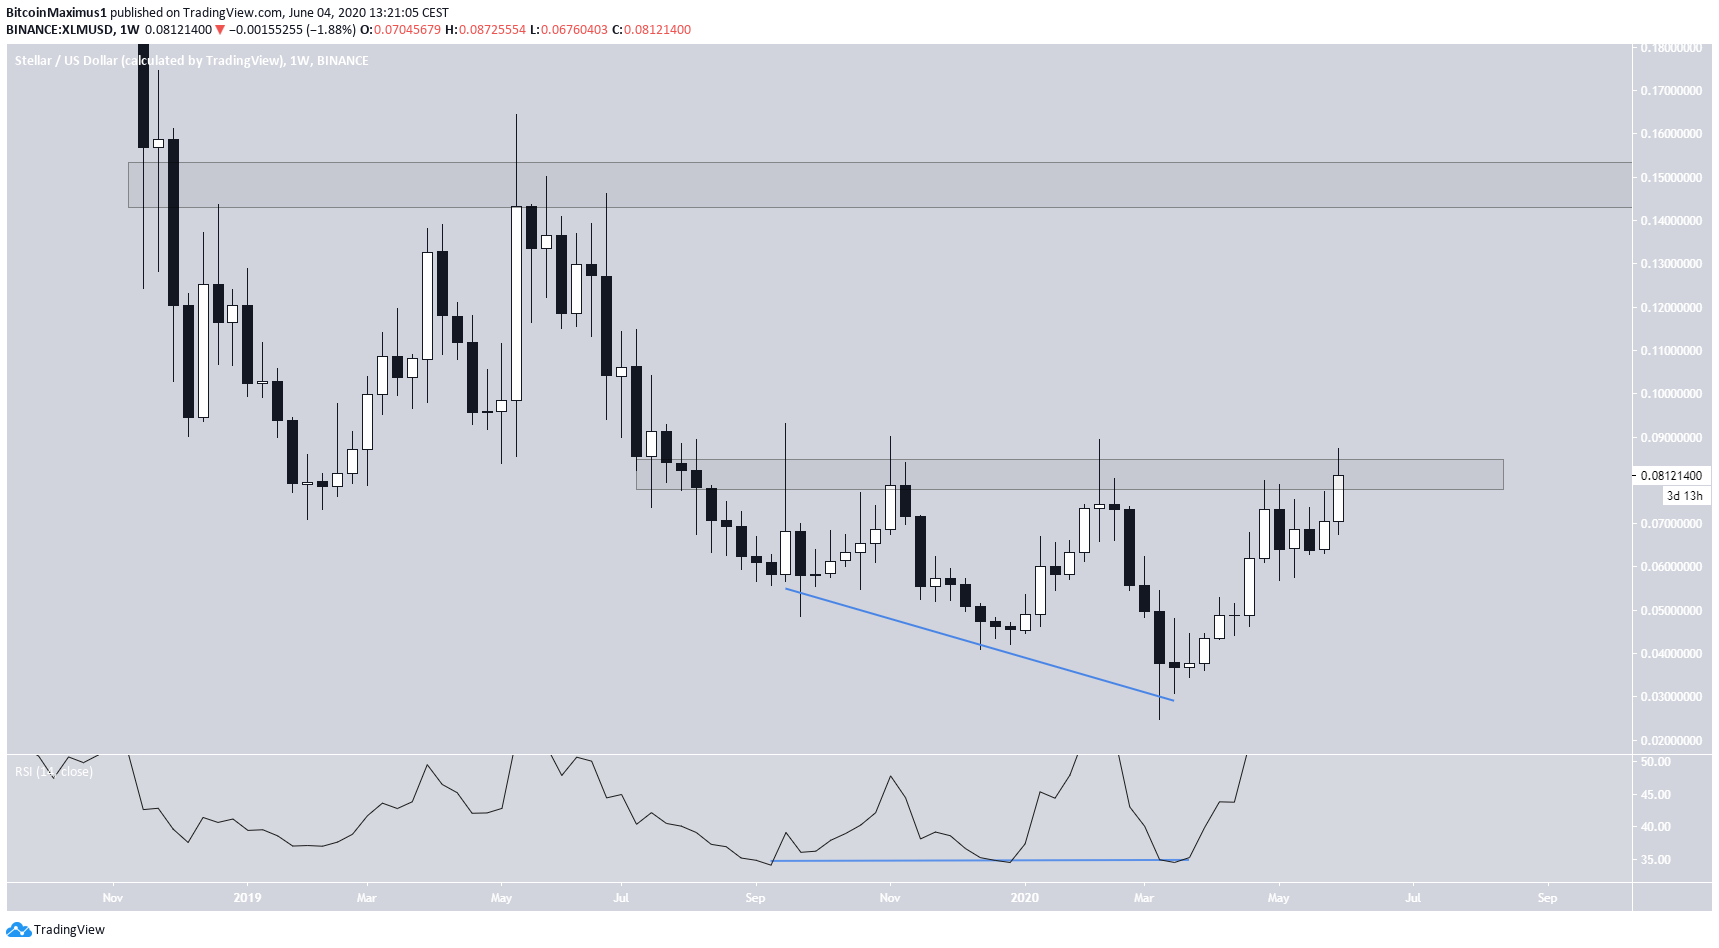
The XLM/USD pair also shows a growing bullish divergence in the RSI, in which the price has created three lower lows but the RSI has created identical lows. This is a sign that the price is likely to move upwards.
However, the price is also trading inside an important resistance area at $0.082, above which it has not traded since September 2019. If the price breaks out, which looks likely due to the RSI movement, the next resistance area is found at $0.15.
To conclude, both XLM/BTC and XLM/USD are trading inside crucial resistance areas, a breakout above which could trigger a rapid increase for more than 50 percent. Technical indicators are bullish for both, suggesting that the price will eventually be successful in breaking out.
