


On August 10, 2019, the Stellar price reached a low of 613 satoshis. An upward move ensued shortly after and the price reached a high of 700 satoshis the next day. After a slight decrease, XLM reached similar highs near 700 satoshis on August 14 and 25.
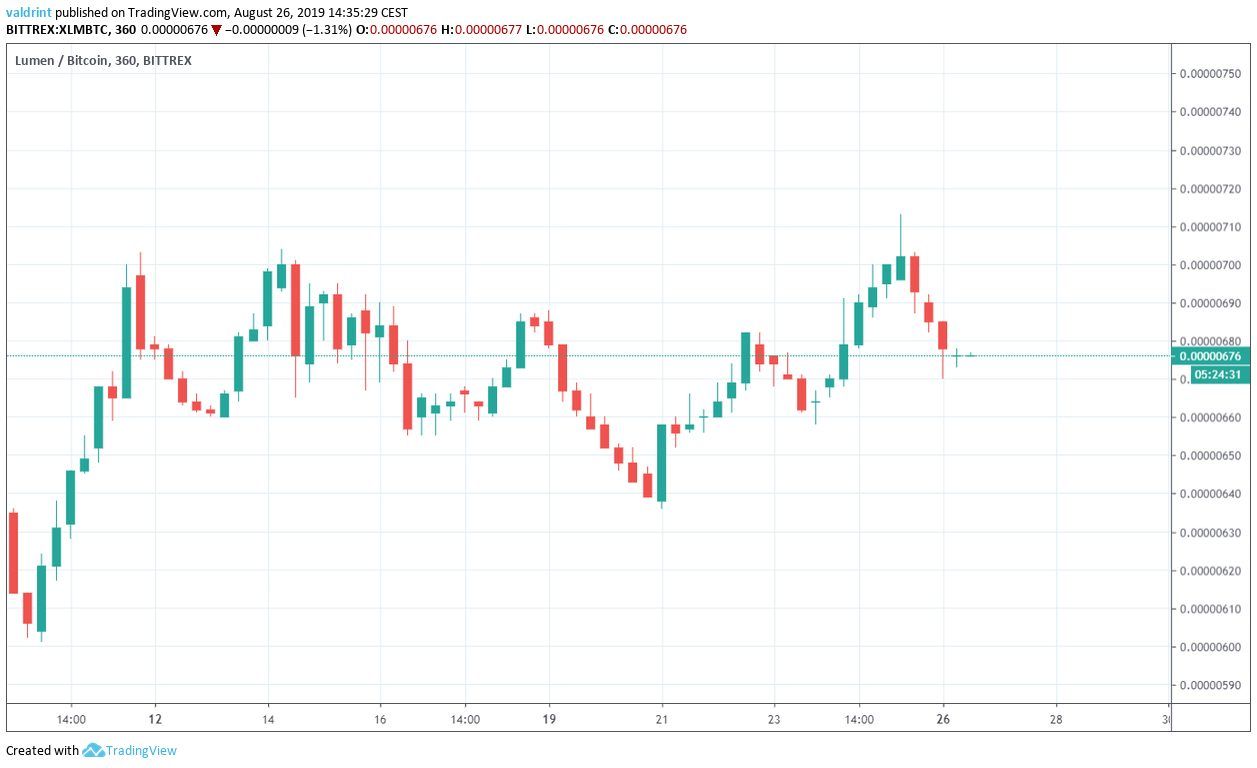
Will Stellar finally increase above 700 satoshis? Continue reading if you want to find out.
For our previous analysis, click here.
If you are interested in trading Stellar (XLM) and other cryptocurrencies with a multiplier of up to 100x on our new partner exchange with the lowest fees, follow this link to get a free StormGain account!

Stellar Price: Trends and Highlights for August 26
- XLM/BTC is trading inside an ascending triangle.
- There is support at 600 satoshis.
- XLM is trading above the 10- but below the 20-day moving average.
- The MACD has made a bullish cross.
- There is resistance at 750 satoshis.
Long-Term Support
In order to determine the probability that a reversal will begin at the current level, we will take a look at the weekly time-frame.
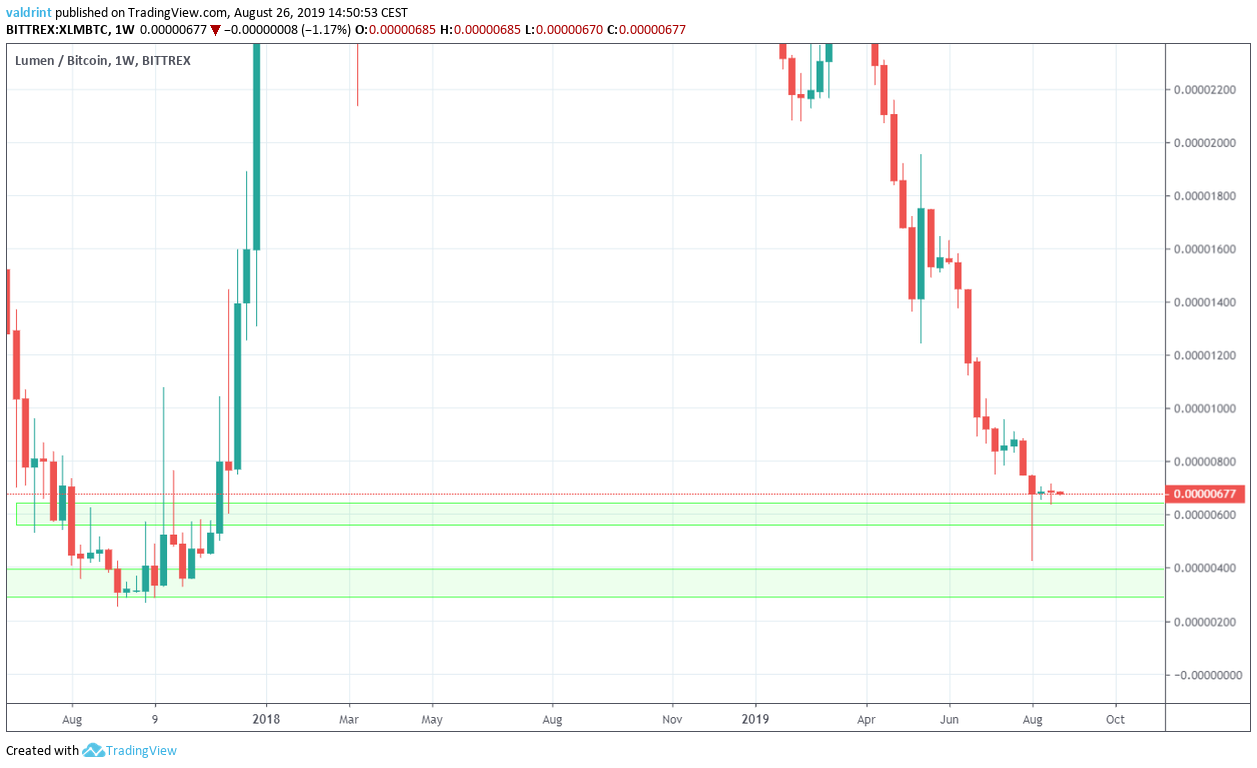
We can see two support areas, at 600 and 400 satoshis, respectively.
The price is trading slightly above the first one.
Therefore, the current level is suitable for the initiation of a reversal.
Current Pattern
A closer look at price movement reveals that the XLM price is trading inside an ascending triangle.
The ascending triangle is considered a bullish pattern.
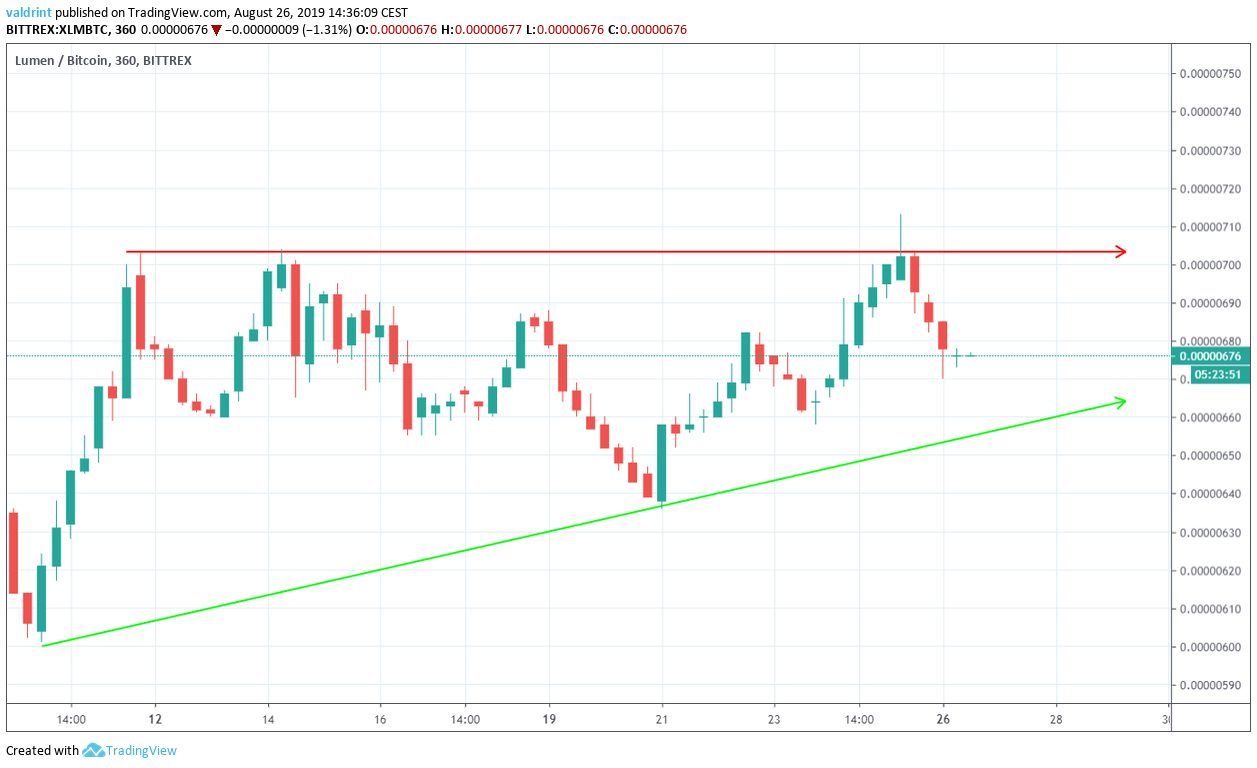
At the time of writing, XLM was decreasing towards the support line after touching the resistance on August 25.
Will XLM break out?
XLM Price Possible Uptrend
In order to determine the likelihood of a breakout, we will incorporate moving averages (MA) and the MACD into the analysis.
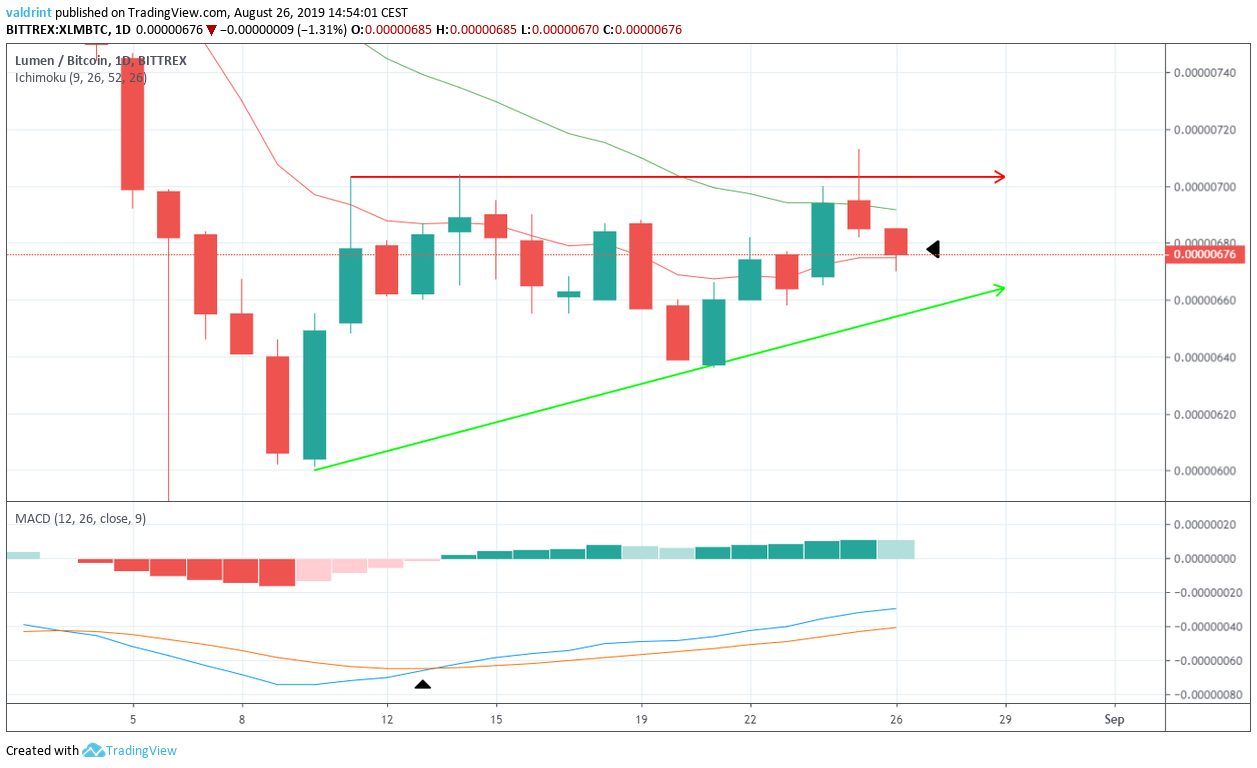
The XLM price is trading above the 10- but below the 20-day MAs.
However, the 10-day MA is turning upward, possibly setting up a bullish cross.
In the MACD, this bullish cross has already occurred.
Individually, this is not a sufficient sign to predict a breakout.
However, when we combine it with the creation of a bullish pattern and a significant support area, we can confidently say that a breakout is likely.
Resistance Areas
In case a breakout occurs, one resistance area is outlined below.
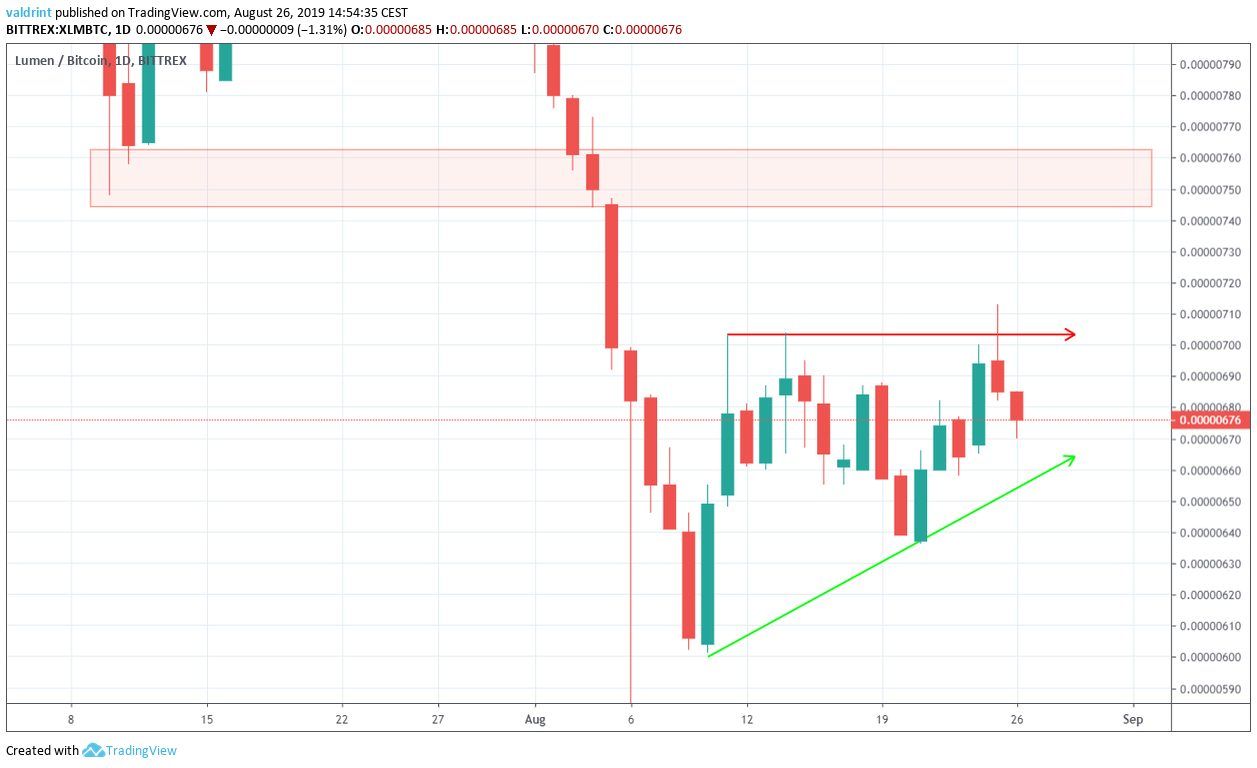
It is found at 750 satoshis.
According to our analysis, the XLM price is likely to reach it.
XLM Price Summary
The XLM price is trading inside an ascending triangle.
According to our analysis, it is likely to break out and reach the resistance area outlined above.
For trading purposes, we consider XLM a buy, both for the short- and long-term.
Do you think the XLM price will break out from the triangle? Let us know in the comments below.
Disclaimer: This article is not trading advice and should not be construed as such. Always consult a trained financial professional before investing in cryptocurrencies, as the market is particularly volatile.
Images are courtesy of Shutterstock, TradingView.


