


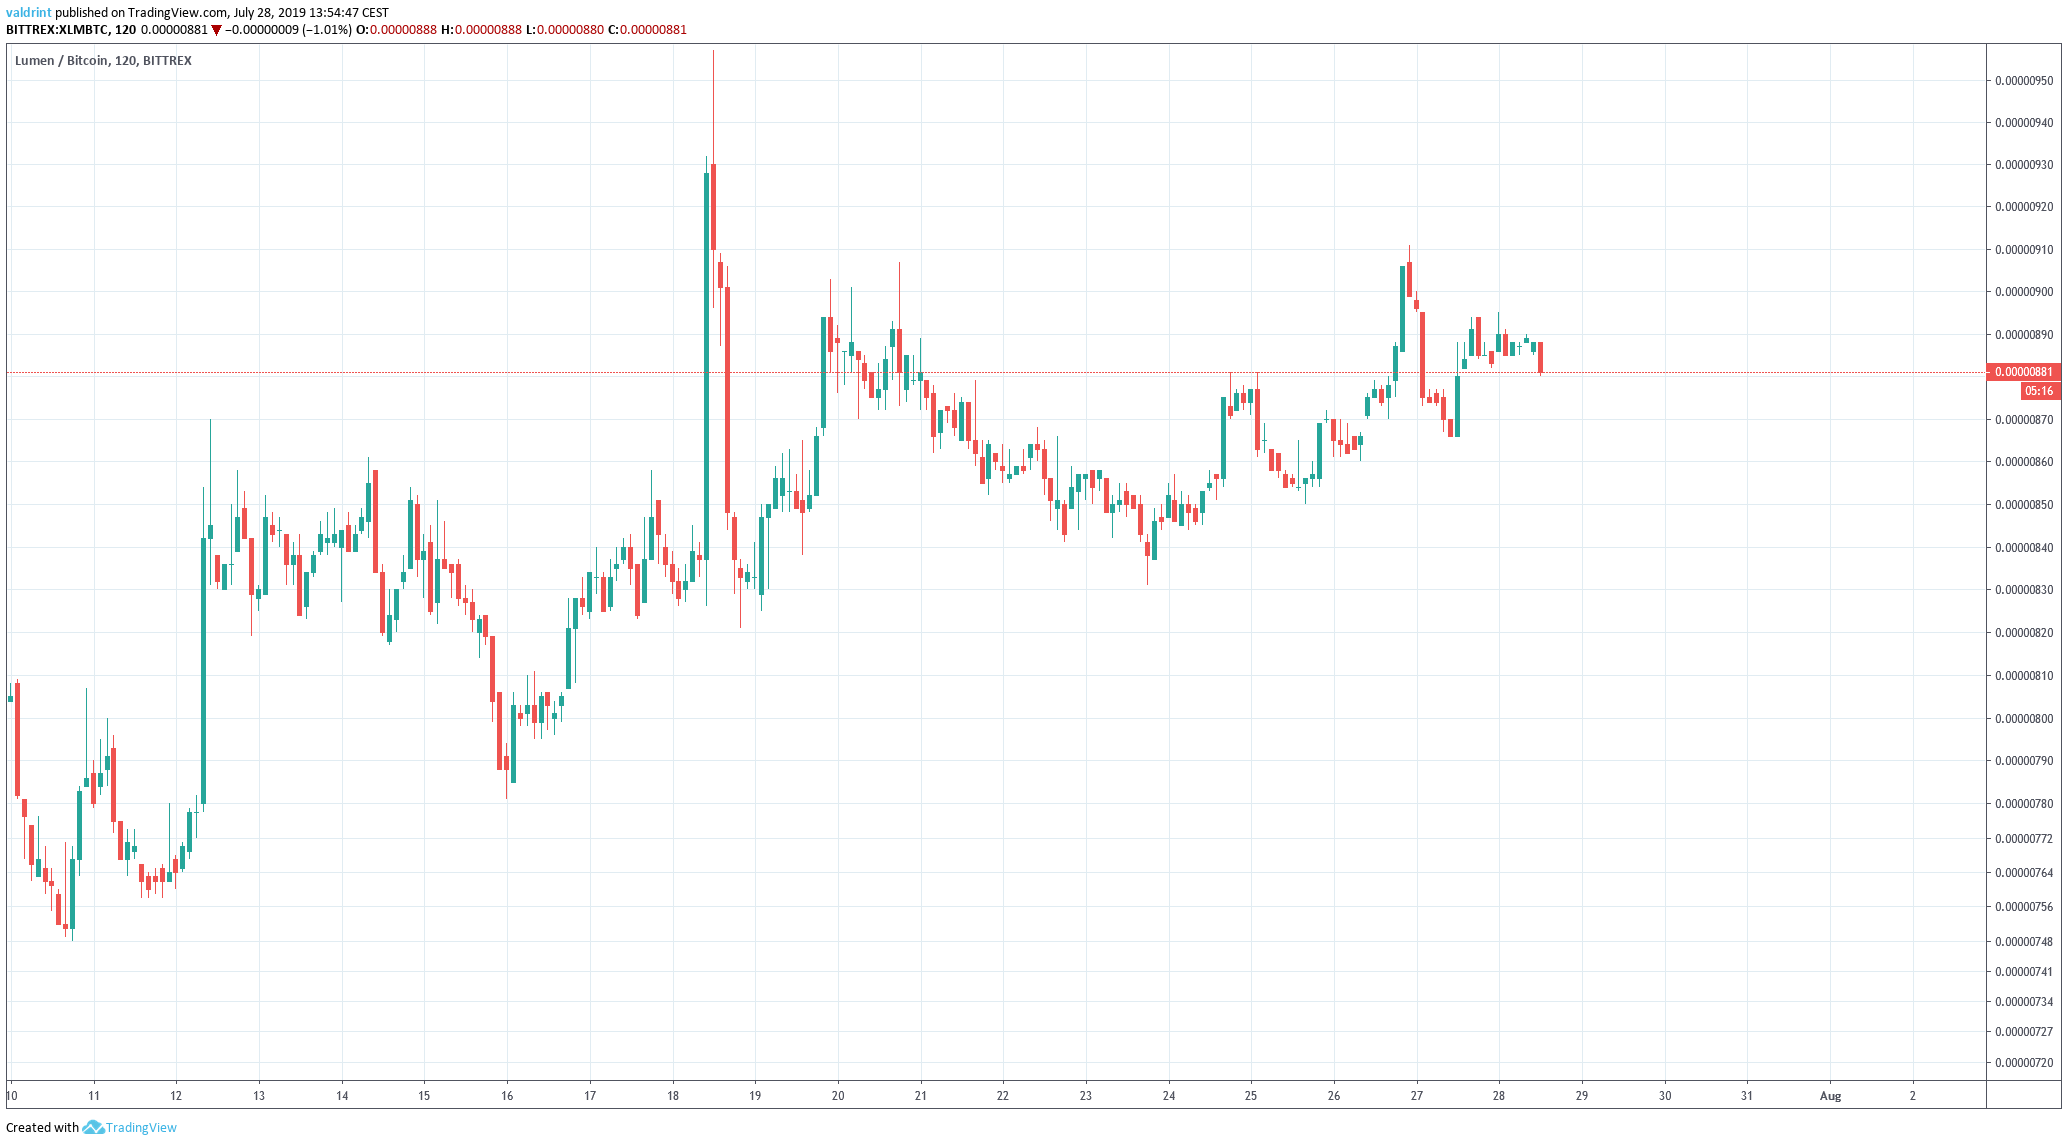
On July 10, 2019, the Stellar (XLM) price reached a low of 749 satoshis. An upward move ensued. On July 18, it reached a high of 957 satoshis. Since then, it has been decreasing, trading inside a range between 850 and 910 satoshis.
Will Stellar reverse or are there further gains in store? In order to find the answer to that question, keep scrolling below.
For our previous analysis, click here.
If you would like to trade cryptocurrencies with a multiplier of up to 100x on our partner exchange, follow this link to register for free on StormGain.
XLM Price: Trends and Highlights for July 29
- XLM/BTC is trading inside an ascending triangle.
- It is trading inside a long-term descending wedge.
- Daily moving averages have made a bullish cross.
- There is a very strong bullish divergence developing in the RSI & MACD
- There is resistance at 2900, 1800, 1500 and 1300 satoshis.
Stellar Price Current Pattern
Since reaching a low on July 10, the XLM price has been increasing, trading inside the ascending channel outlined below.
The ascending triangle is considered a bullish pattern, making price breakouts more likely.
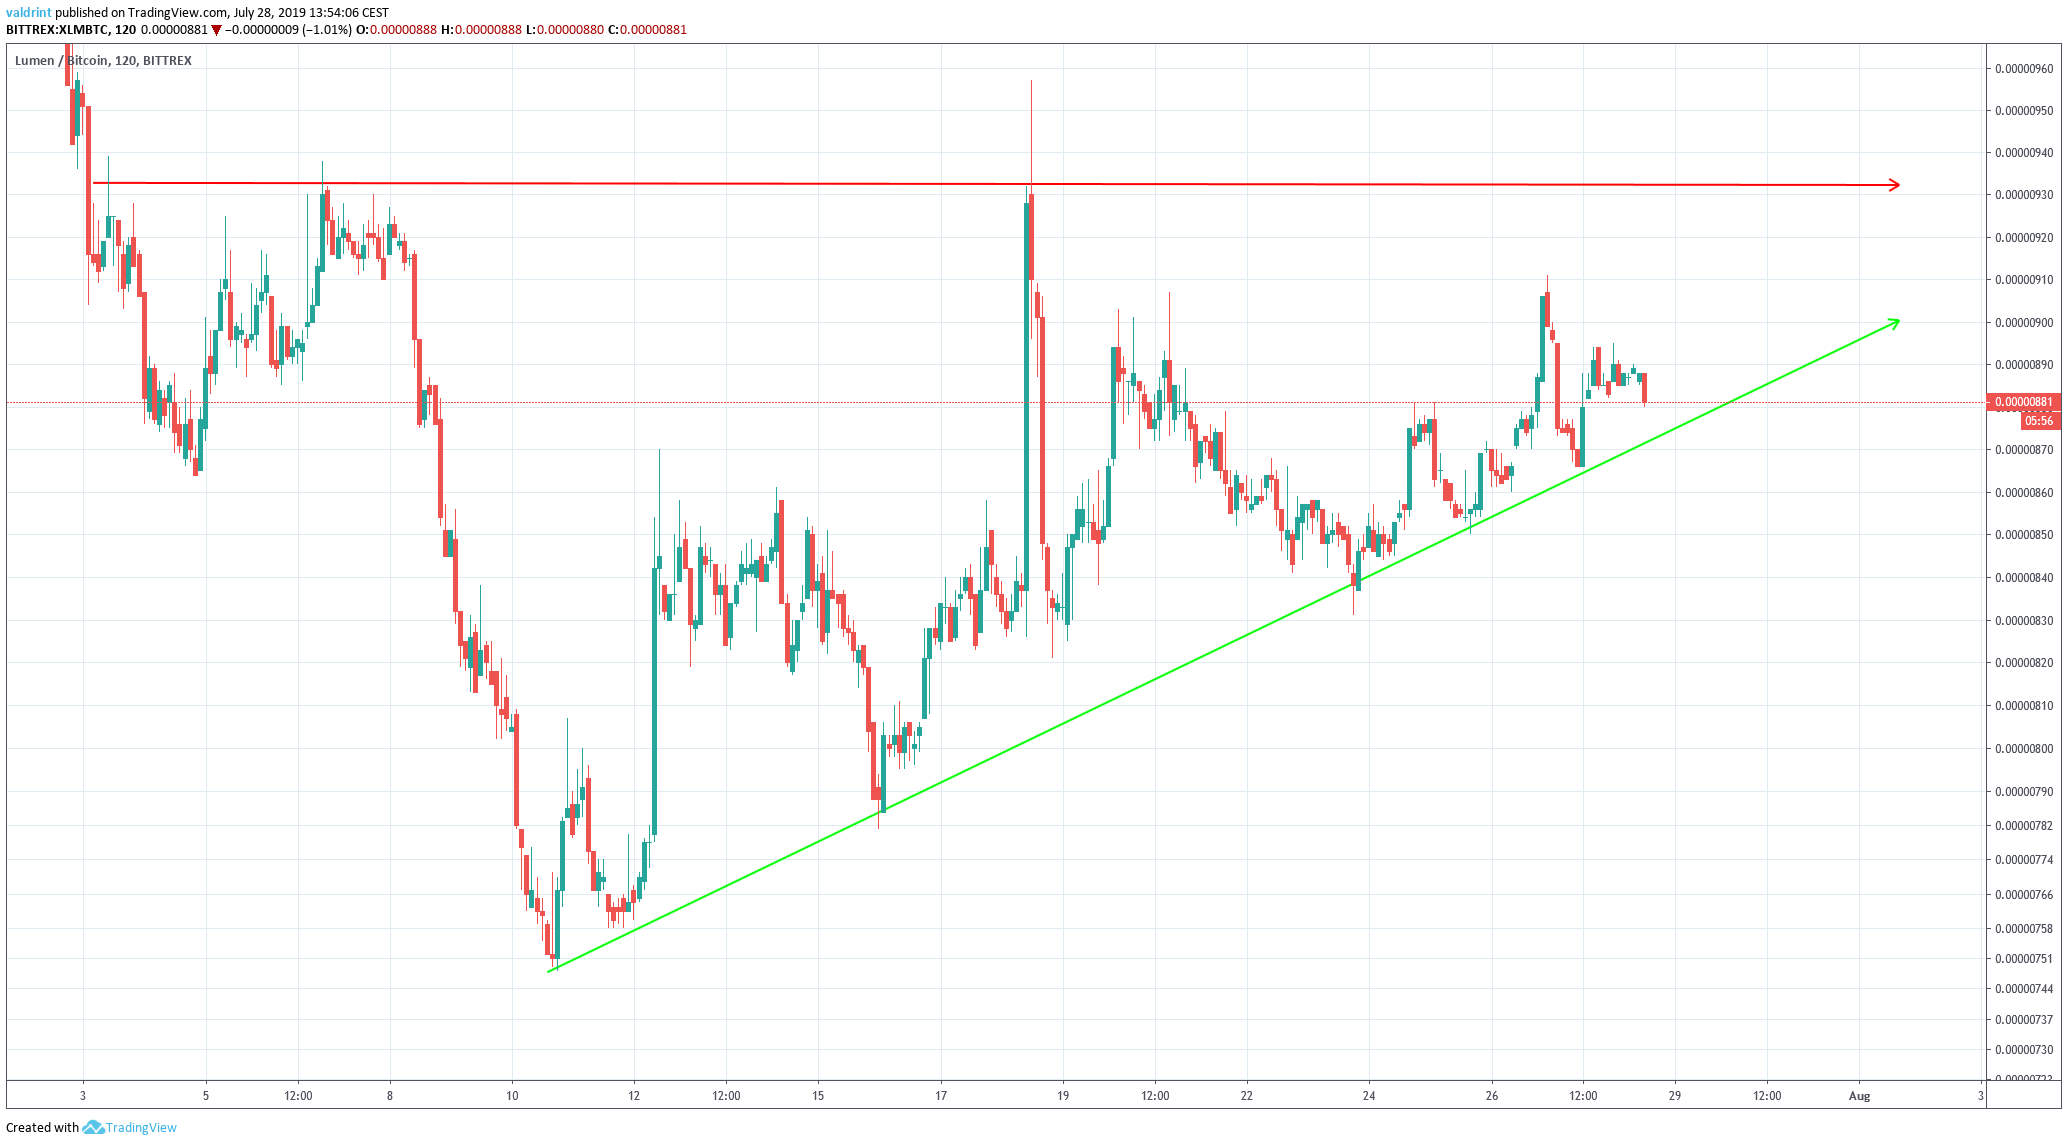
The resistance line of the triangle is currently at 930 satoshis.
The triangle is projected to end at the beginning of August.
Will XLM break out?
Let’s take a look at the longer-term to see if that is likely.
Descending Wedge
A look at the daily time-frame shows that the XLM price has been trading inside a descending wedge since February 11.
Similar to the ascending triangle, the descending wedge is considered a bullish pattern.
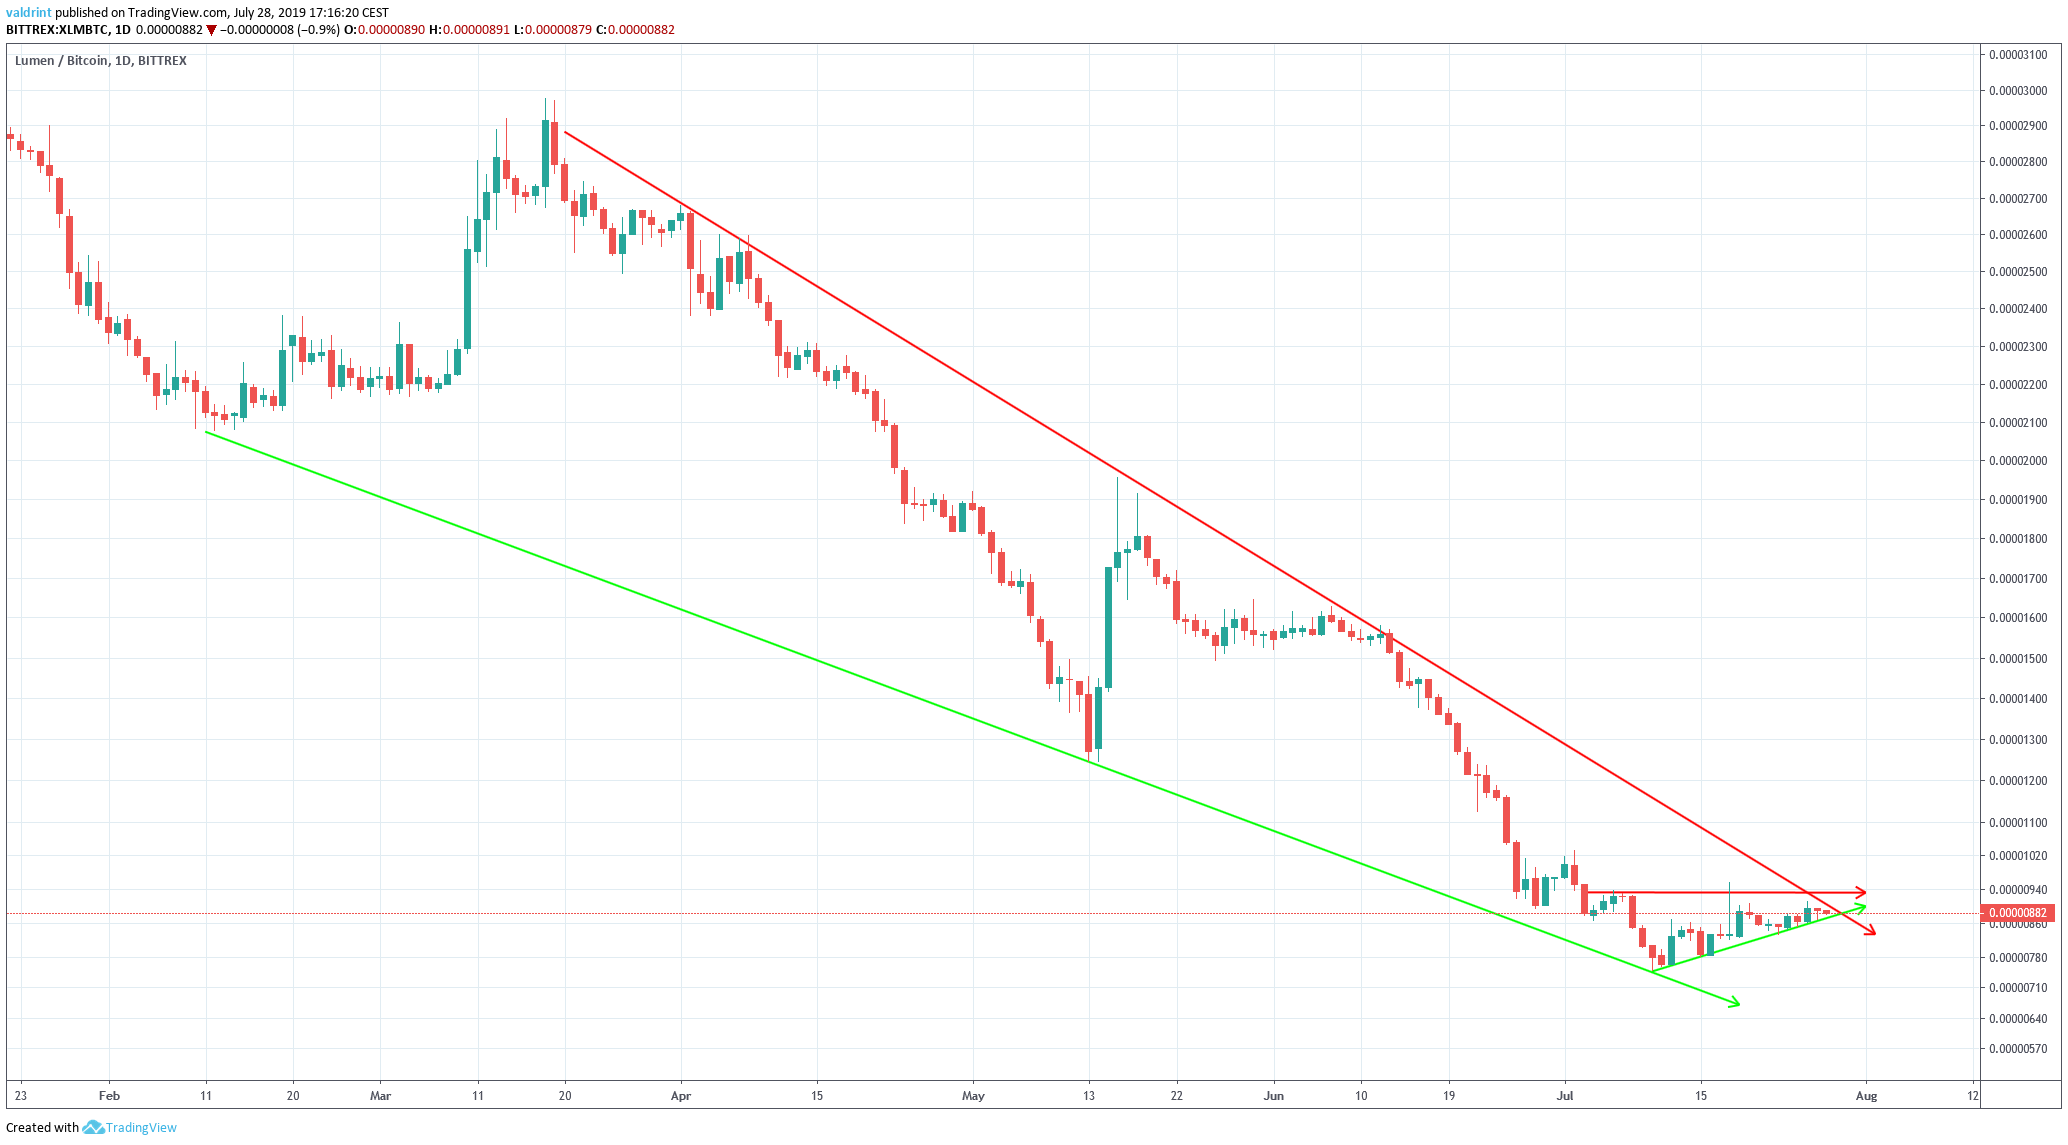
Due to the position of the triangle within the wedge, a breakout from the triangle would also indicate a breakout from the long-term wedge.
A look at the moving averages suggests that the price will soon do so.
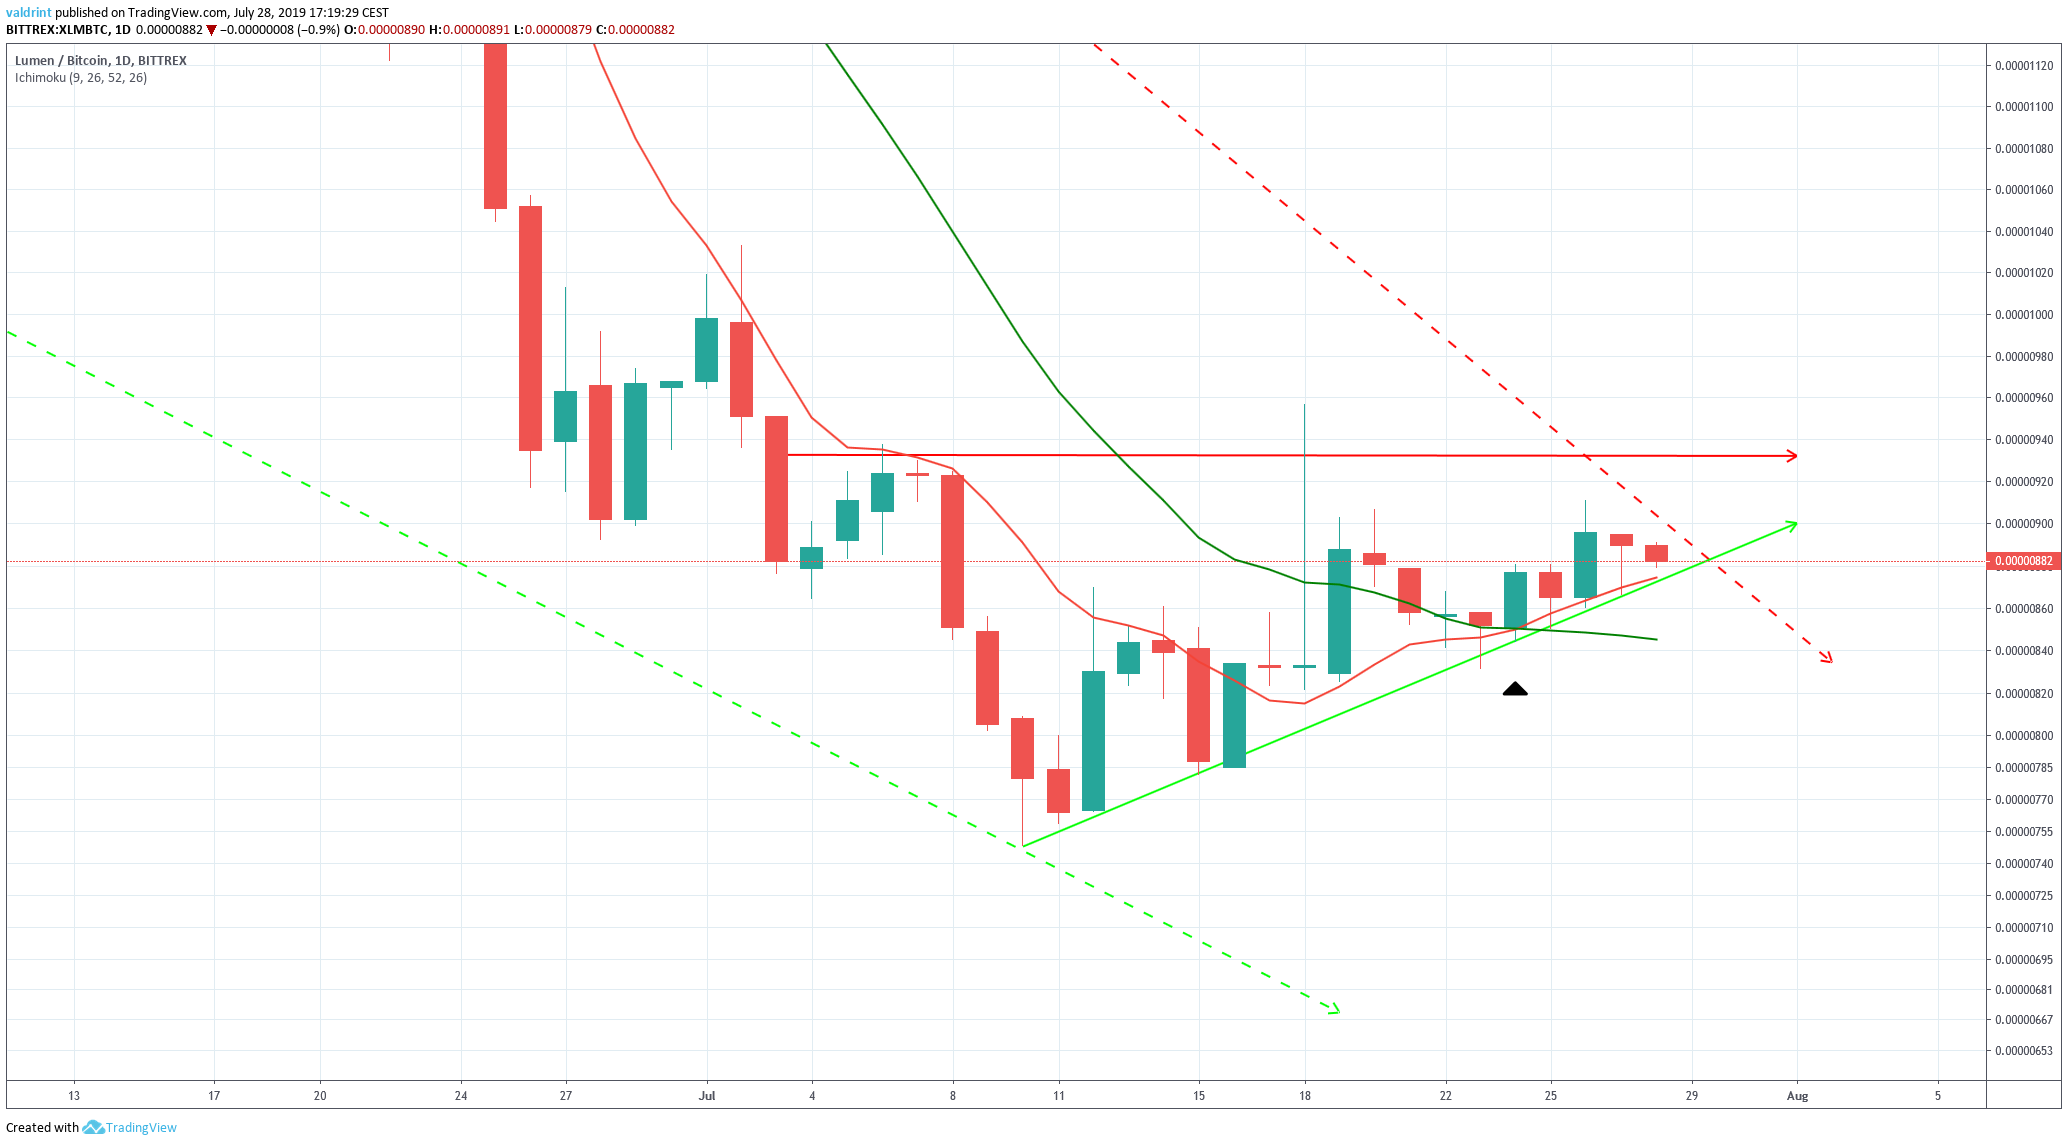
In last week’s analysis, we stated that
they (the MAs) are very close to making a bullish cross.
The cross will serve as confirmation that an uptrend has begun.
A bullish cross on July 25.
Since then, XLM has been trading above both MAs, using the 10-day one for support.
Our final bullish sign comes from the RSI & the MACD.
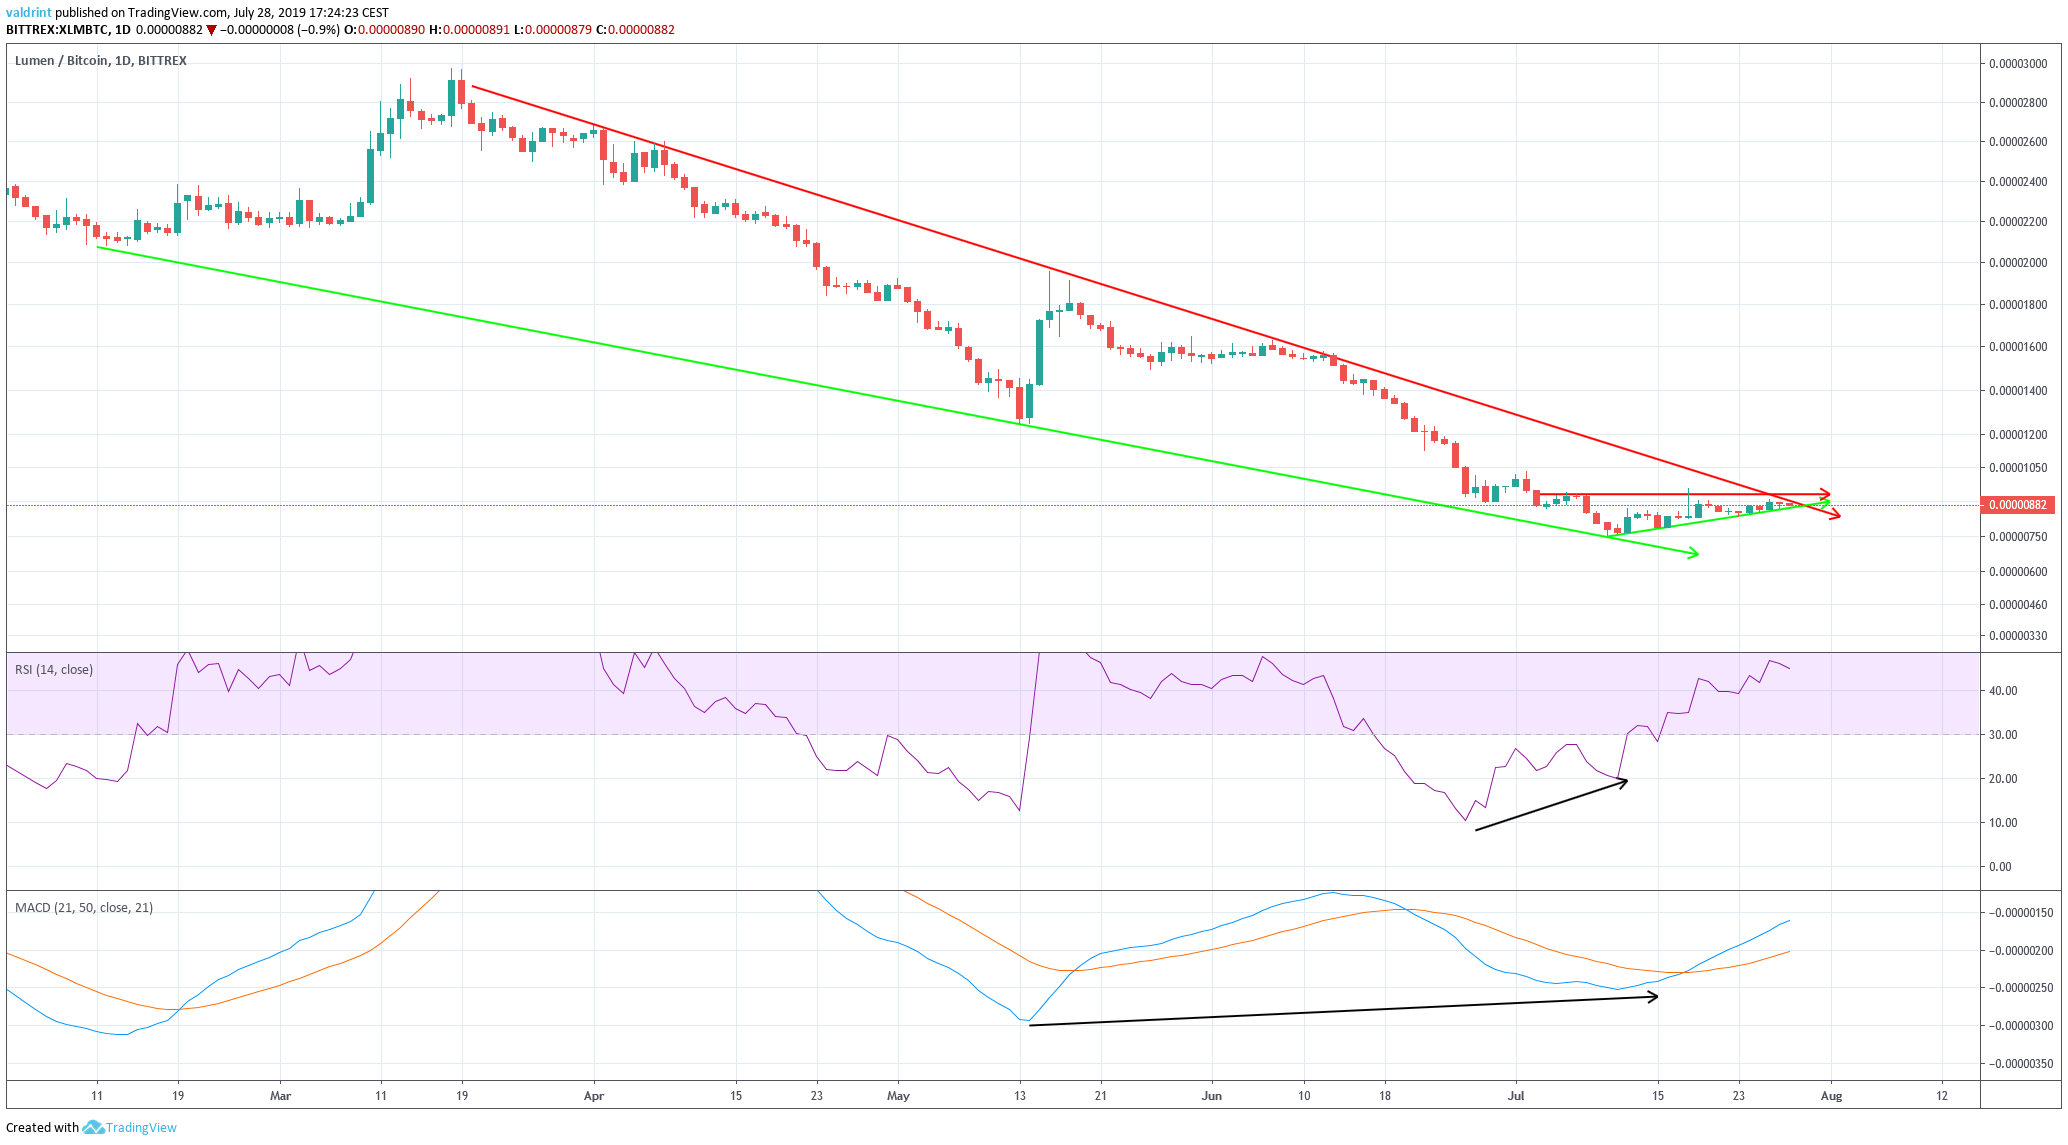
The MACD has been generating bullish divergence since May 10.
The RSI has done the same, albeit for a shorter period of time.
Therefore, all the indicators we have used to give bullish signals.
Furthermore, the price is trading inside both a short- and long-term bullish pattern.
This suggests that the potential for a breakout is exceptional.
Reversal Areas
In case that occurs, several resistance areas are outlined below.
They are found by using Fibonacci levels measuring from the high reached on March 19.
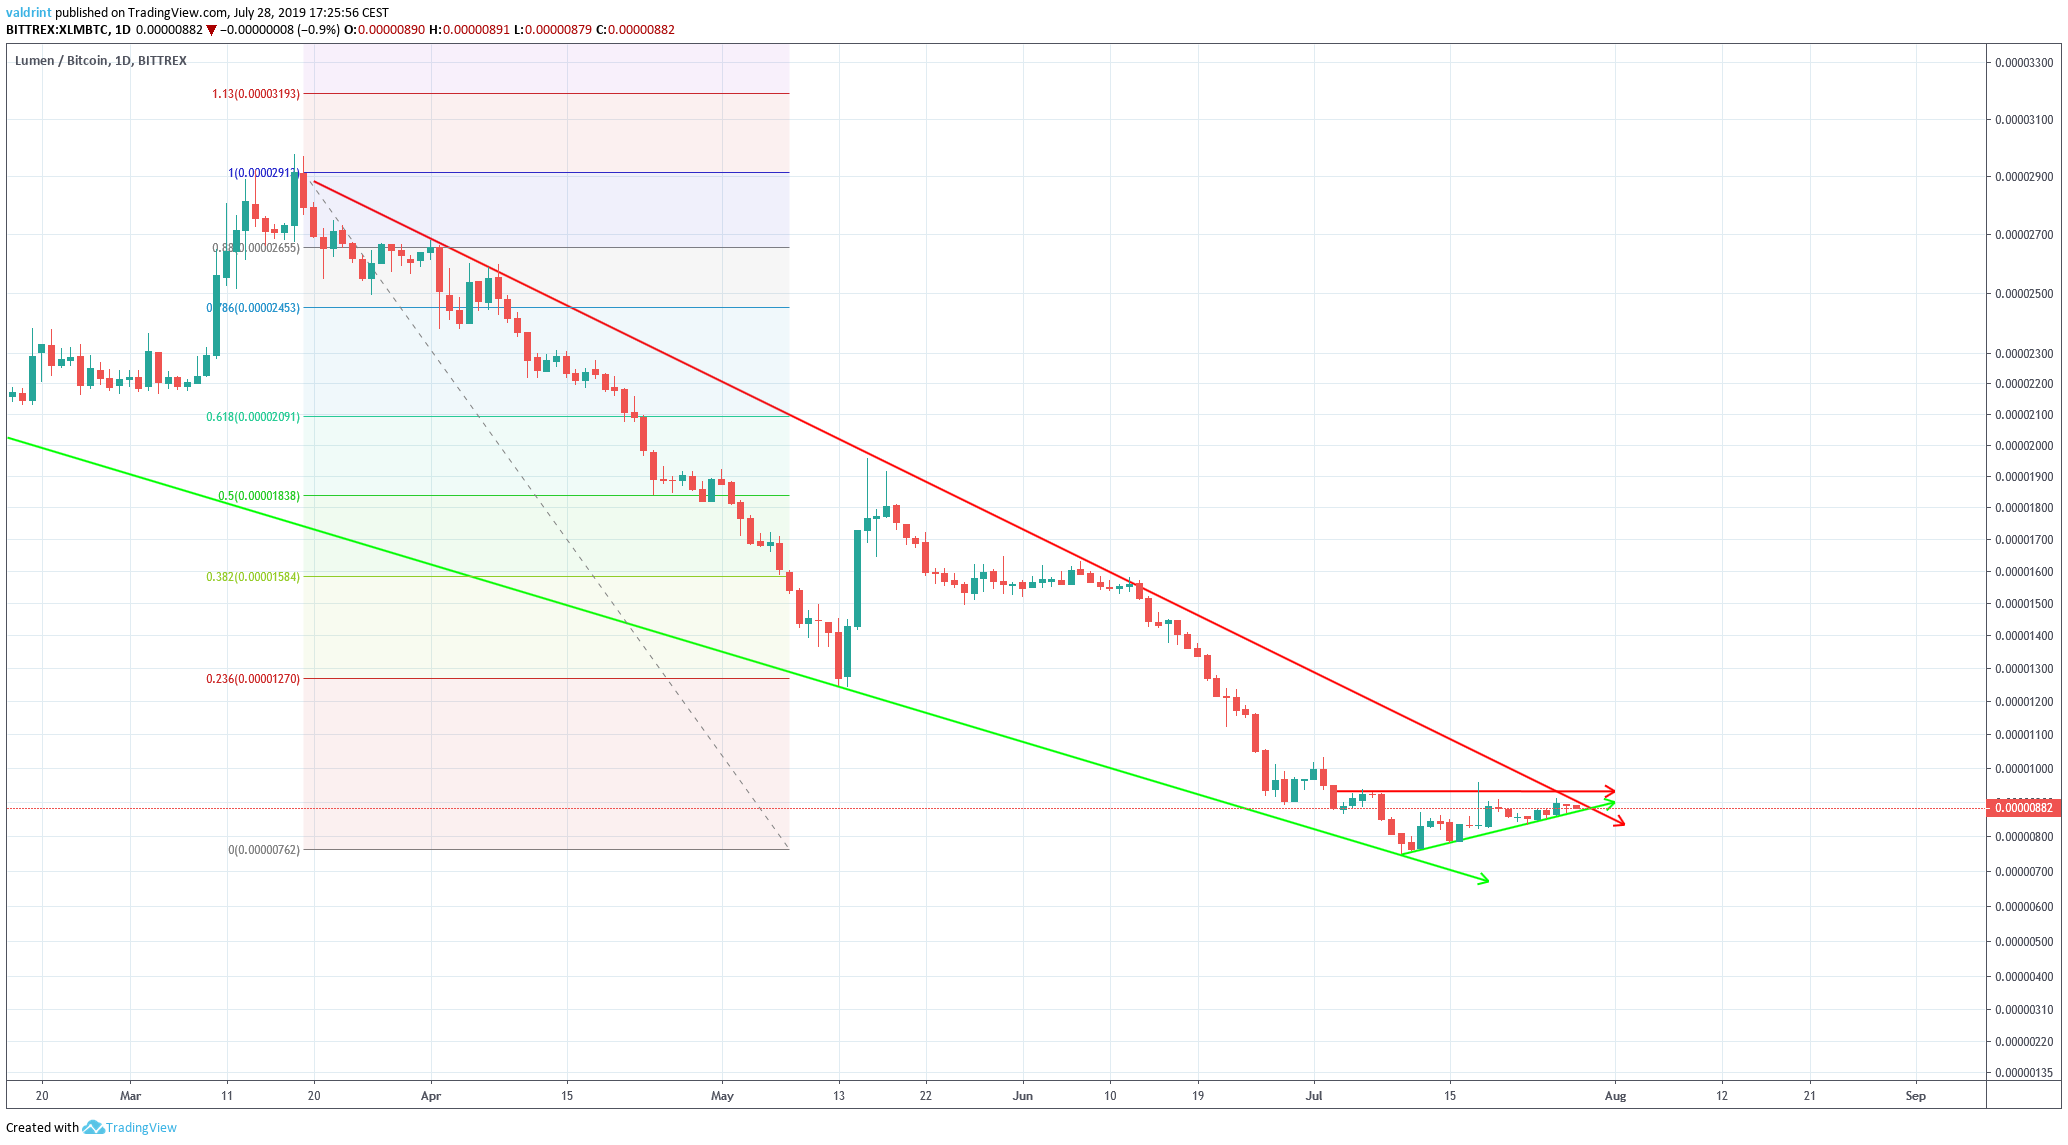
They are found at 2900, 1800 and 1300 satoshis.
The 1300 level marked a low for the month of May and initiated a significant upward move.
The 1800 level acted as resistance for the aforementioned move.
The 2900 level marked the beginning of the wedge.
According to our analysis, it is likely that the Stellar price will reach at least the first two resistance levels.
Summary
The XLM price is trading in bullish patterns in both the short- and long-term.
According to our analysis, it is on the verge of breaking out from both and reaching at least one of the resistance areas outlined below.
Do you think XLM will break out from the triangle and as a result the long-term wedge? Let us know in the comments below.
Disclaimer: This article is not trading advice and should not be construed as such. Always consult a trained financial professional before investing in cryptocurrencies, as the market is particularly volatile.
Images are courtesy of Shutterstock, TradingView.


