
On September 17, 2019, the Stellar price reached a low of 569 satoshis. It immediately began a rapid upward move which culminated with a high 898 satoshis on September 19. XLM has been decreasing since.
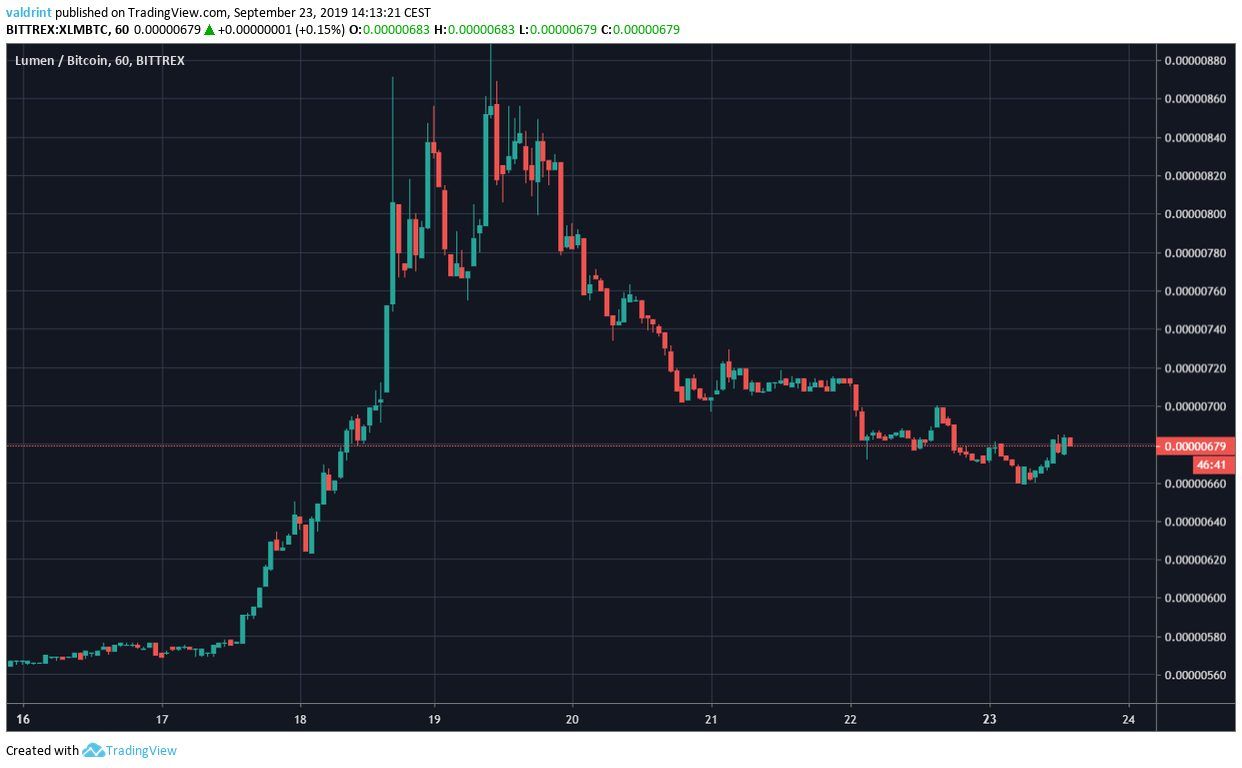
At the time of writing, the XLM price was trading close to 680 satoshis.
Where will it go next? Keep reading below if you want to find out.
For our previous analysis, click here.
Stellar Price: Trends and Highlights for September 23
- XLM/BTC broke out from a descending channel.
- The price is facing resistance from the 100-day moving average.
- It has found support above the 10- and 20-day moving averages.
- XLM is trading inside a short-term descending channel.
- There is short-term bullish divergence developing in the RSI & MACD.
- There is resistance at 760 satoshis.
Previous XLM PriceMovement
The XLM price has been trading inside a descending channel since July 2.
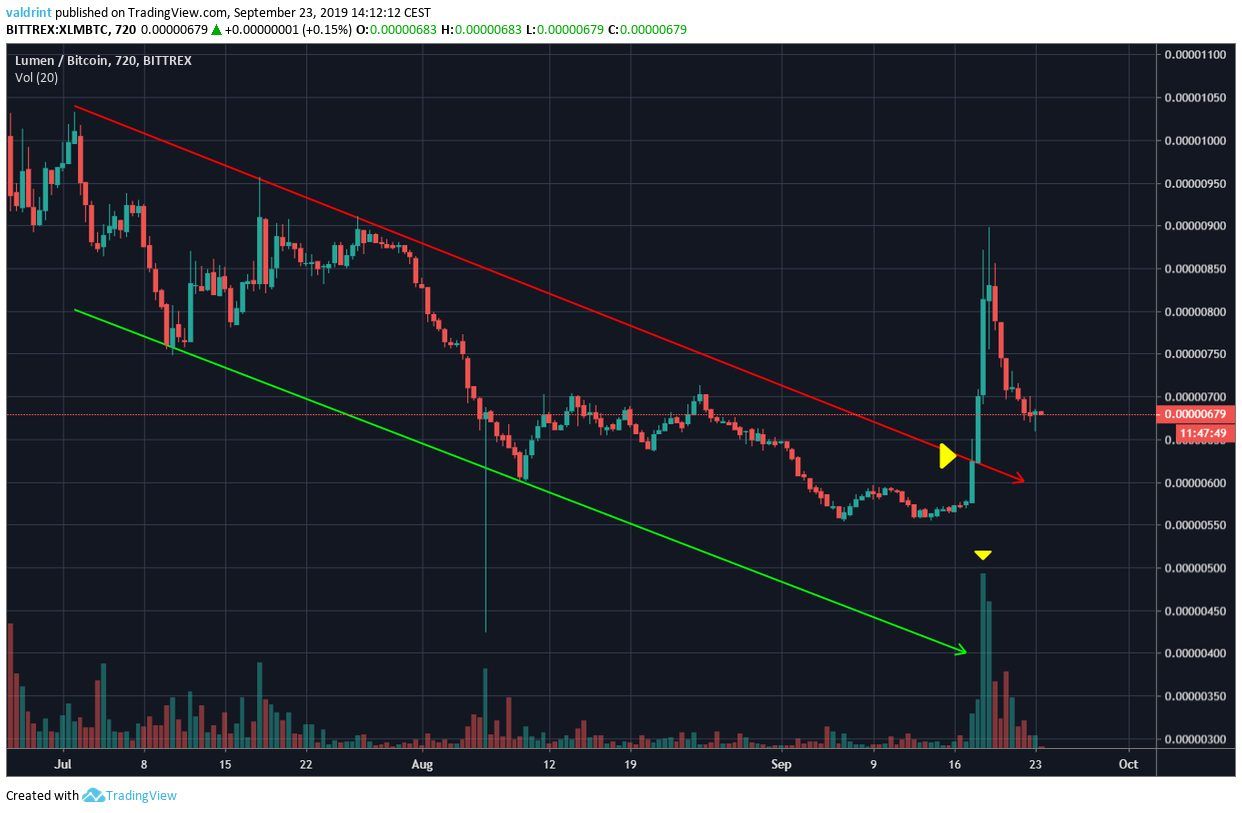
On September 18, XLM broke out from this channel.
The breakout occurred with very significant volume.
It reached a high of 898 satoshis before beginning a downward move.
Scope of Movement
In order to reduce the scope of possible price movements, we have incorporated the daily moving averages (MA) into the analysis.
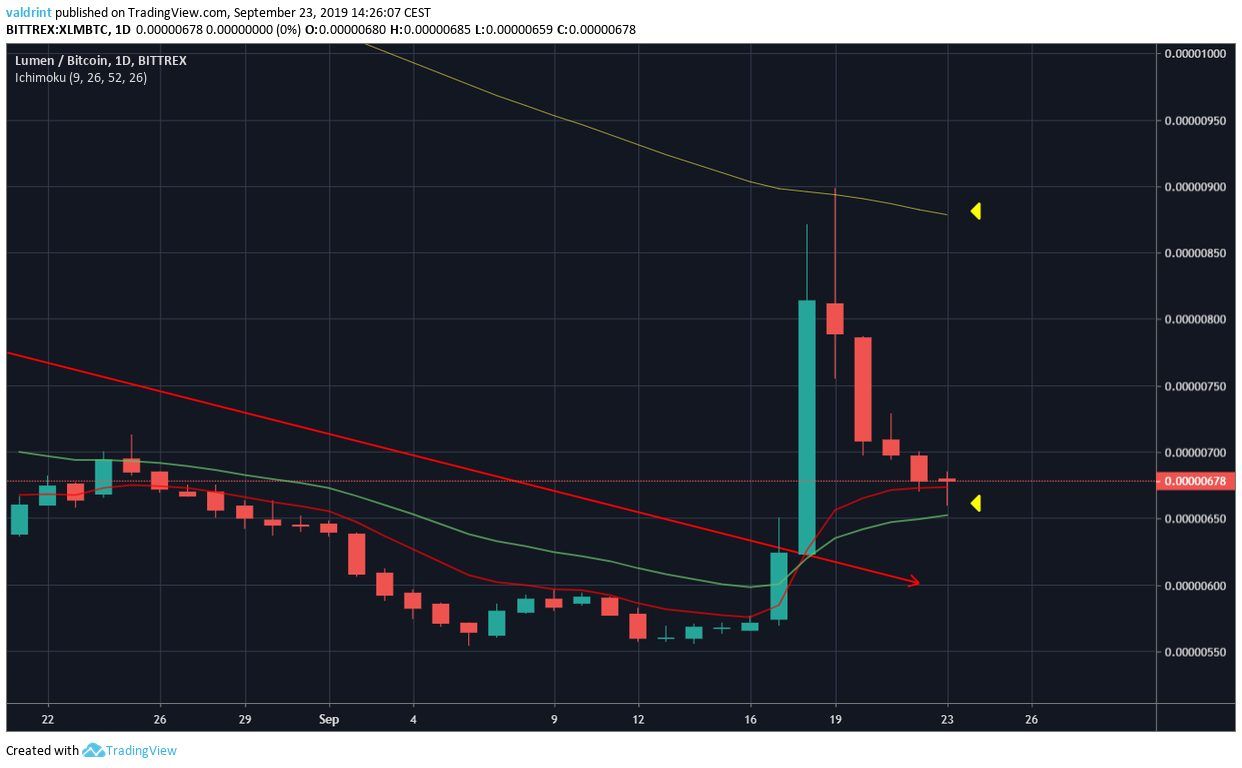
The upward move ended once the price reached the 100-day MA.
Afterward, it decreased until it reached the 10- and 20-day MAs.
This is a very likely place to initiate a reversal.
Let’s take a closer look at a shorter-term time-frame to see if that will occur.
Descending Channel
Looking at the hourly time-frame we can see that XLM has been trading inside a descending channel for the past three days.
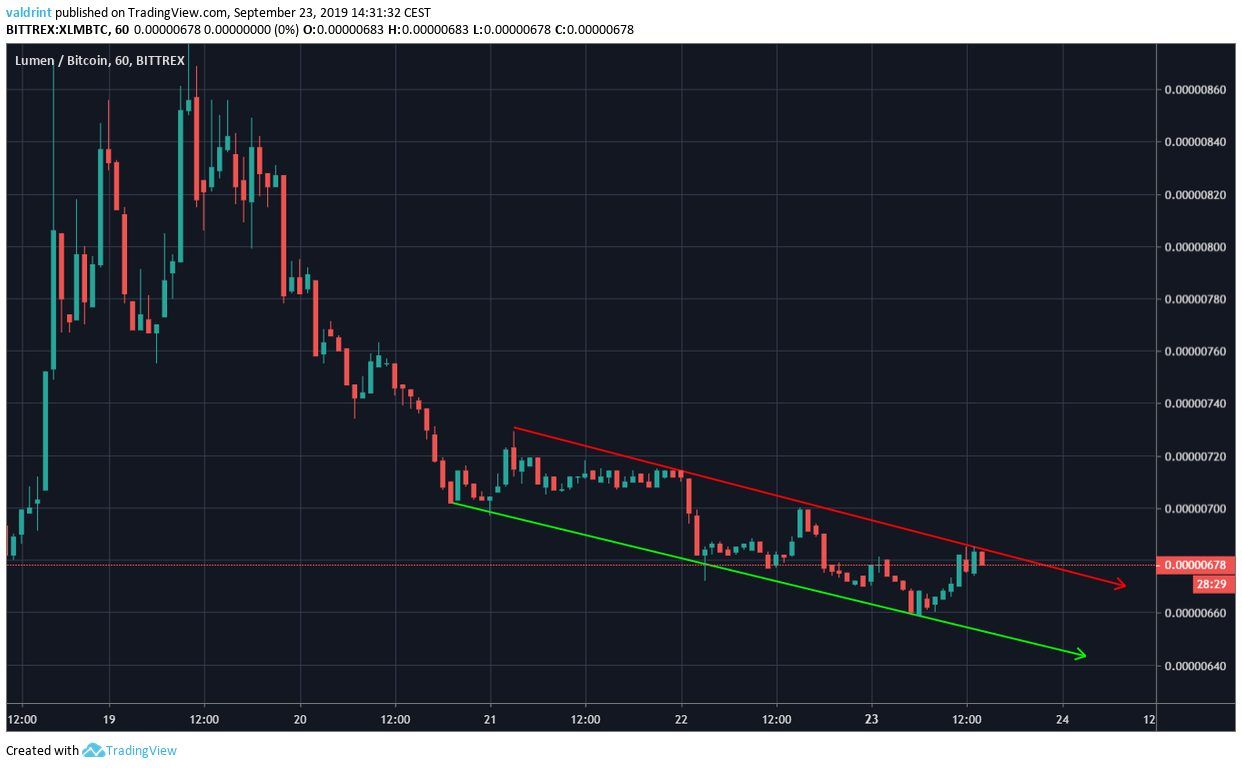
XLM has been gradually moving between the resistance and support lines.
Since the descending channel is a neutral pattern, both a breakout and breakdown are equally likely.
Future Movement
In order to predict the direction of the movement, we have incorporated the RSI and MACD into the analysis.
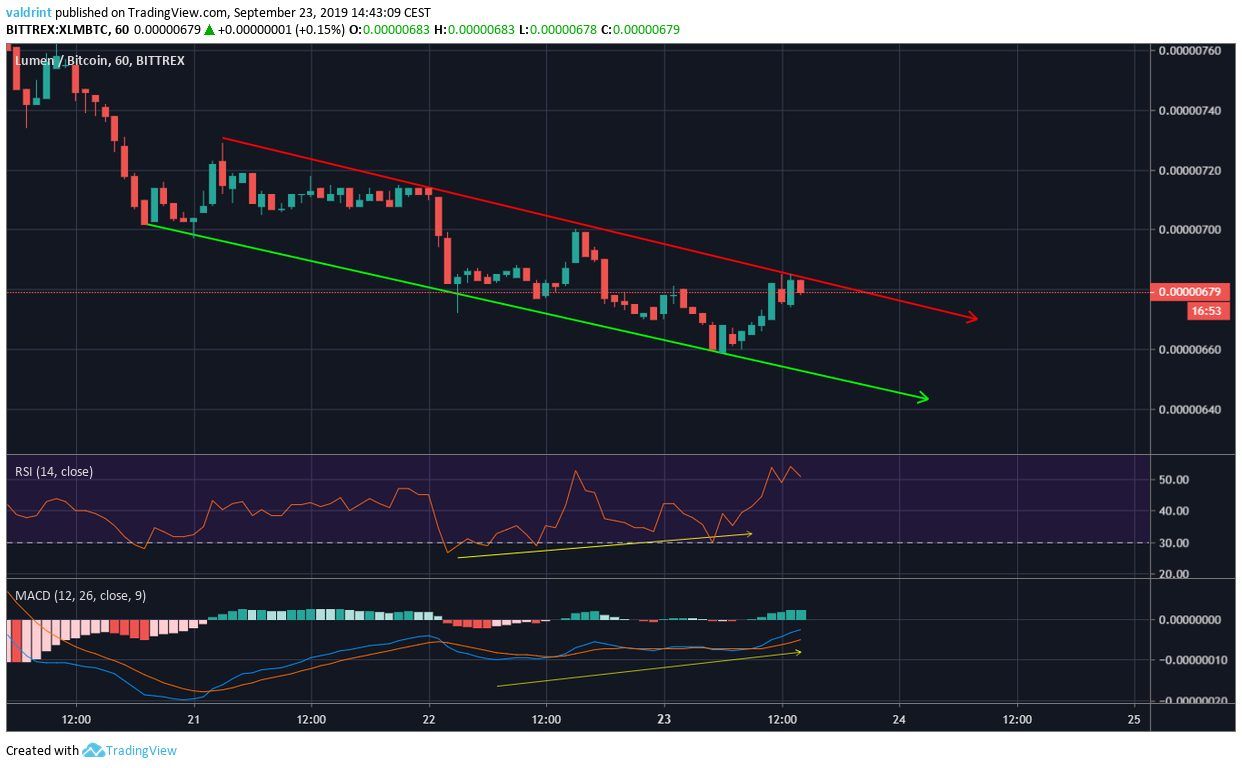
Both have been generating bullish divergence since September 22.
Combining this with the strong support offered by the daily MAs and the strength of the breakout makes us believe that XLM is almost finished retracing and is likely to breakout.
An outline of possible price movements along with one resistance area is given below.
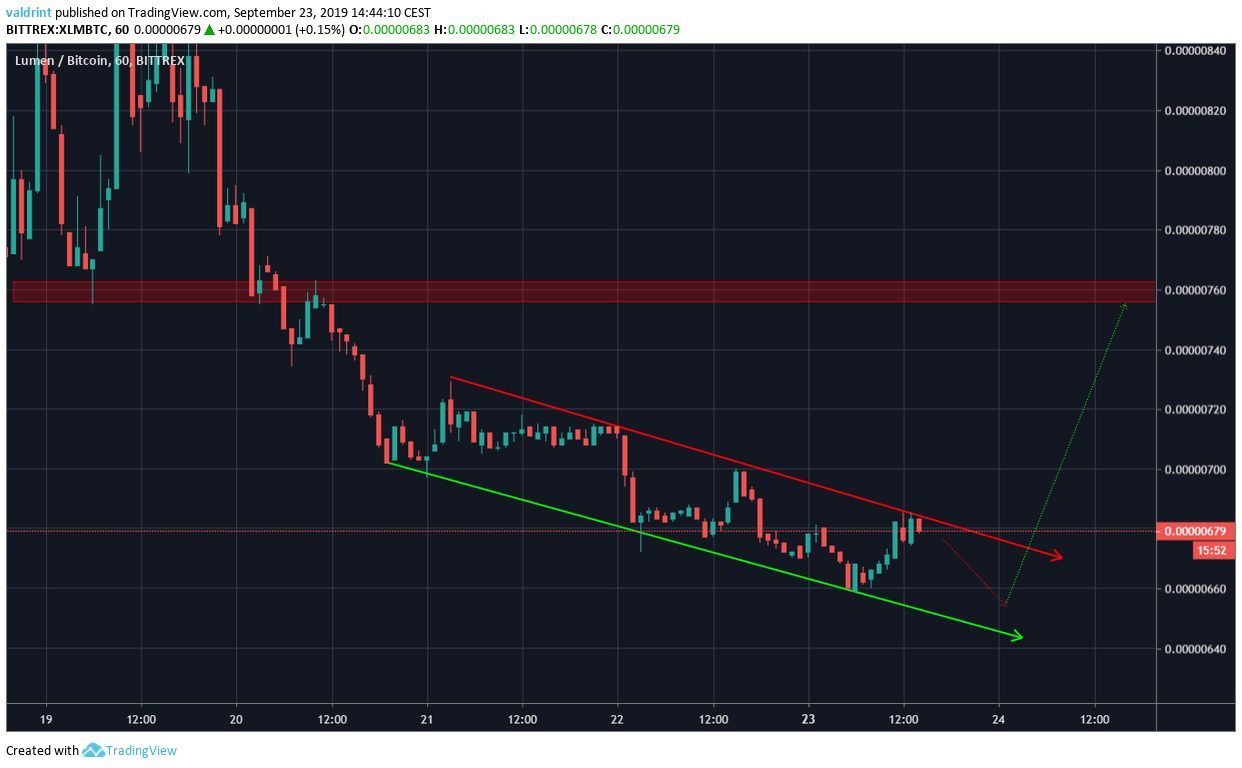
The resistance area is found at 760 satoshis.
We believe the XLM price will eventually break out from the channel and reach it.

Summary
The XLM price is trading inside a descending channel.
According to our analysis, it is likely to break out from the channel and reach the resistance area at 760 satoshis.
For hypothetical trading purposes, XLM is considered a buy near the current price of 670 satoshis.
Do you think XLM will break out from the triangle? Let us know in the comments below.
Disclaimer: This article is not trading advice and should not be construed as such. Always consult a trained financial professional before investing in cryptocurrencies, as the market is particularly volatile.
Images are courtesy of Shutterstock, TradingView.
