
On July 2, 2019, the Stellar price reached a high of 1030 satoshis. A rapid decrease ensued. By July 10, the XLM price had reached lows of 750 satoshis.
Since then, however, it has been increasing.
How long will this increase continue? Keep reading below in order to find out.
For our previous analysis, click here.
XLM Price: Trends and Highlights for July 15
- There is significant support near 700 and 350 satoshis.
- XLM/BTC is trading inside a descending wedge.
- A bullish divergence has been developing in the RSI and the MACD.
- XLM is trading inside a short-term horizontal channel.
XLM Price Support Levels
First, we will take a look at the weekly time-frame in order to determine possible support levels.
Two support areas are outlined below.
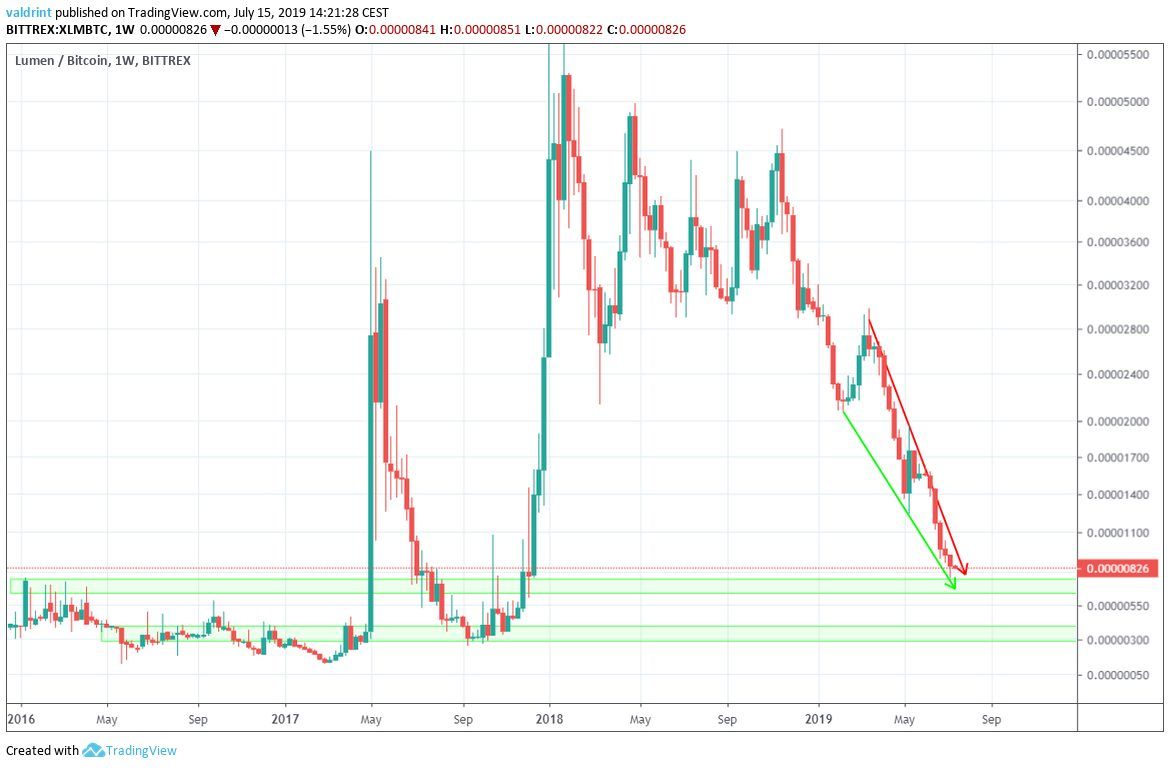
They are found at 700 and 350 satoshis.
At the time of writing, the XLM price was trading slightly above the first area.
Will it initiate a reversal?
Let’s take a closer look.
Descending Wedge
A look at the daily time-frame shows that the price has been trading inside a descending wedge since February 2019.
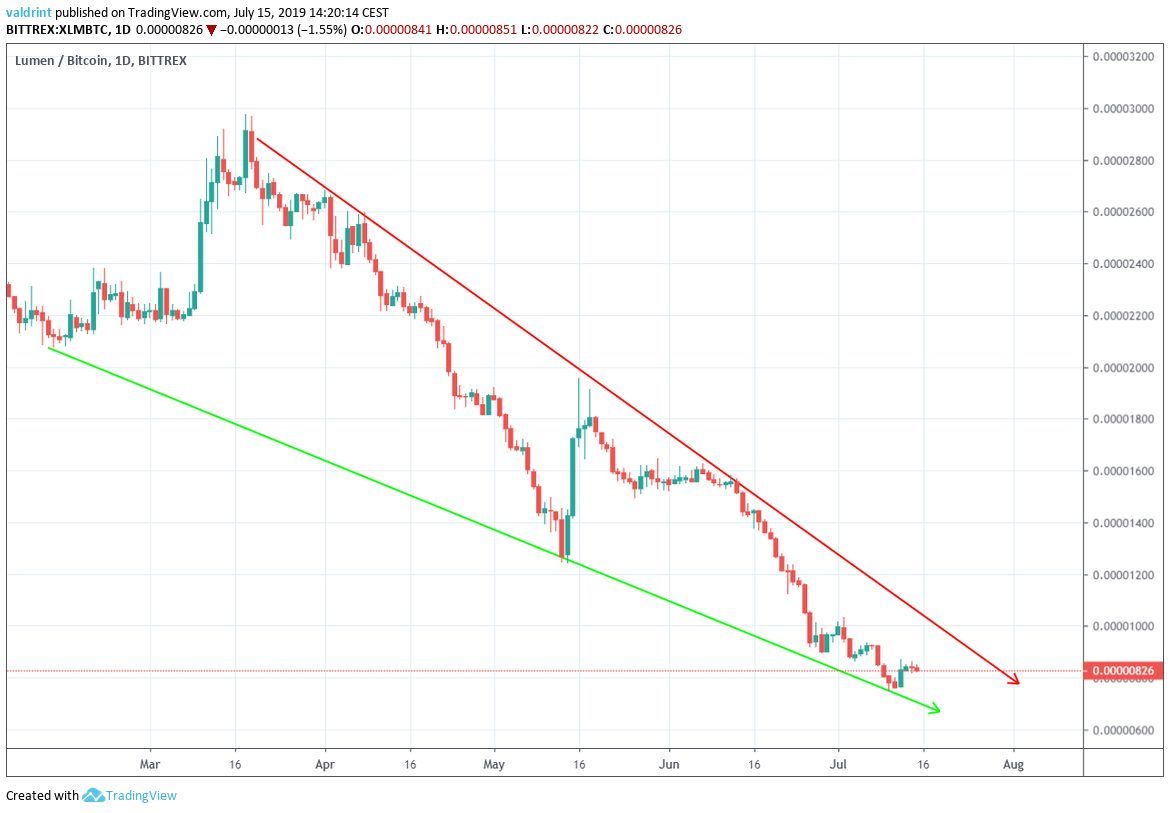
XLM is trading right on the support line of the wedge.
Furthermore, it is approaching the point of convergence between the resistance and support lines.
At that time, a decisive move should occur — either upward or downward.
Since the descending wedge is a bullish pattern, an upward breakout is more likely.
This view is also supported by an analysis of the RSI and the MACD.
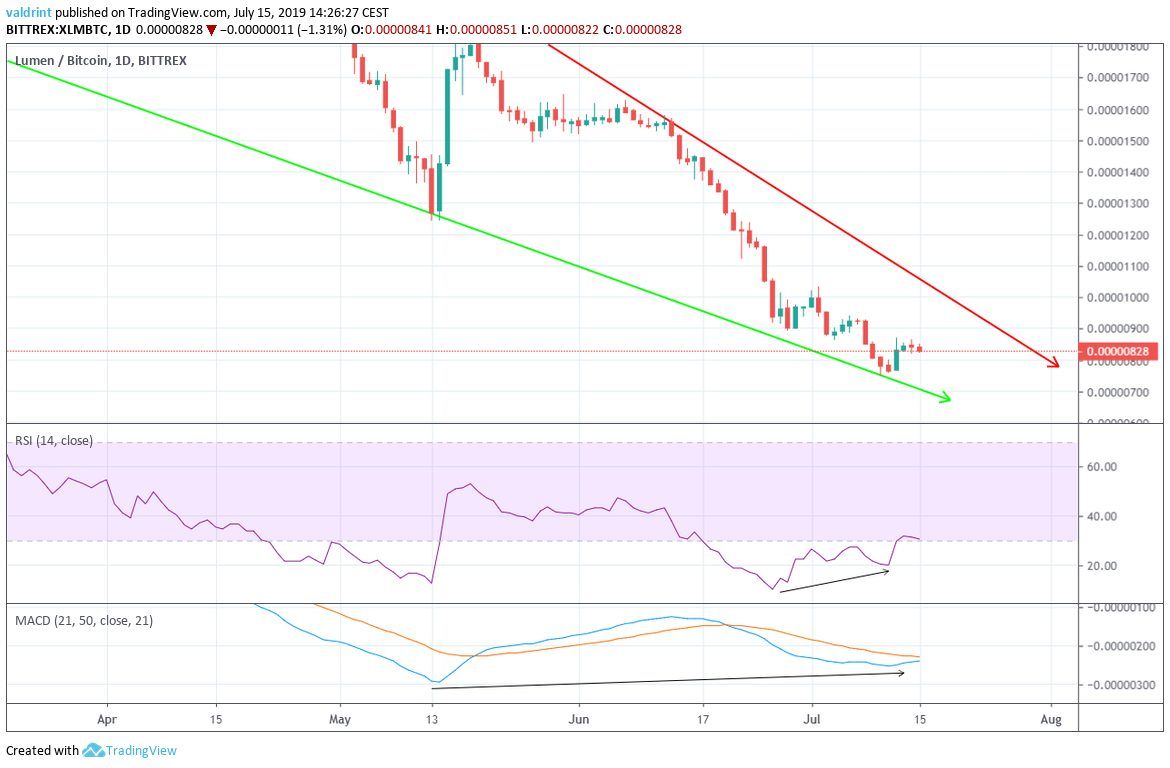
The RSI has been generating bullish divergence since June 25.
The MACD has been doing the same, albeit for a longer period of time; since May 13.
The divergence is very significant in value, occurring in long-term time-frames and is present in both indicators.
This makes it likely that the XLM price will eventually begin an upward move.
A look at the 10- and 20-day MAs shows that the price has made several attempts at beginning an upward move.
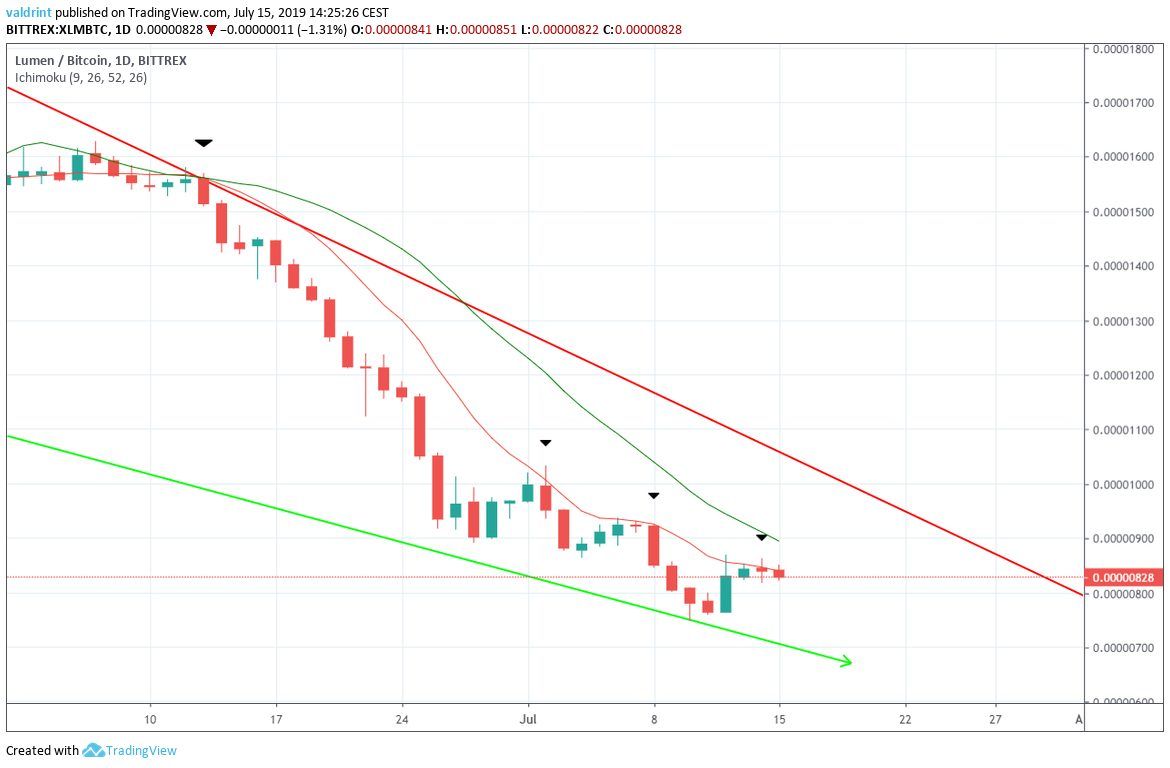
These movements have transpired on
- July 2
- July 8
- July 15
All three, however, have been unsuccessful. The XLM price found resistance at the 10-day MA before going down.
An analysis of technical indicators suggests that the price will soon initiate an upward move and break out from the wedge.
Short-Term
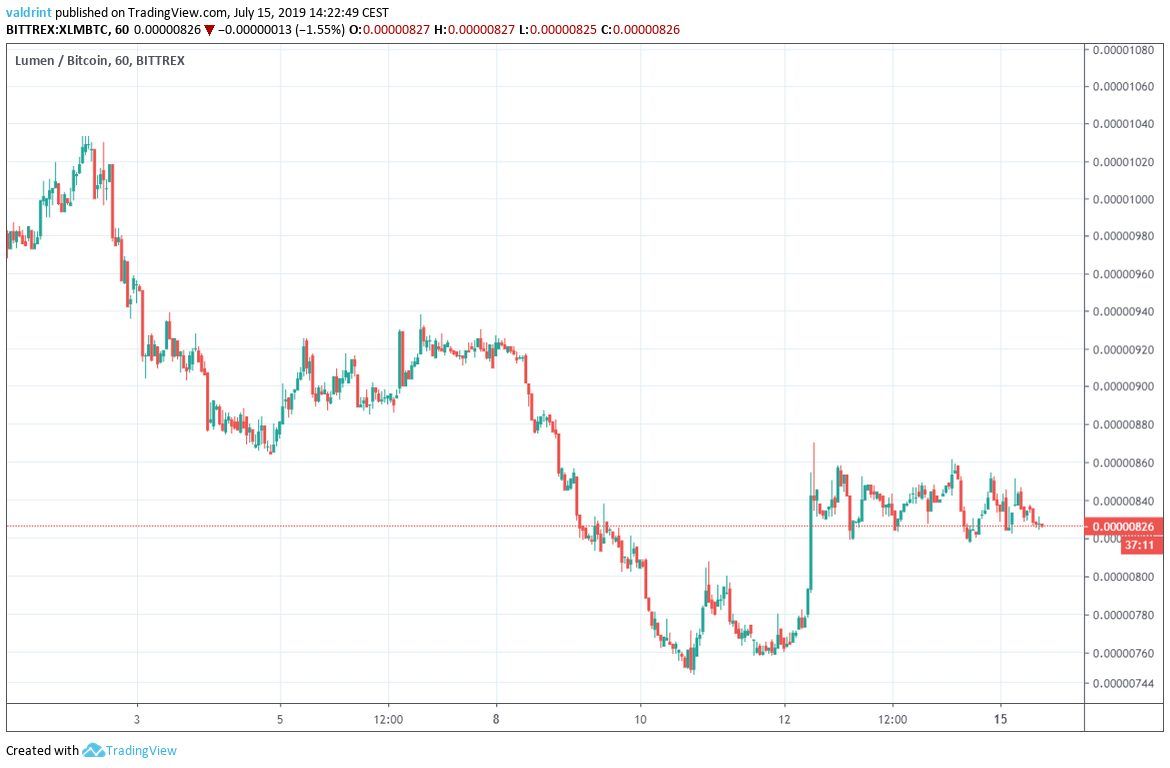
A look at the hourly time-frame shows that the XLM price has been trading inside the horizontal channel outlined below:
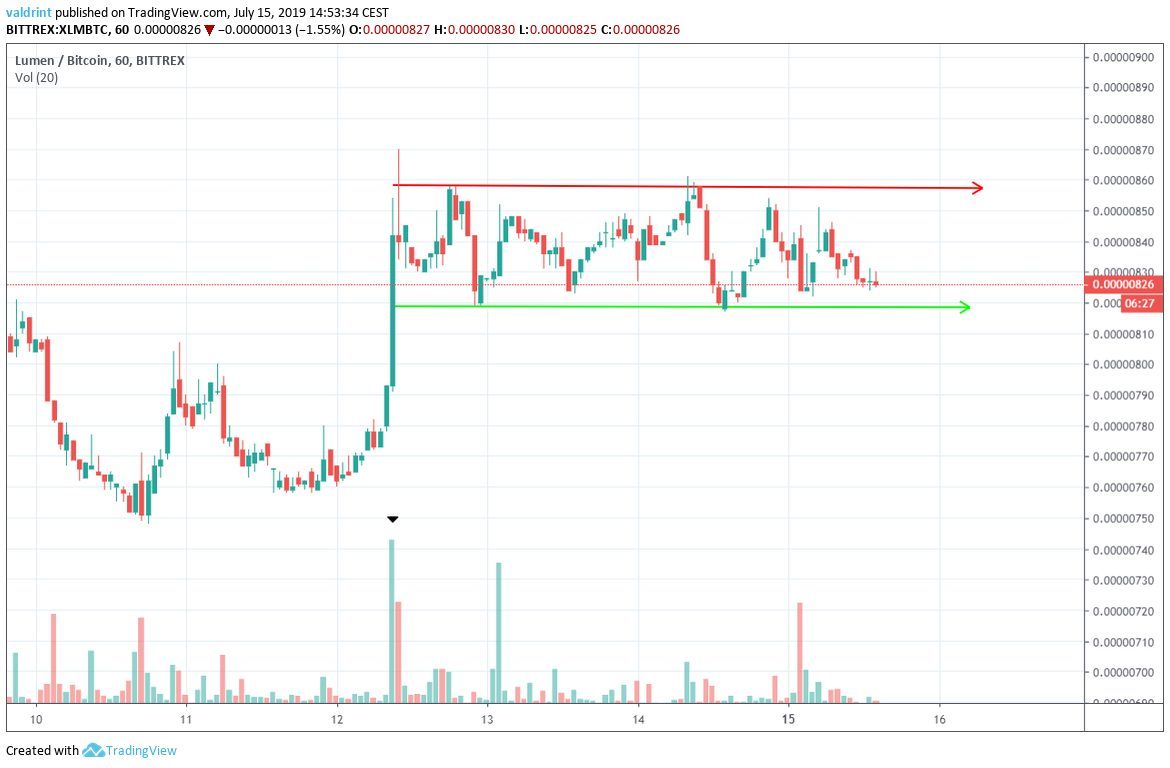
On July 12, XLM began an upward move which took it to a high of 870 satoshis.
This move transpired with very significant volume.
Afterward, the price has been trading sideways, creating a horizontal channel.
Combined with the previous section, it is likely that the future price movement will consist of a breakout from the channel and increase towards the resistance line of the wedge.
Summary
The XLM price has been trading inside a descending wedge.
An analysis of technical indicators supports a breakout from this wedge.
Do you think the XLM price will break out from the wedge? Let us know in the comments below.
Disclaimer: This article is not trading advice and should not be construed as such. Always consult a trained financial professional before investing in cryptocurrencies, as the market is particularly volatile.
Images are courtesy of Shutterstock, TradingView.
