
What’s going on with the price of Stellar lumens and XRP lately?
In this article, we examine the current long-term and short-term trading patterns of Stellar lumens (XLM) and Ripple’s XRP (XRP). Then, we compare the technical indicators of both to generate possible trade setups for both. Lastly, the major findings of our analysis are summarized in the conclusion where the winner of this analysis is selected based on future price potential.
Two Descending Channels
Since the beginning of May, both XLM/USD and XRP/USD have been trading within a descending channel.
On Apr 3, the price of XLM reached lows and highs of $0.100 and $0.109 respectively. It has been trading inside a descending channel since.
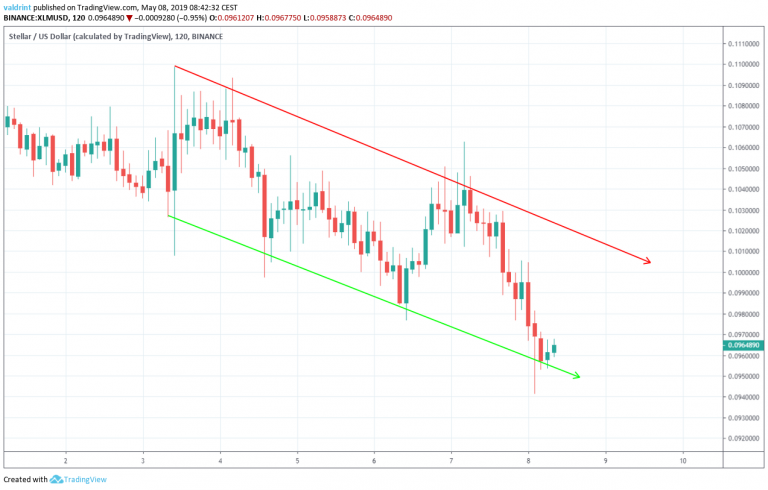
In the graph above, we can see that XLM/USD reached highs over $0.109 on May 3. Tracing from the first and highest high generates the resistance line the current trading pattern.
Similarly, the support line emerged around the same time on Mar 3. It began at slightly $0.101 and has been decreasing since.
At the time of writing, the price was trading near the support line of the channel and appeared poised for possible upward movement within the channel.
Similarly, the price of XRP/USD has been trading within a descending channel since Apr 30:
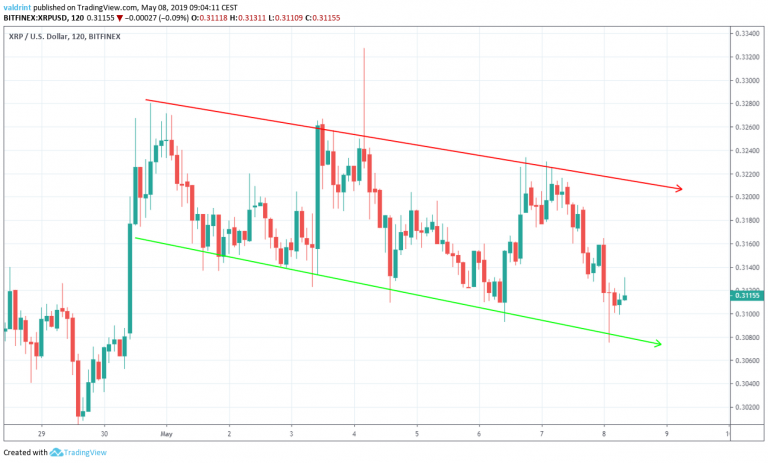
The support line of the channel begins at $0.318 while the resistance line begins at $0.328. As seen in the graph above, the rate of descent has been greater for XLM than XRP.
Where XRP can be seen to have lost around 5% of its value this month, XLM has lost closer to 13% at the time of writing.
Lumens in a Descending Wedge
On Mar 26, the price of lumens reached a low of $0.08. A rapid upward move was followed by a gradual decrease.
As seen int eh graph below, XLM/USD has been trading inside a descending wedge since Apr 18. The support line of the wedge, however, emerged about a month earlier.
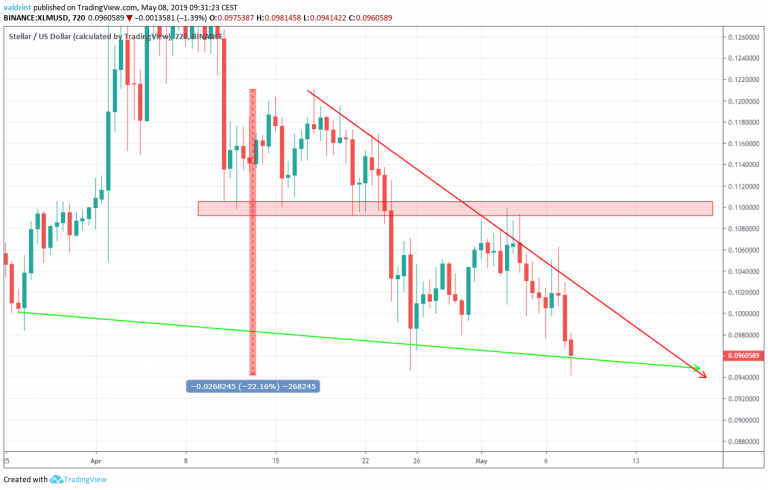
Currently, the price is trading very close to the support line of the wedge.
Since the wedge formed on Apr 18, the price of lumens has dropped by 22%.
However, the descending wedge is a bullish pattern. Price increase toward the resistance line in the near future. It might also break out of the wedge and head toward the resistance area traced around $0.11.
What About a Breakout?
To better assess the possibility of a breakout, the price of XLM/USD is analyzed at 12-hour intervals alongside the RSI and the MACD below:
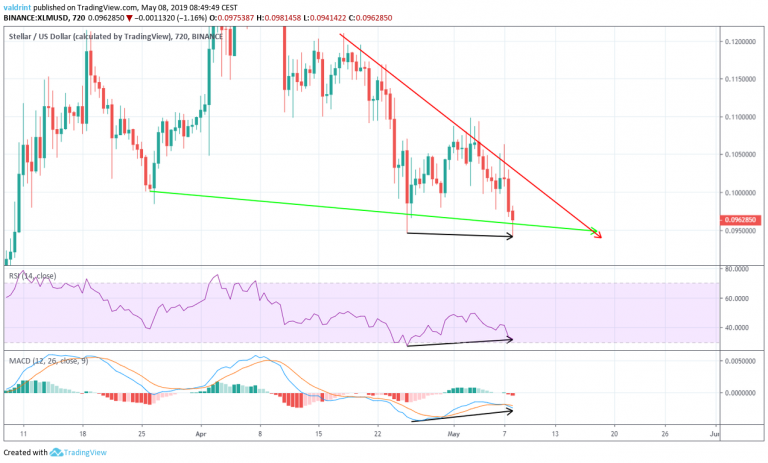
On Apr 25 the price reached a low of $0.094. It reached a slightly lower low on May 7.
Similarly, the RSI and the MACD made a low on Apr 25. However, they have continued to generate higher values since.
This is known as bullish divergence and often precedes price increases.
The use of these indicators makes it likely that the price will break out from the wedge and reach the resistance area.
Let’s examine a possible trade setup.
Long Trade Setup
Since the price is currently trading close to the support line of the wedge, we are going to analyze two possible trade setups with an average entry of $0.096.
The stop-loss order is placed at $0.093, slightly below the lows experienced on Apr 27 and on May 5. This is a stop loss of roughly 2.5%.
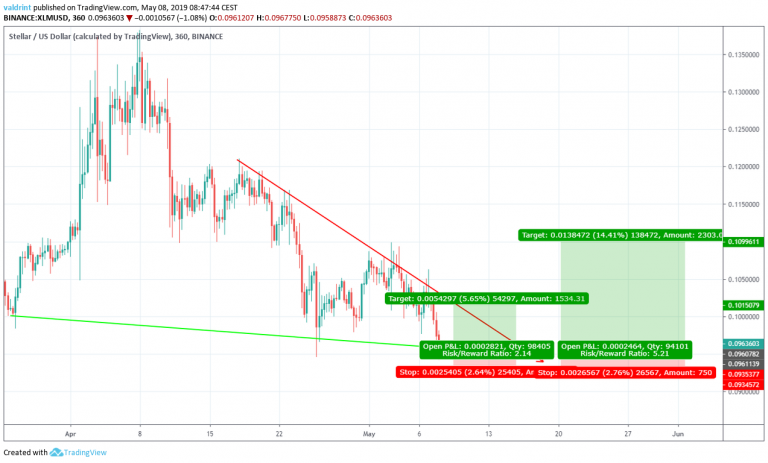
Our first target would be at $0.101. This is close to the resistance line of the wedge. Combined with the stop presented earlier this would present a 2.14:1 risk to reward ratio.
A breakout is not needed to reach the target. On the contrary, we would need only an increase towards the resistance line.
The second target would be $0.11. Combined with our stop loss, this would present a 5.2:1 risk to reward ratio. The target is created by the resistance area outlined in the previous section.
A breakout from the wedge would be required in order for the price to reach the target. Based on our analysis of technical indicators, this is likely.
Now, let’s take a look at XRP.
XRP on Another Descent
Since reaching highs of $0.382 on Apr 5, the price of XRP has been trading inside a descending channel. While trading inside the channel, the price has lost 26% of its value reaching lows of $0.282 on Apr 25.
The price broke out from the descending channel on Apr 30. and price been trading sideways since.
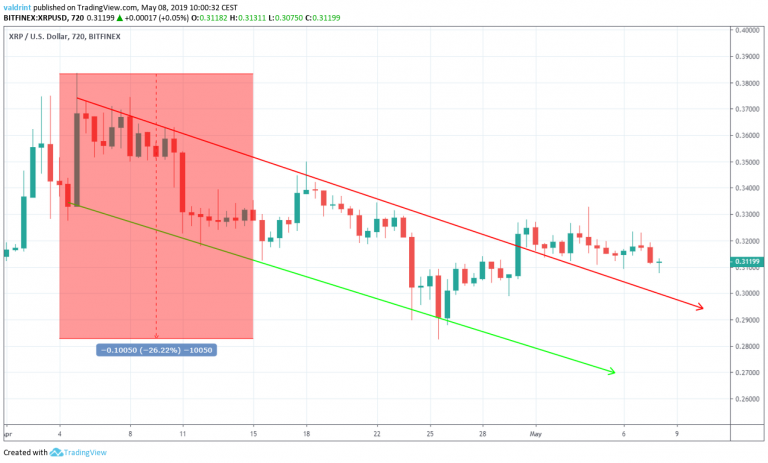
This may have been a false breakdown in which case XRP would be expected to fall back toward the resistance line and possibly reenter the channel.
However, a valid breakout could indicate that a new trading pattern has formed.
To assess the validity of the breakdown the price of XRP is analyzed at daily intervals alongside volume and the 50- and 100-day moving averages (MA) below:
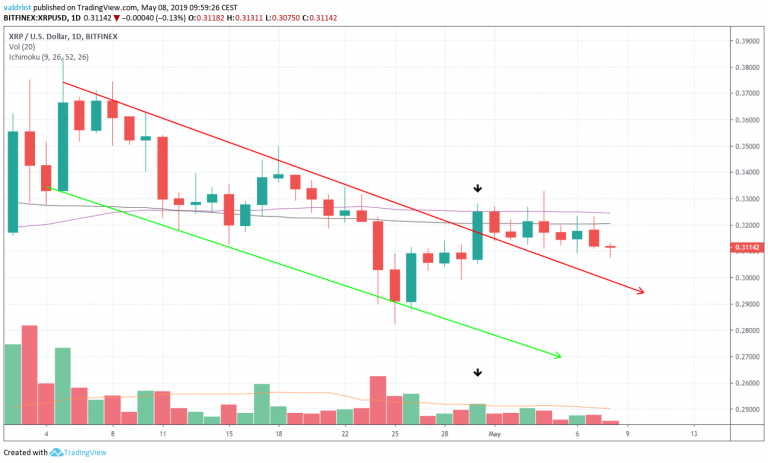
We can see that the breakout occurred on average volume. Furthermore, the price made several unsuccessful attempts at moving above the 50- and 100-day moving averages.
This indicates that the price likely does not have enough power to move above the resistance. Price decreases are likely. We may soon see XRP drop toward resistance and possibly reenter the descending channel.
We do not see any current trade setups that offers an acceptable risk to reward ratio.
Conclusion
To conclude, both XLM and XRP are trading inside decreasing short-term patterns. However, their long-term prospects are different. The price of XLM is trading inside a descending wedge and has developed significant bullish divergence. This allowed us to create a long trade setup.
On the other hand, the price of XRP recently made a weak breakout and an unsuccessful attempt at moving above the moving averages. In addition, there is no visible trade setup for XRP.
Therefore, we believe that XLM faces better prospects in the future.
A summary is presented in the table below:
XRP
XLM
WINNER
Short-term Pattern
Slowly decreasing descending channel
Rapidly decreasing descending channel
XRP
Patterns & Indicators
Weak breakout from a descending channel
Bullish divergence developing inside a descending wedge
XLM
Do you think the price of Stellar lumens will be able to break out and reach the resistance area? Can XRP defy the odds and break free of its downward trend?
Disclaimer: This article is not trading advice and should not be construed as such. Always consult a trained financial professional before investing in cryptocurrencies, as the market is particularly volatile.
