Steem (STEEM) and OmiseGO (OMG) are both correcting inside reversal patterns, a breakout from which would indicate that they’re ready to resume their previous upward trend.
Steem (STEEM)
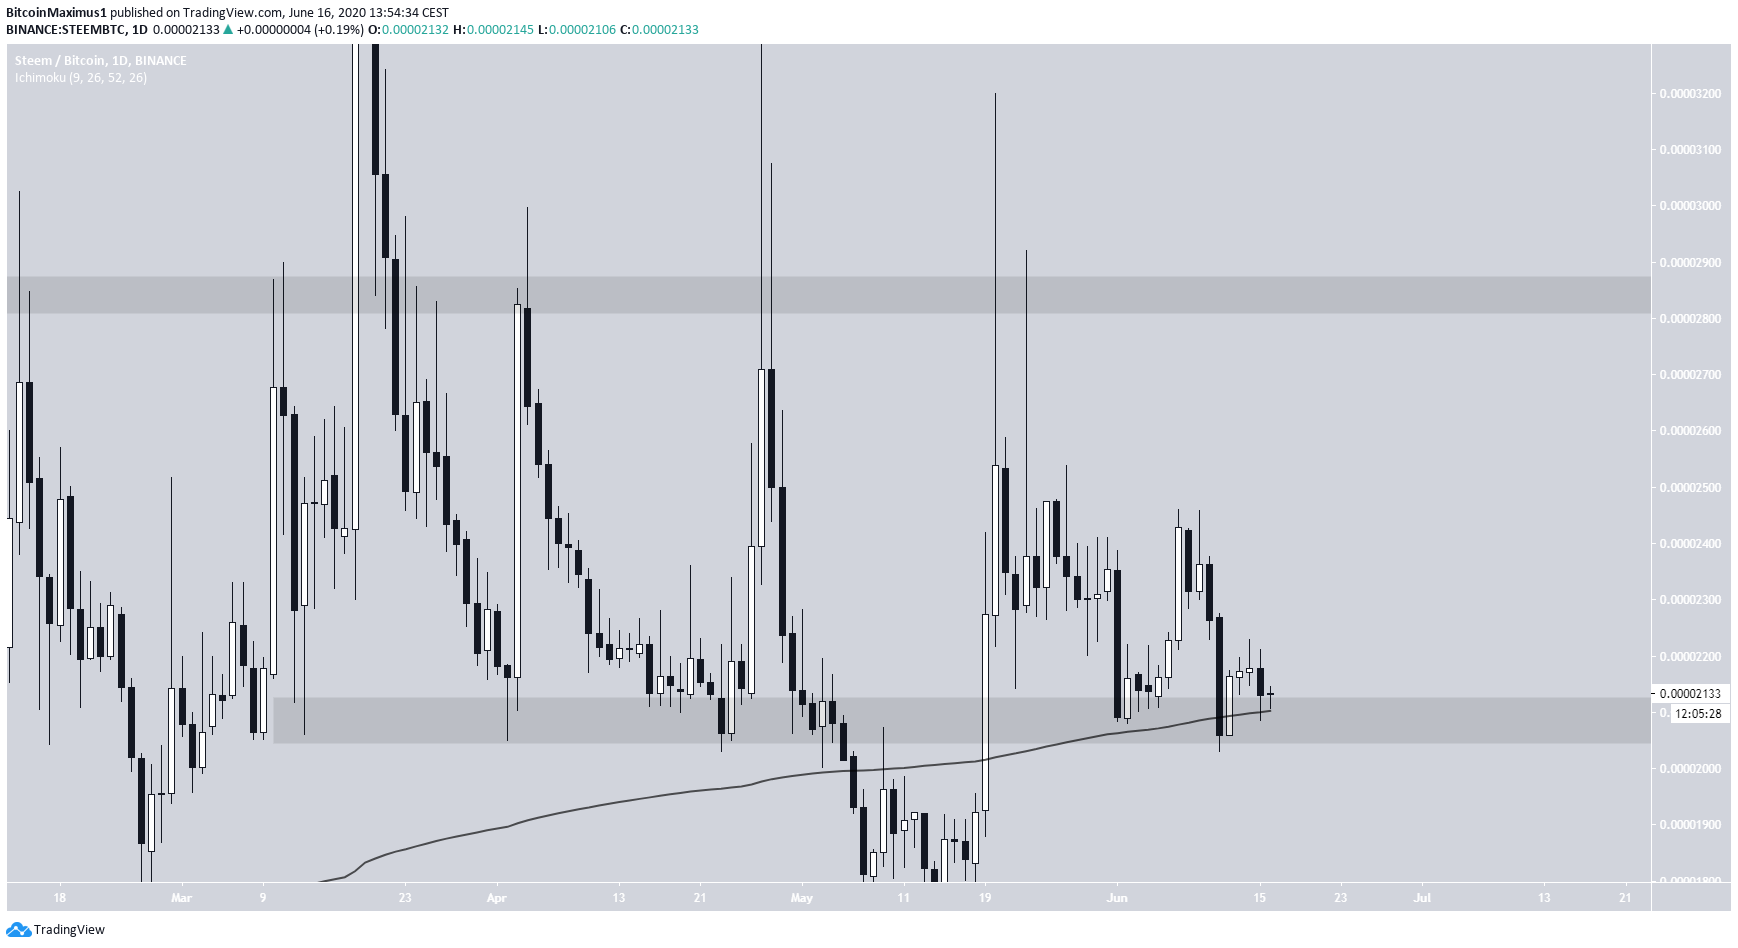
Since the beginning of March, the STEEM price has been trading above the 2080 satoshi support area, with the exception of a 10-day period in May.
Inside its trading range, the main resistance area is found at 2850 satoshis. While the price has moved above it several times, it created a long upper wick on each move, followed immediately by a drop.
Besides the support mentioned above, the STEEM price has also reclaimed the 200-day moving average (MA) and is trading above it.
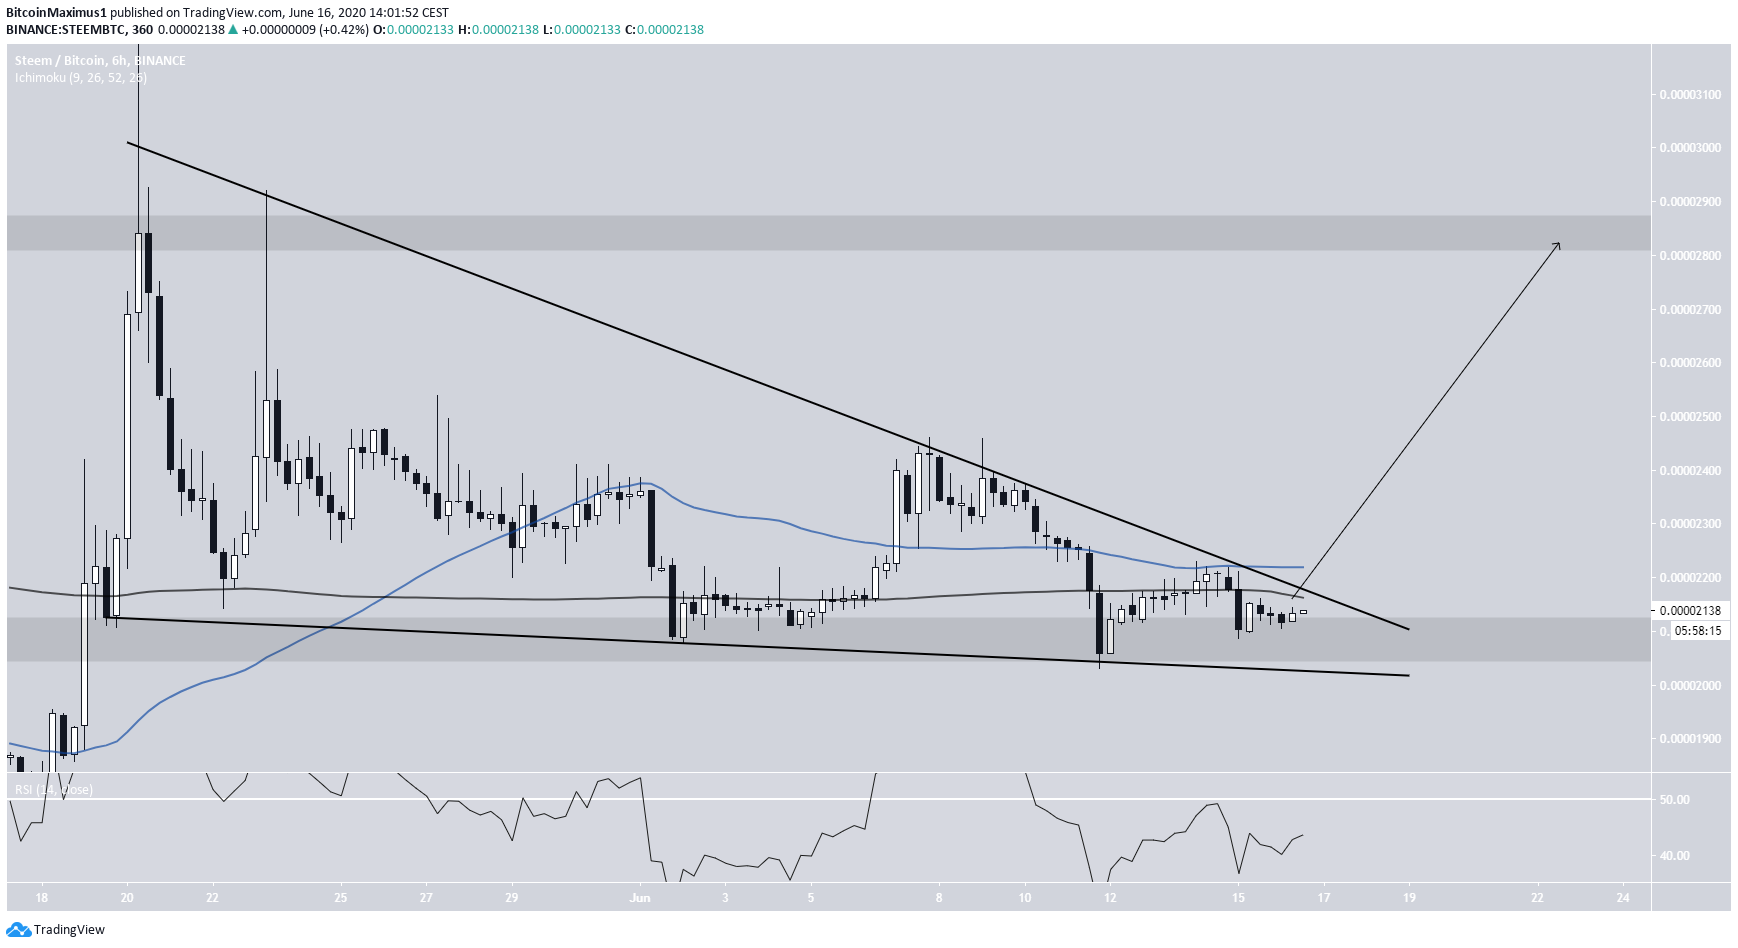
The short-term chart reveals that the price has been trading inside a descending wedge since May 20. At the time of writing, it was approaching the end of the wedge, with a projected resolution on June 24, at the latest.
The descending wedge is considered a bullish reversal pattern so a breakout is expected. However, technical indicators have yet to show any signs of reversal. The RSI is trading below 50, and the price is trading below the 50 and 200-period MAs.
Therefore, until the price can successfully flip these as support, and the RSI moves above 50, the price is likely to continue decreasing at the rate predicted by the wedge.
OmiseGO (OMG)
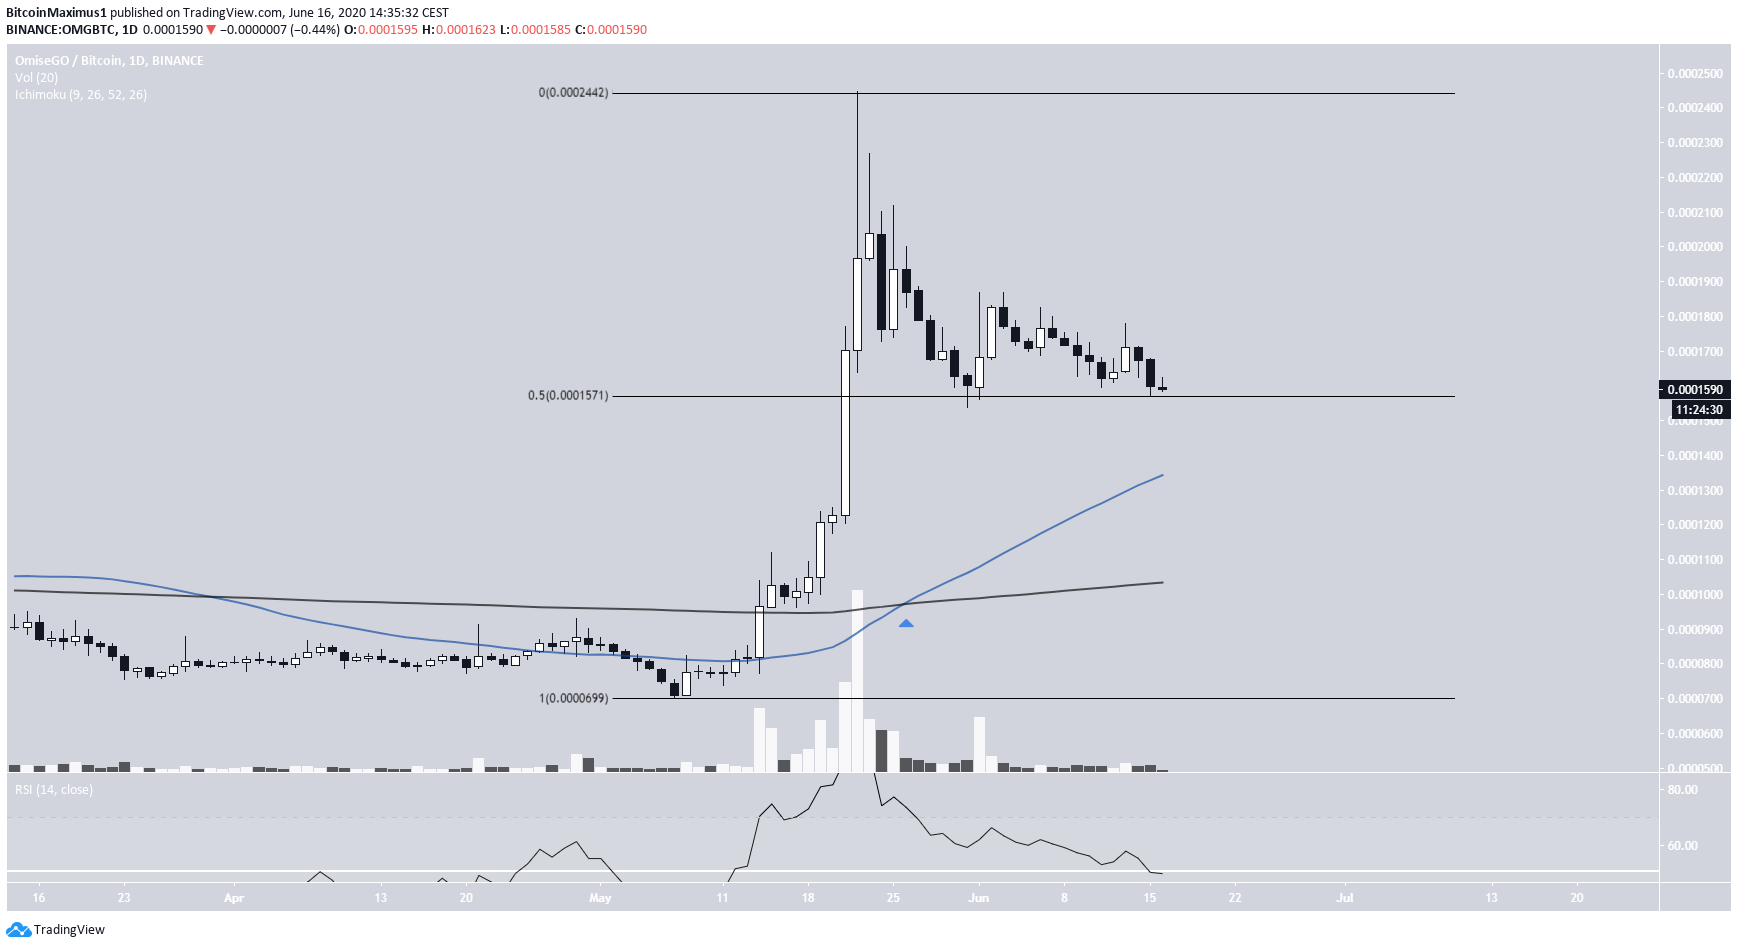
On May 7, the OMG price initiated an upward move, which continued until May 22. During this time, the price increased by 250%, culminating with a high of 24,460 satoshis. The price has been decreasing since May 22.
However, the price has bounced twice on the 0.5 Fib level of the entire decline, a very likely level for a reversal. Also, the RSI has reached the 50 MA line from above, another possible level for a bounce.
Finally, a bullish cross has formed between the 50 and 200-day MAs, a sign that the price is likely to move upwards.
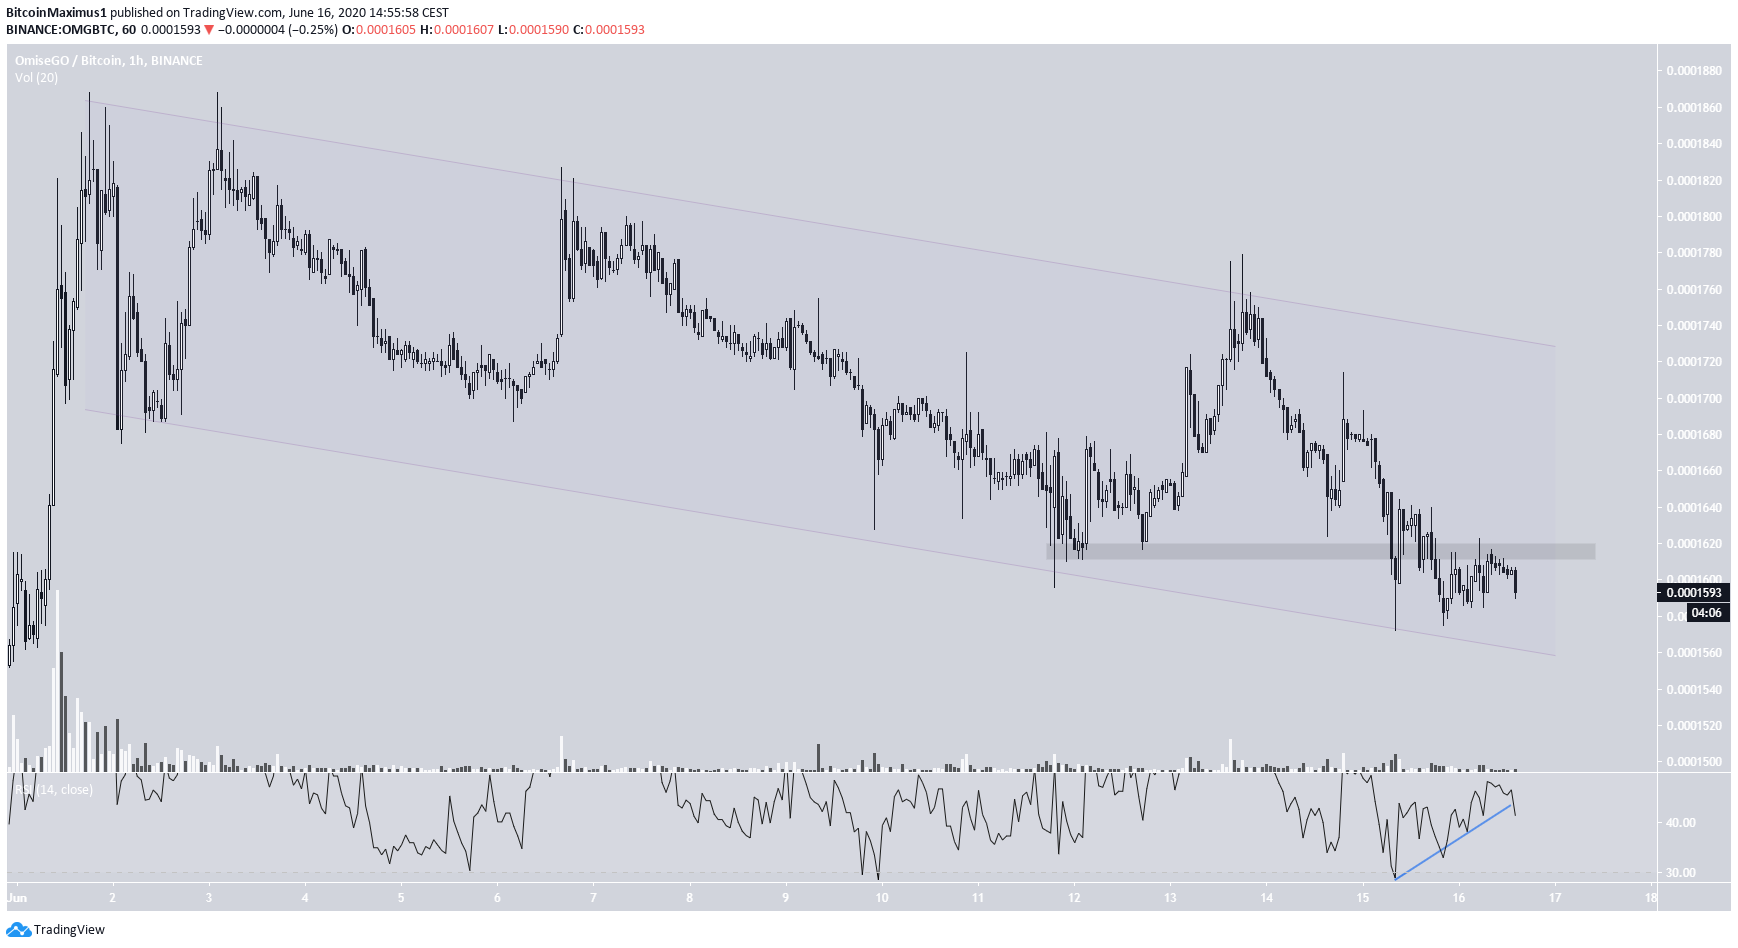
In the short-term, OMG is trading inside a descending parallel channel. It is currently very close to the support line of this channel.
The RSI has been forming bullish divergence, a sign that the price is expected to move up. If it does and reclaims the recently lost 16,200 satoshi support area, it’s likely to continue increasing towards the resistance line of the channel and eventually the May 22 high.