


In today’s on-chain analysis, BeInCrypto compares the Stablecoin Supply Ratio (SSR) and its oscillator to the altcoin market capitalization chart. The goal is to try to determine whether to expect the arrival of the first altcoin season in 2022.
In today’s on-chain analysis, BeInCrypto compares the Stablecoin Supply Ratio (SSR) and its oscillator to the altcoin market capitalization chart. The goal is to try to determine whether to expect the arrival of the first altcoin season in 2022.
If you look at the charts of WAVES, which pumped 285% in 16 days, or LUNA, which just set a new ATH, it seems like these are the first harbingers of this year’s altcoin season. However, despite these exceptions, most altcoins are in a long-term downtrend – against both USD and BTC.
Nevertheless, the chart of altcoin market capitalization (TOTAL2) is approaching a long-term, rising line of support. A bounce from it could initiate a trend reversal and the start of a new altcoin season. Moreover, the Stablecoin Supply Ratio provides signals that after a period of Bitcoin consolidation, capital may soon flow into riskier altcoins.
Long-term support and resistance for TOTAL2
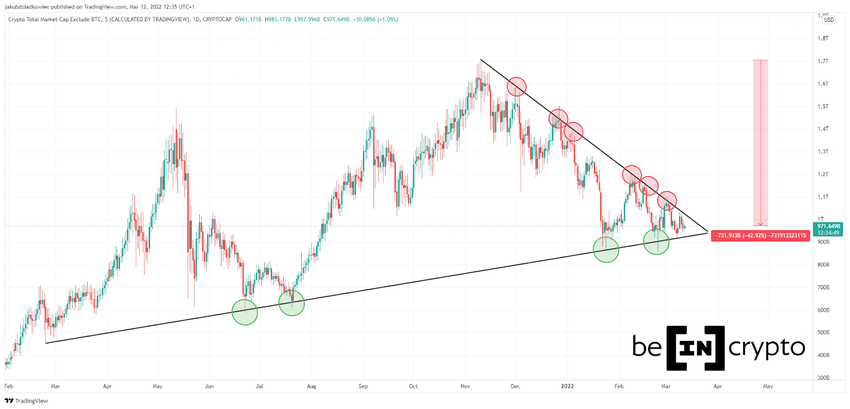
The TOTAL2 chart has been in a downtrend since the all-time high (ATH) of $1.07 trillion set on November 10, 2021. Since then, the price has followed a descending resistance line that has rejected every breakout attempt at least 6 times (red circles). The correction has now lasted 122 days and TOTAL2 has declined by 43% reaching $971 billion today.
On the other hand, the decline has led to a confirmation of the rising support line again, which has been in place since February 2021. Previously, this line served as support in June and July 2021. A bounce from it led to the aforementioned ATH. In total, this line has already been validated as support 4 times (green circles).
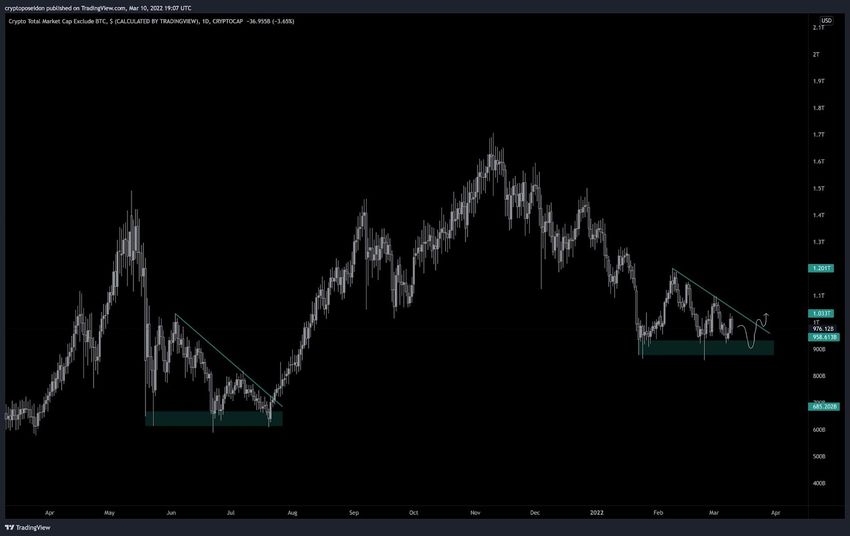
Cryptocurrency trader @CryptoPoseidonn tweeted a chart of TOTAL2, indicating a possible major breakout. He compares the summer 2021 correction with the current situation. The trader expects that a breakout of the falling resistance line, followed by its validation as support, will lead to a new altcoin season.
A complimentary look is provided by a chart of the altcoin season indicator, regularly updated by BlockchainCenter. The indicator was recently around the value of 25, which is interpreted as a Bitcoin season. During this period, altcoins lose against BTC and most often against USD as well.
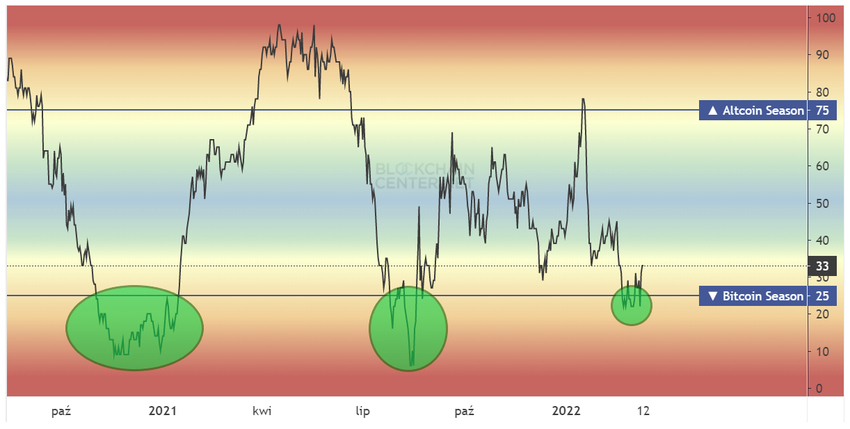
The previous two occasions (highlighted) when the chart fell below 25 occurred between November 2020-January 2021 and July-August 2021. These correlate with periods when TOTAL2 was experiencing a correction (if BTC was falling) or a sideways trend (if BTC was rising). However, in both cases, a return to higher values above 25 was a signal for a major altcoin season.
SSR signals the start of altcoin season
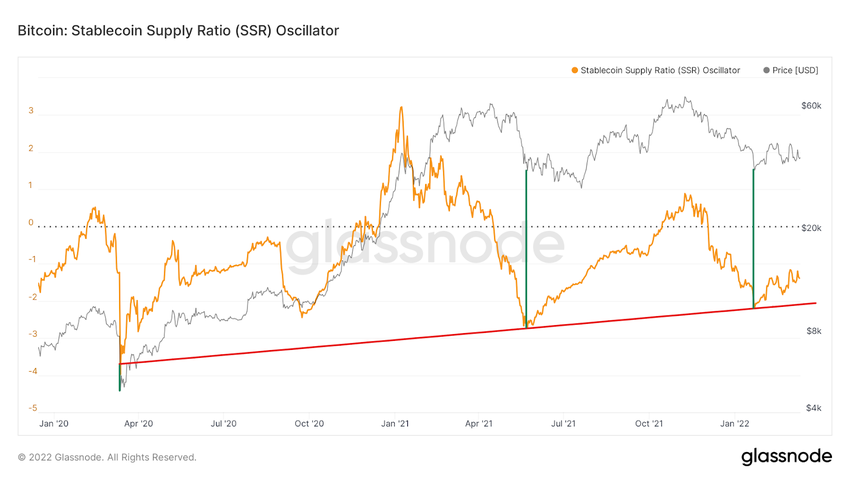
One of the leading on-chain analysts @Negentropic_ has linked the possibility of the arrival of altcoin season to the Stablecoin Supply Ratio (SSR) oscillator. In a double chart posted on Twitter, he illustrates the positive correlation between the two charts. The analyst states:
“More stablecoins converted to #Bitcoin as the price consolidates. Once the rally begins, money will flow to riskier altcoins.”
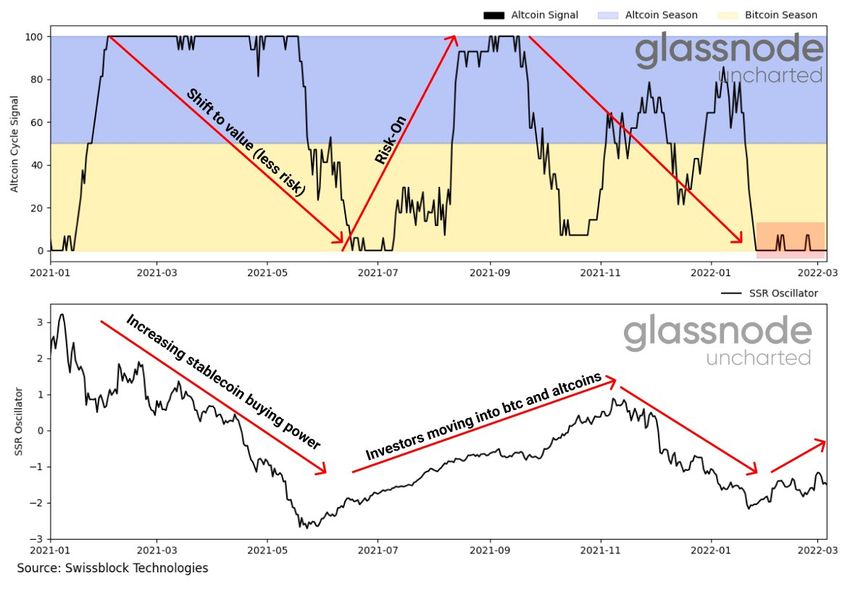
On the SSR oscillator chart from Glassnode, we do indeed see an ascending support line that goes back to the crash of the COVID-19 pandemic in March 2020. Each tap of this support line correlated with a bottom in the Bitcoin price.
This support also marked the peak points of cash flow into risk-off assets. Investors then recovered and opened back up to risk-on assets, leading to a new altcoin season.
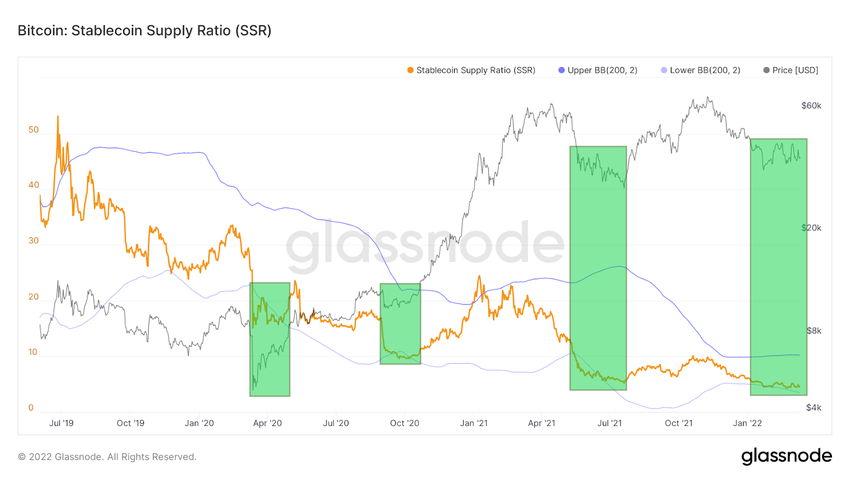
The basic SSR chart, which we covered at BeInCrypto back in January, provides a similar signal. For more than two months, the SSR chart has been consolidating near the lower 200-day Bollinger band. Historically, this area has been a period of good buying opportunities, after which Bitcoin and altcoin prices have risen rapidly (green areas).
BeInCrypto’s latest Bitcoin (BTC) analysis, click here.


