


Serum (SRM) reached a new all-time high price on April 11, but decreased shortly afterwards.
Despite the ongoing drop, SRM is expected to find support and reverse its short-term bearish trend. Afterwards, a new all-time high price is expected.
SRM all-time high and double top
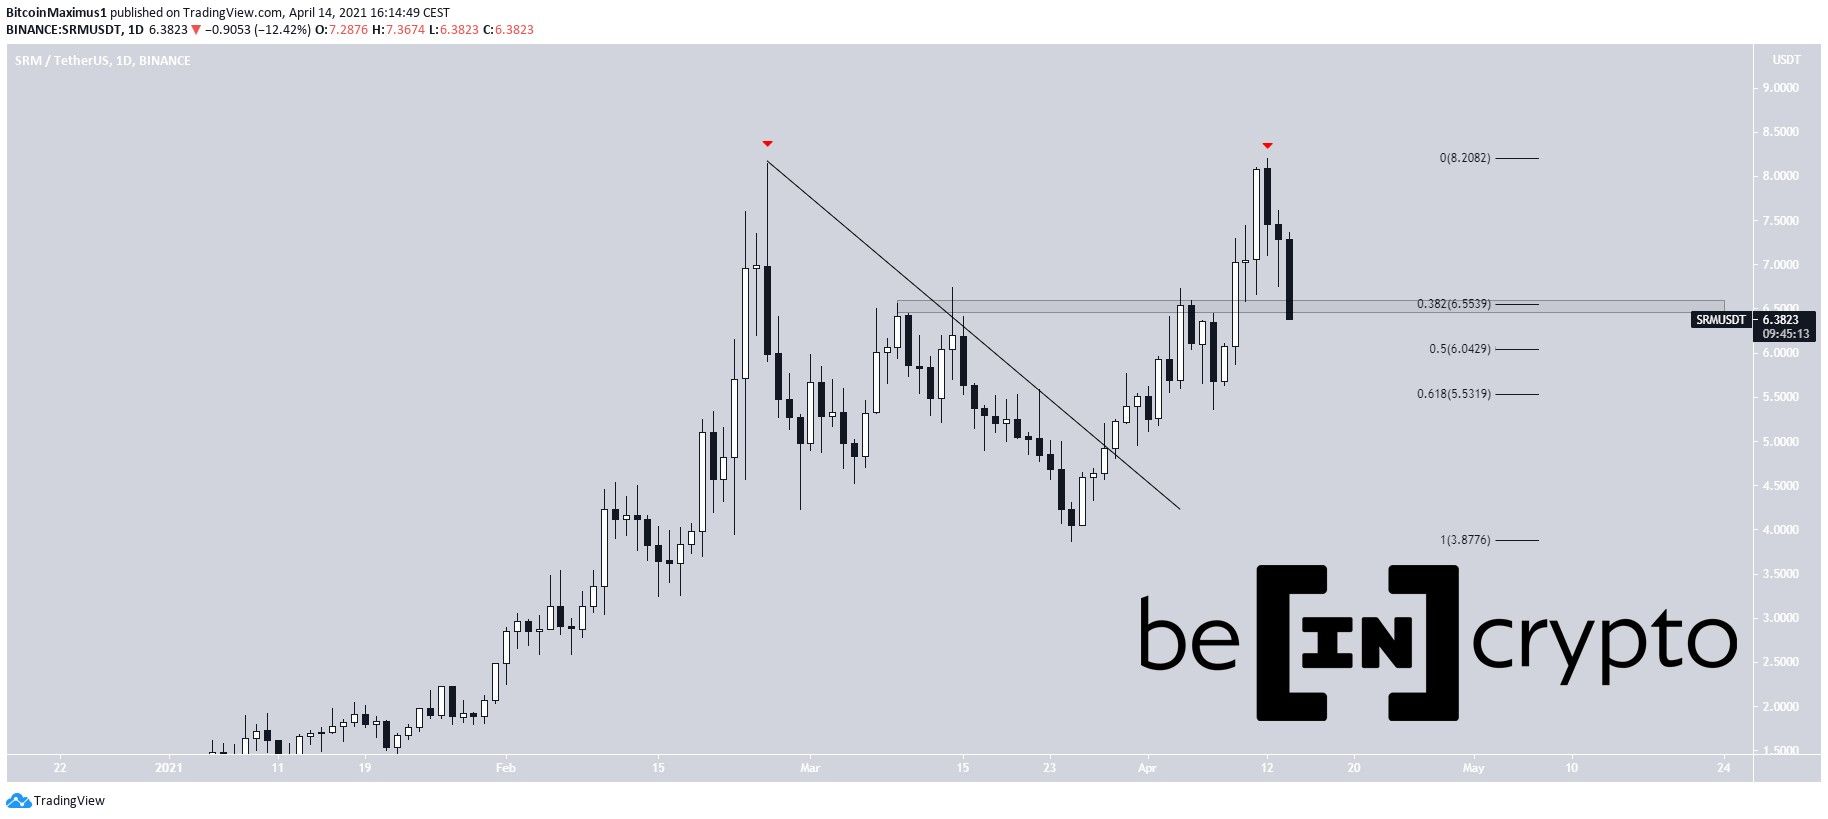
On Feb. 25, SRM reached a then all-time high (ATH) price of $8.14. After a considerable drop, it managed to break out from a descending resistance line.
This move led to a new all-time high of $8.20 being reached on April 11. However, the upward move was not sustained and the token created a double top pattern.
Since then, SRM has been moving downwards.
Currently, it has reached the $6.54 support area. This is both the 0.382 Fib retracement level and a horizontal resistance area. The next support levels below it are found at $6.05 and $5.55.
Short-term movement
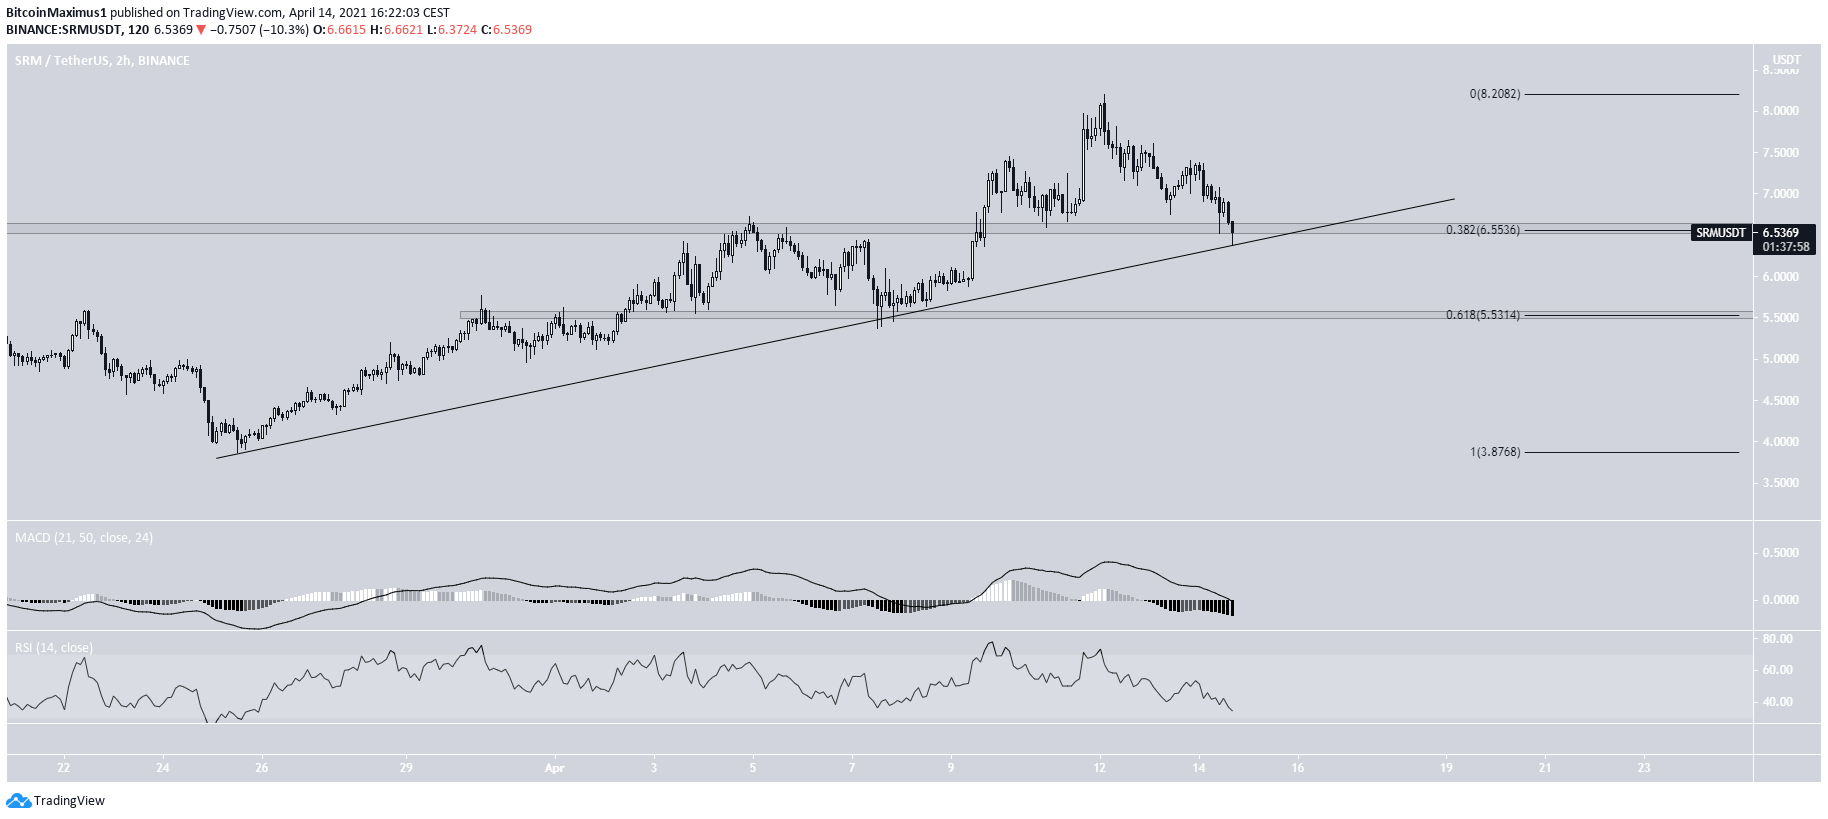
Despite the lack of bullish reversal signs, the $6.55 level remains the most likely out of the three to initiate a reversal.
This is because it provides a confluence of support level:
- Fib support level
- Horizontal support level.
- Diagonal support level (ascending support line).
If SRM breaks down, the next most likely reversal area would be found at $5.55, which is both the 0.618 Fib retracement and a horizontal support area.
Wave count for SRM
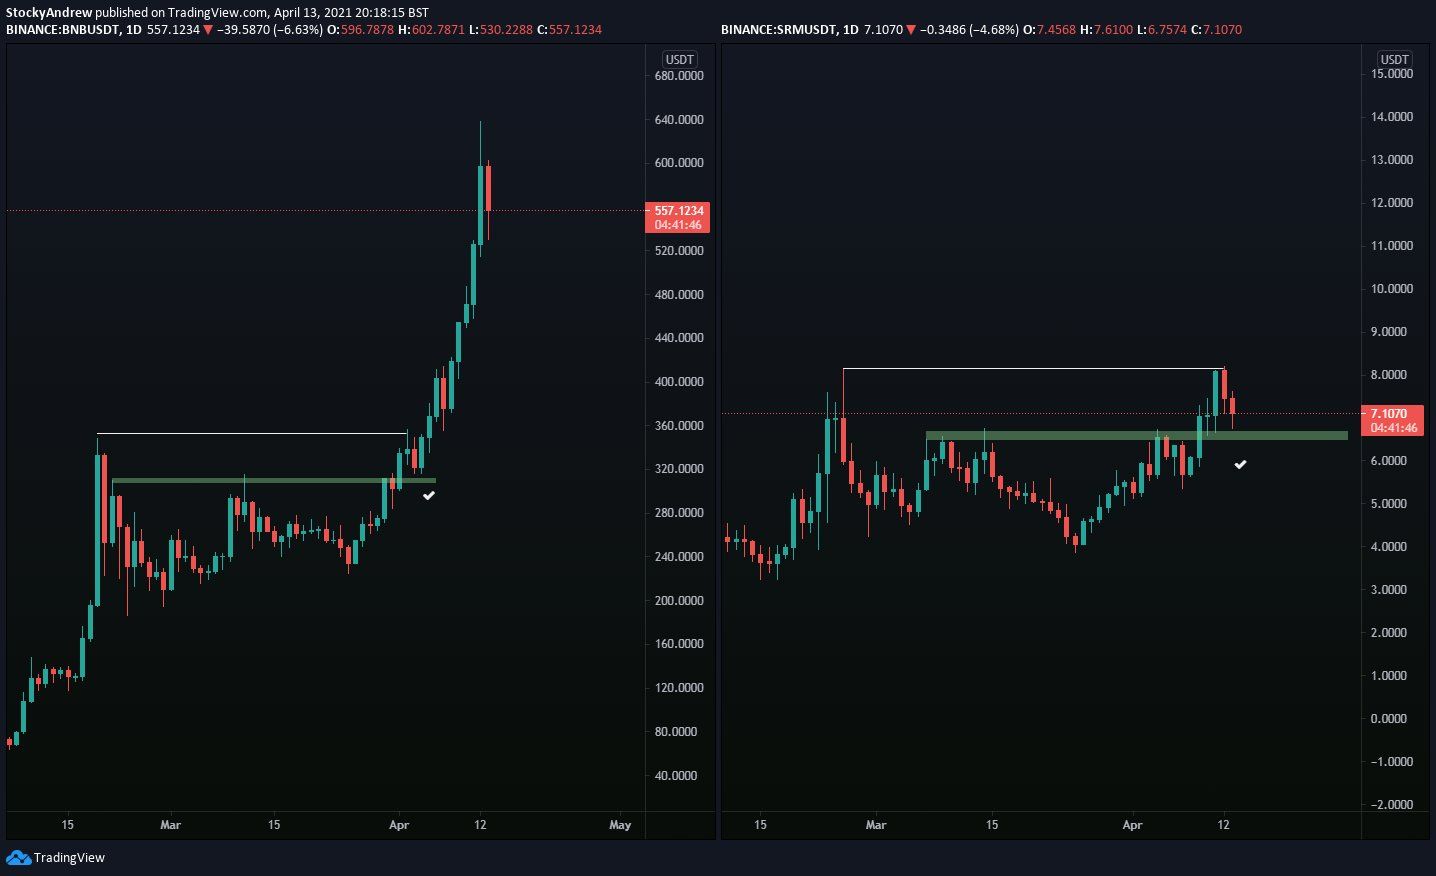
Cryptocurrency trader @ACXtrades outlined a SRM chart, stating that it has the exact same setup as BNB had prior to taking off.
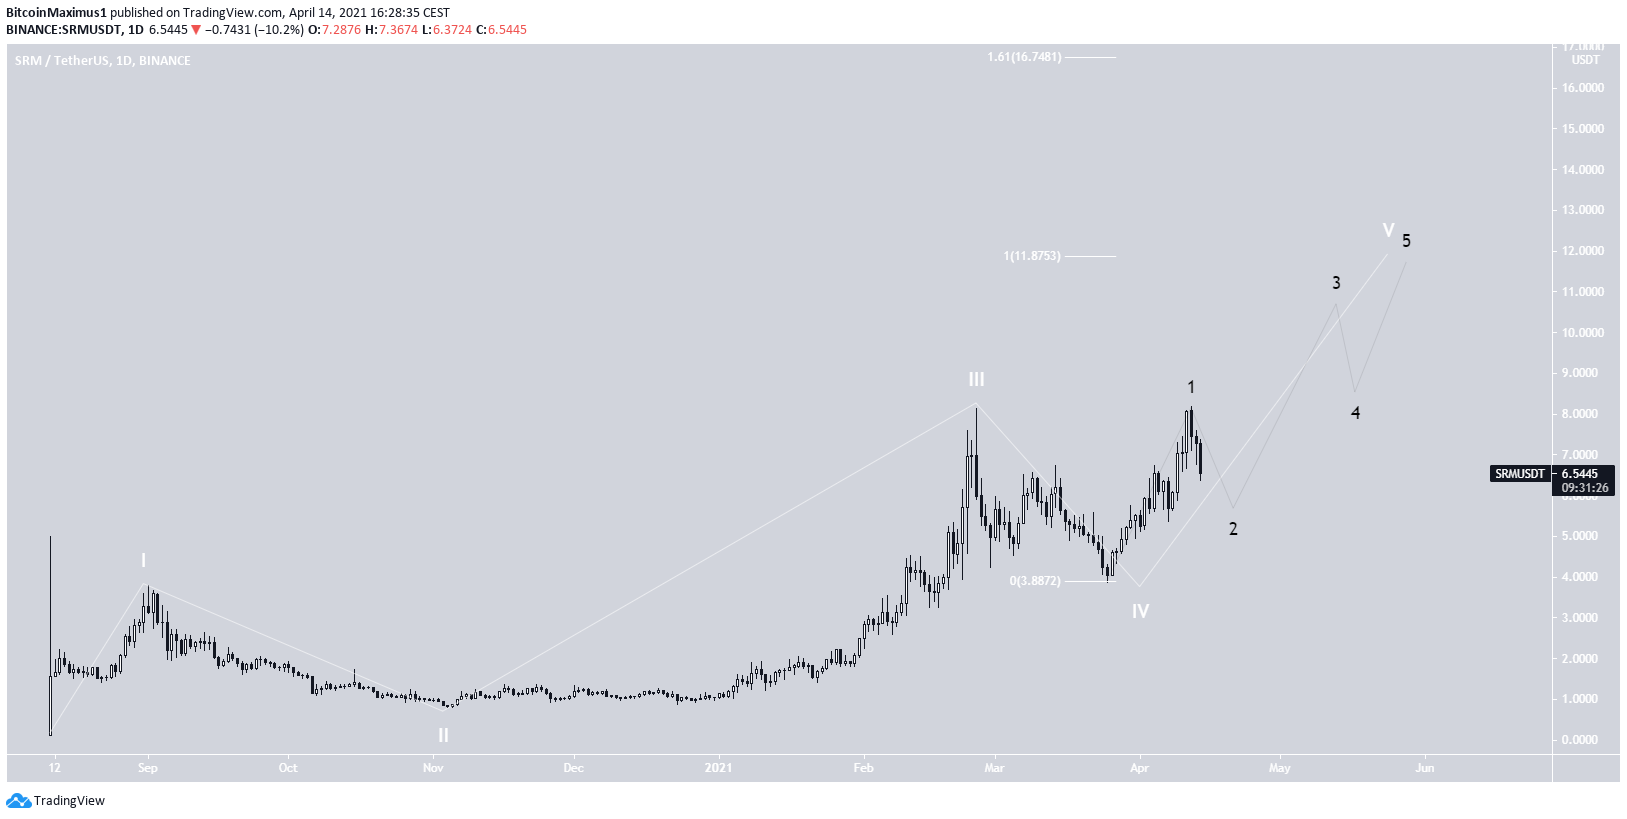
The wave count suggests that SRM is in wave five of a long-term bullish impulse (white). The sub-wave count is given in black.
A potential target for the top of the upward movement is located at $11.90. This is found by using a Fib projection on waves 1-3.
If wave five extends, the next most likely target would be found at $16.74. Currently, it cannot be determined whether wave five will extend or not.
Conclusion
To conclude, SRM is expected to find support at one of the short-term support levels outlined. Afterwards, an upward move that takes it to a new all-time high price is expected.
For BeInCrypto’s latest bitcoin (BTC) analysis, click here.



