
Serum (SRM) has been moving downwards since reaching an all-time high price of $12.98, on May 3.
The token has bounced at the $2.70 long-term support area, but has yet to show any important bullish reversal signs.
Ongoing SRM decrease
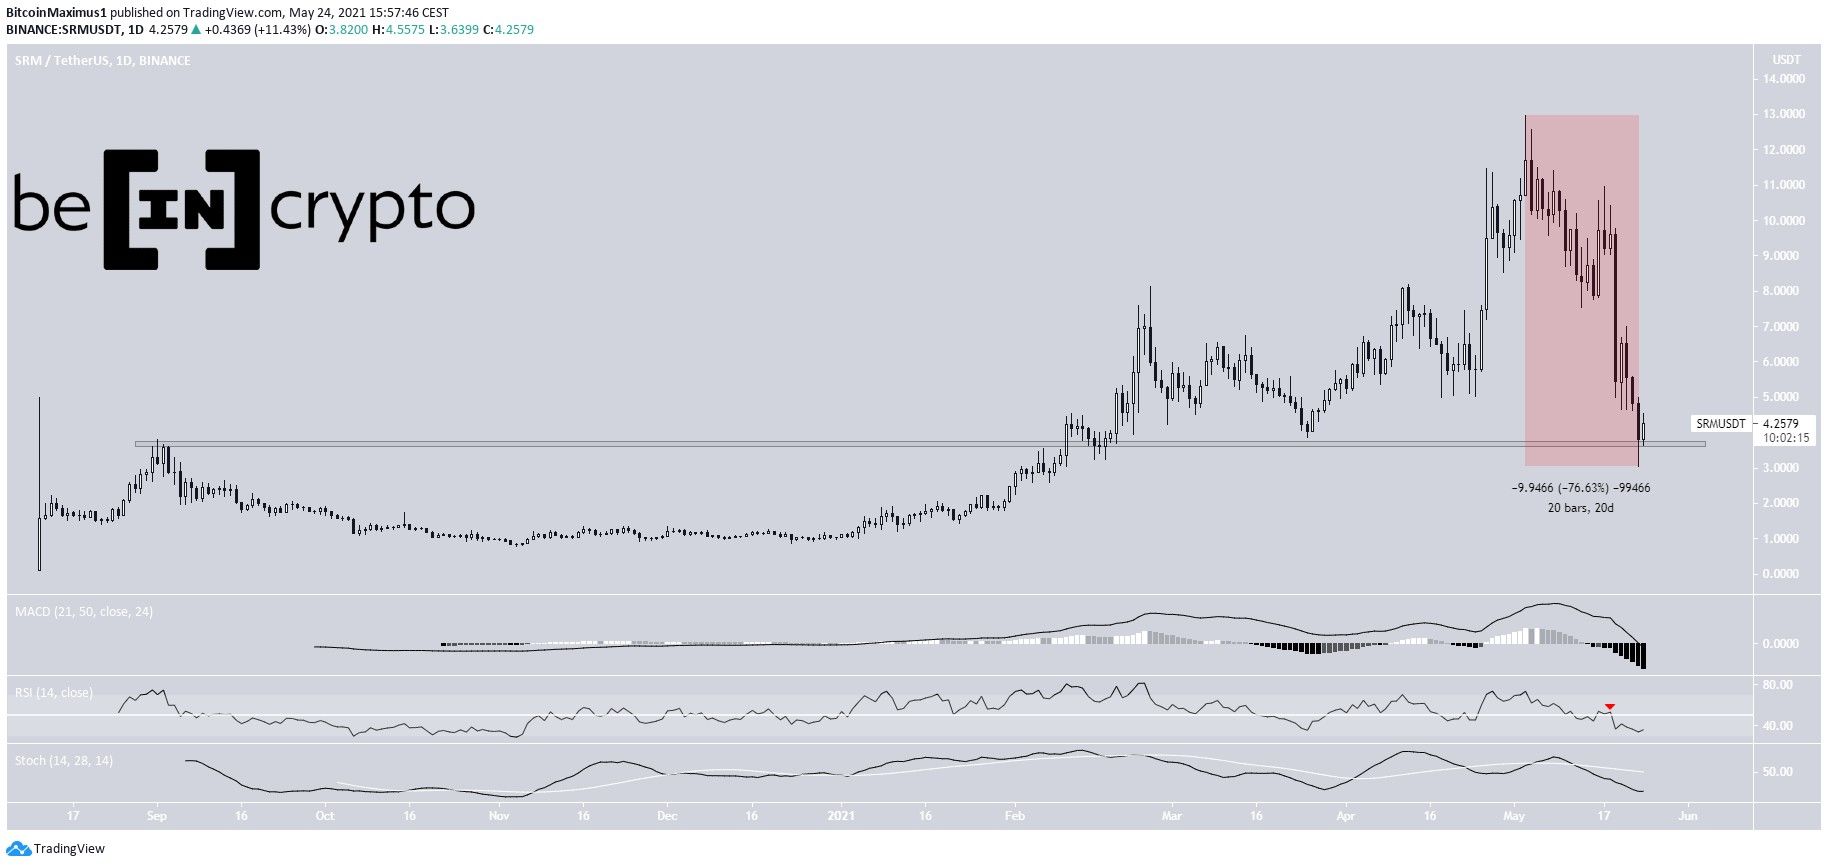
SRM reached an all-time high of $12.98, on May 3. However, it has been moving downwards since. On May 23, it reached a low of $3.03. This amounted to a decrease of 76% in only 20 days.
In addition, it took the token back to the $2.70 area, which had previously acted as support. As a result, a bounce is likely. The token has tagged support following a sharp fall. Nevertheless, technical indicators are still bearish.
The MACD has crossed into negative territory. The RSI has crossed below 50. The Stochastic oscillator has made a bearish cross.
Short-term movement
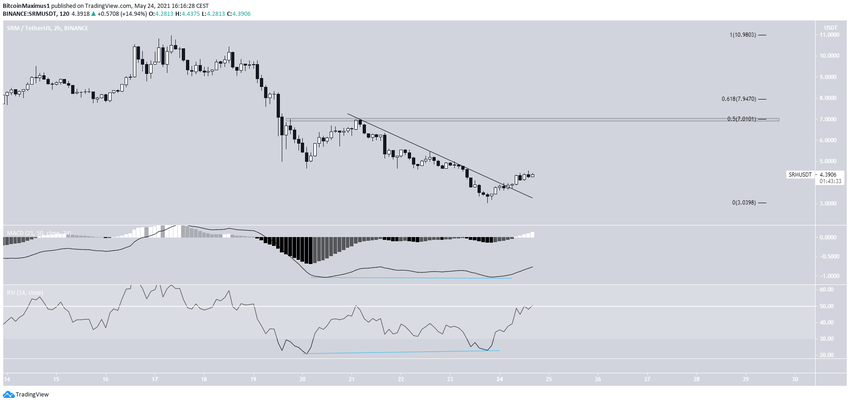
The shorter-term two-hour chart is more bullish. It shows that SRM has broken out from a descending resistance line, which had previously been in place since May 21.
The breakout was preceded by bullish divergence in both the RSI and MACD. The former is close to moving above 50, while the latter has already turned positive.
There is strong resistance at $7. This is the 0.5 Fib retracement resistance level and also a horizontal resistance area. Therefore, until the level is reclaimed, we cannot consider the short-term trend bullish.
SRM wave count
Cryptocurrency trader @altstreetbet outlined a SRM chart, stating that cycle wave two has just completed. He suggests another one will soon begin.
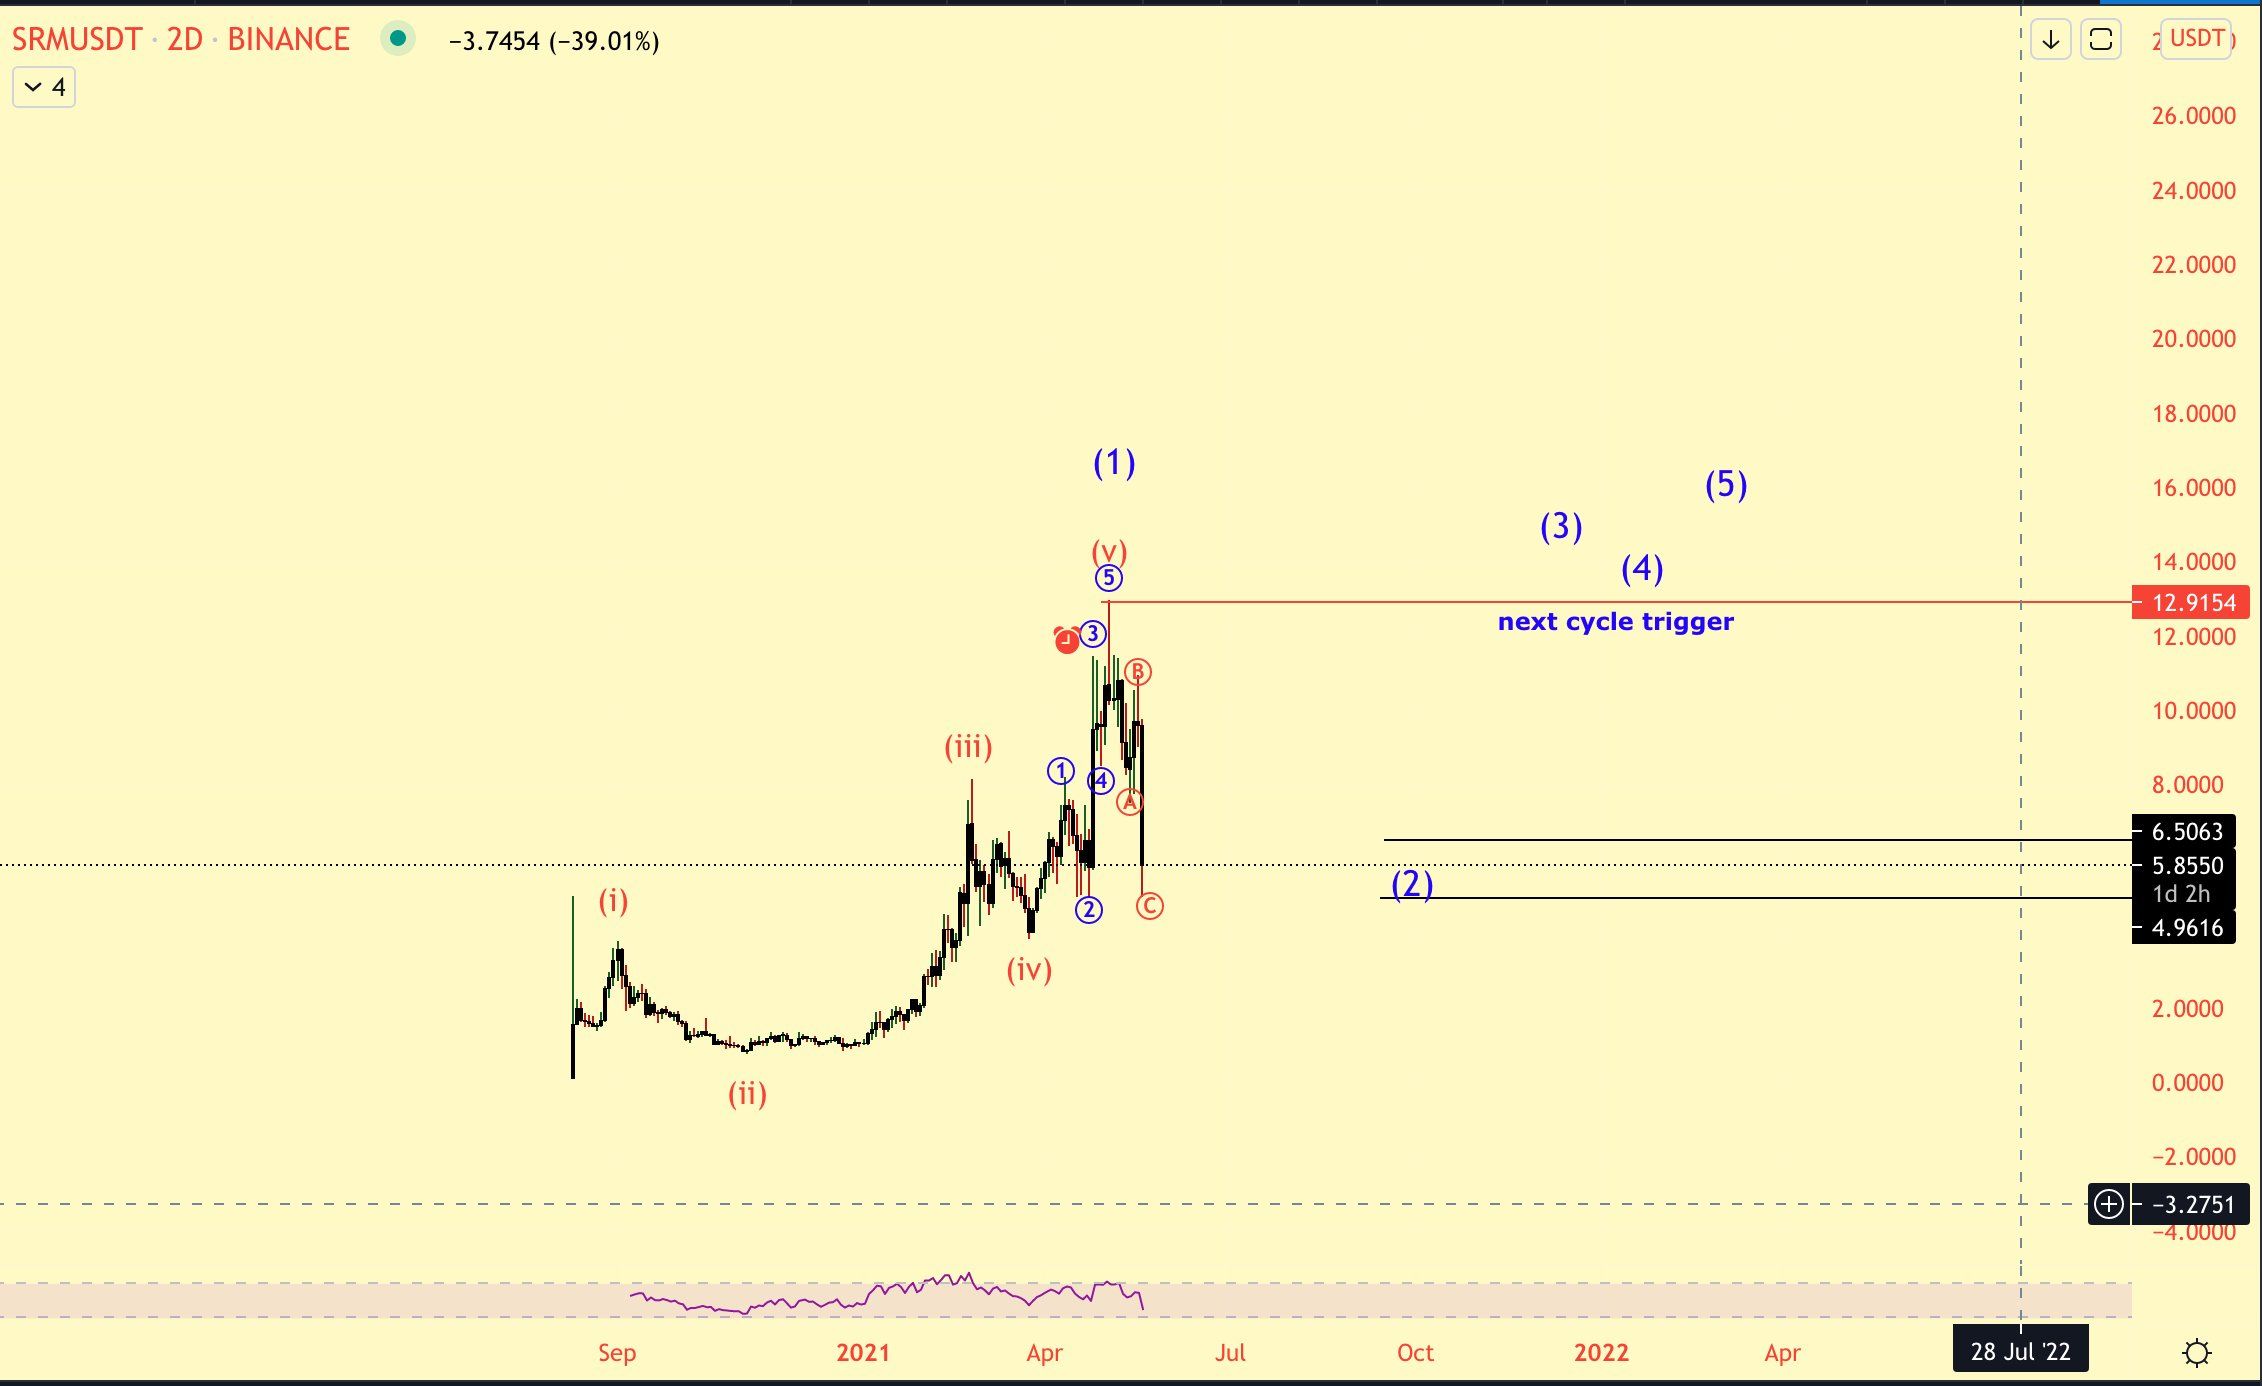
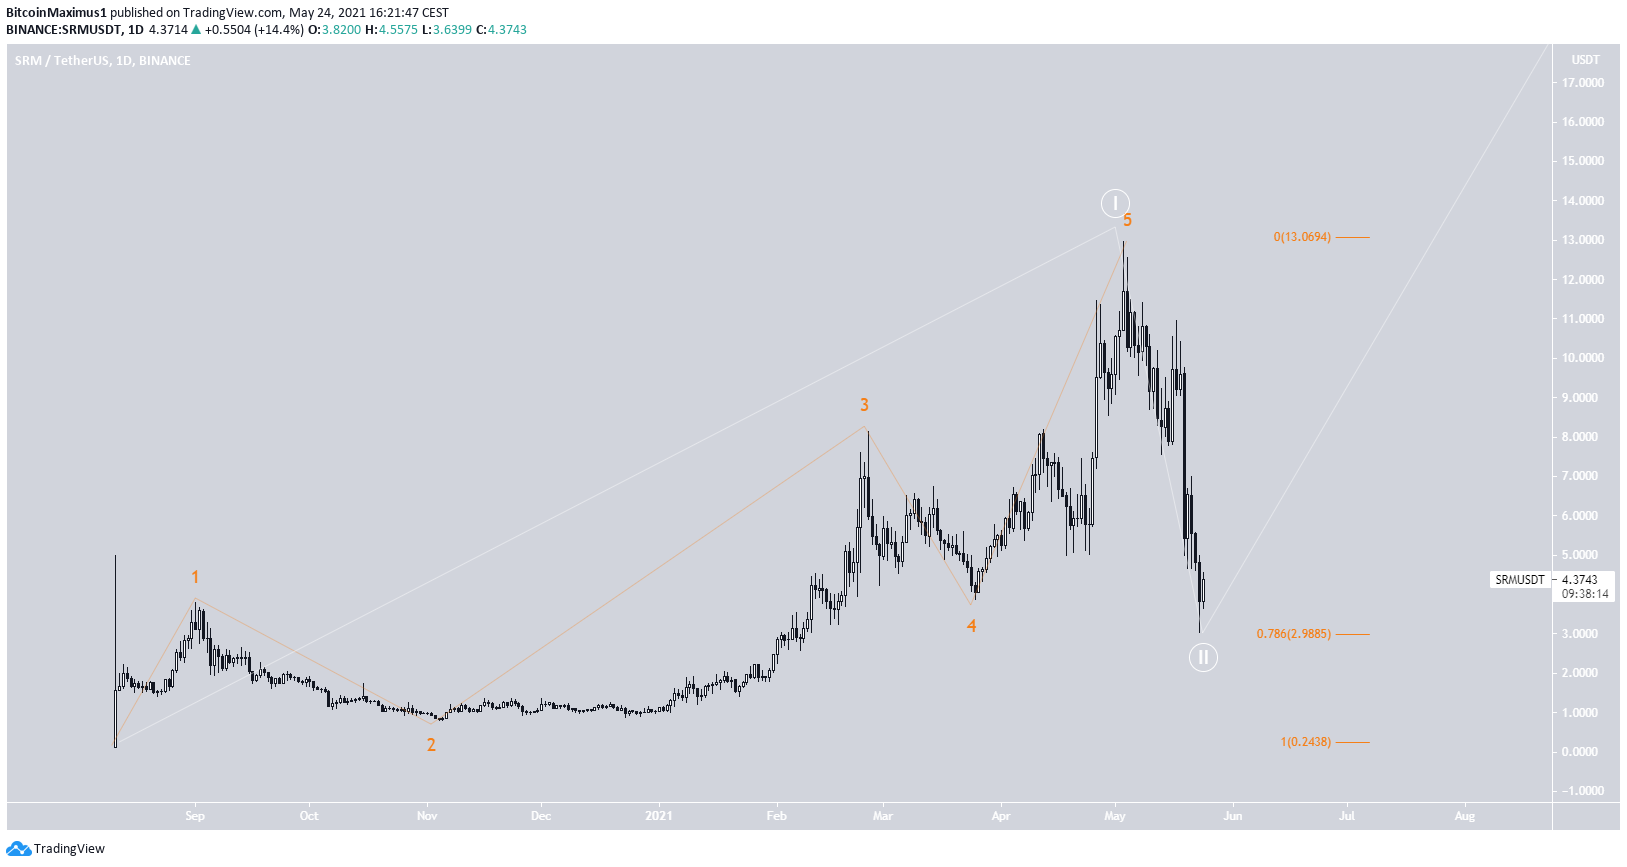
The wave count shows that it is likely that SRM has completed wave two (white). The sub-wave count (orange) for wave one shows a completed bullish impulse.
What followed afterwards was a downward movement that took the token all the way to the 0.786 Fib retracement support level.
Despite being deep in magnitude, the correction has been very short in length relative to the preceding upward movement. Therefore, it is possible that the token will continue consolidating, before eventually beginning another upward movement.
Therefore, while SRM is very close to or has already reached its low, it could take a while, before it begins the next portion of its upward movement.
For BeInCrypto’s latest bitcoin (BTC) analysis, click here.
