
Meme coin SPX has tumbled 22% over the past week to trade at $1.30 at press time, raising concerns about further downside risks.
Technical indicators suggest that capital is flowing out of the market, hinting that the token could face even steeper declines soon.
SPX Dips as Traders Reduce Exposure
Readings from the SPX/USD one-day chart show a steady dip in the token’s Smart Money Index (SMI) since August 10. As of this writing, it sits at 2.16.
Want more token insights like this? Sign up for Editor Harsh Notariya’s Daily Crypto Newsletter here.
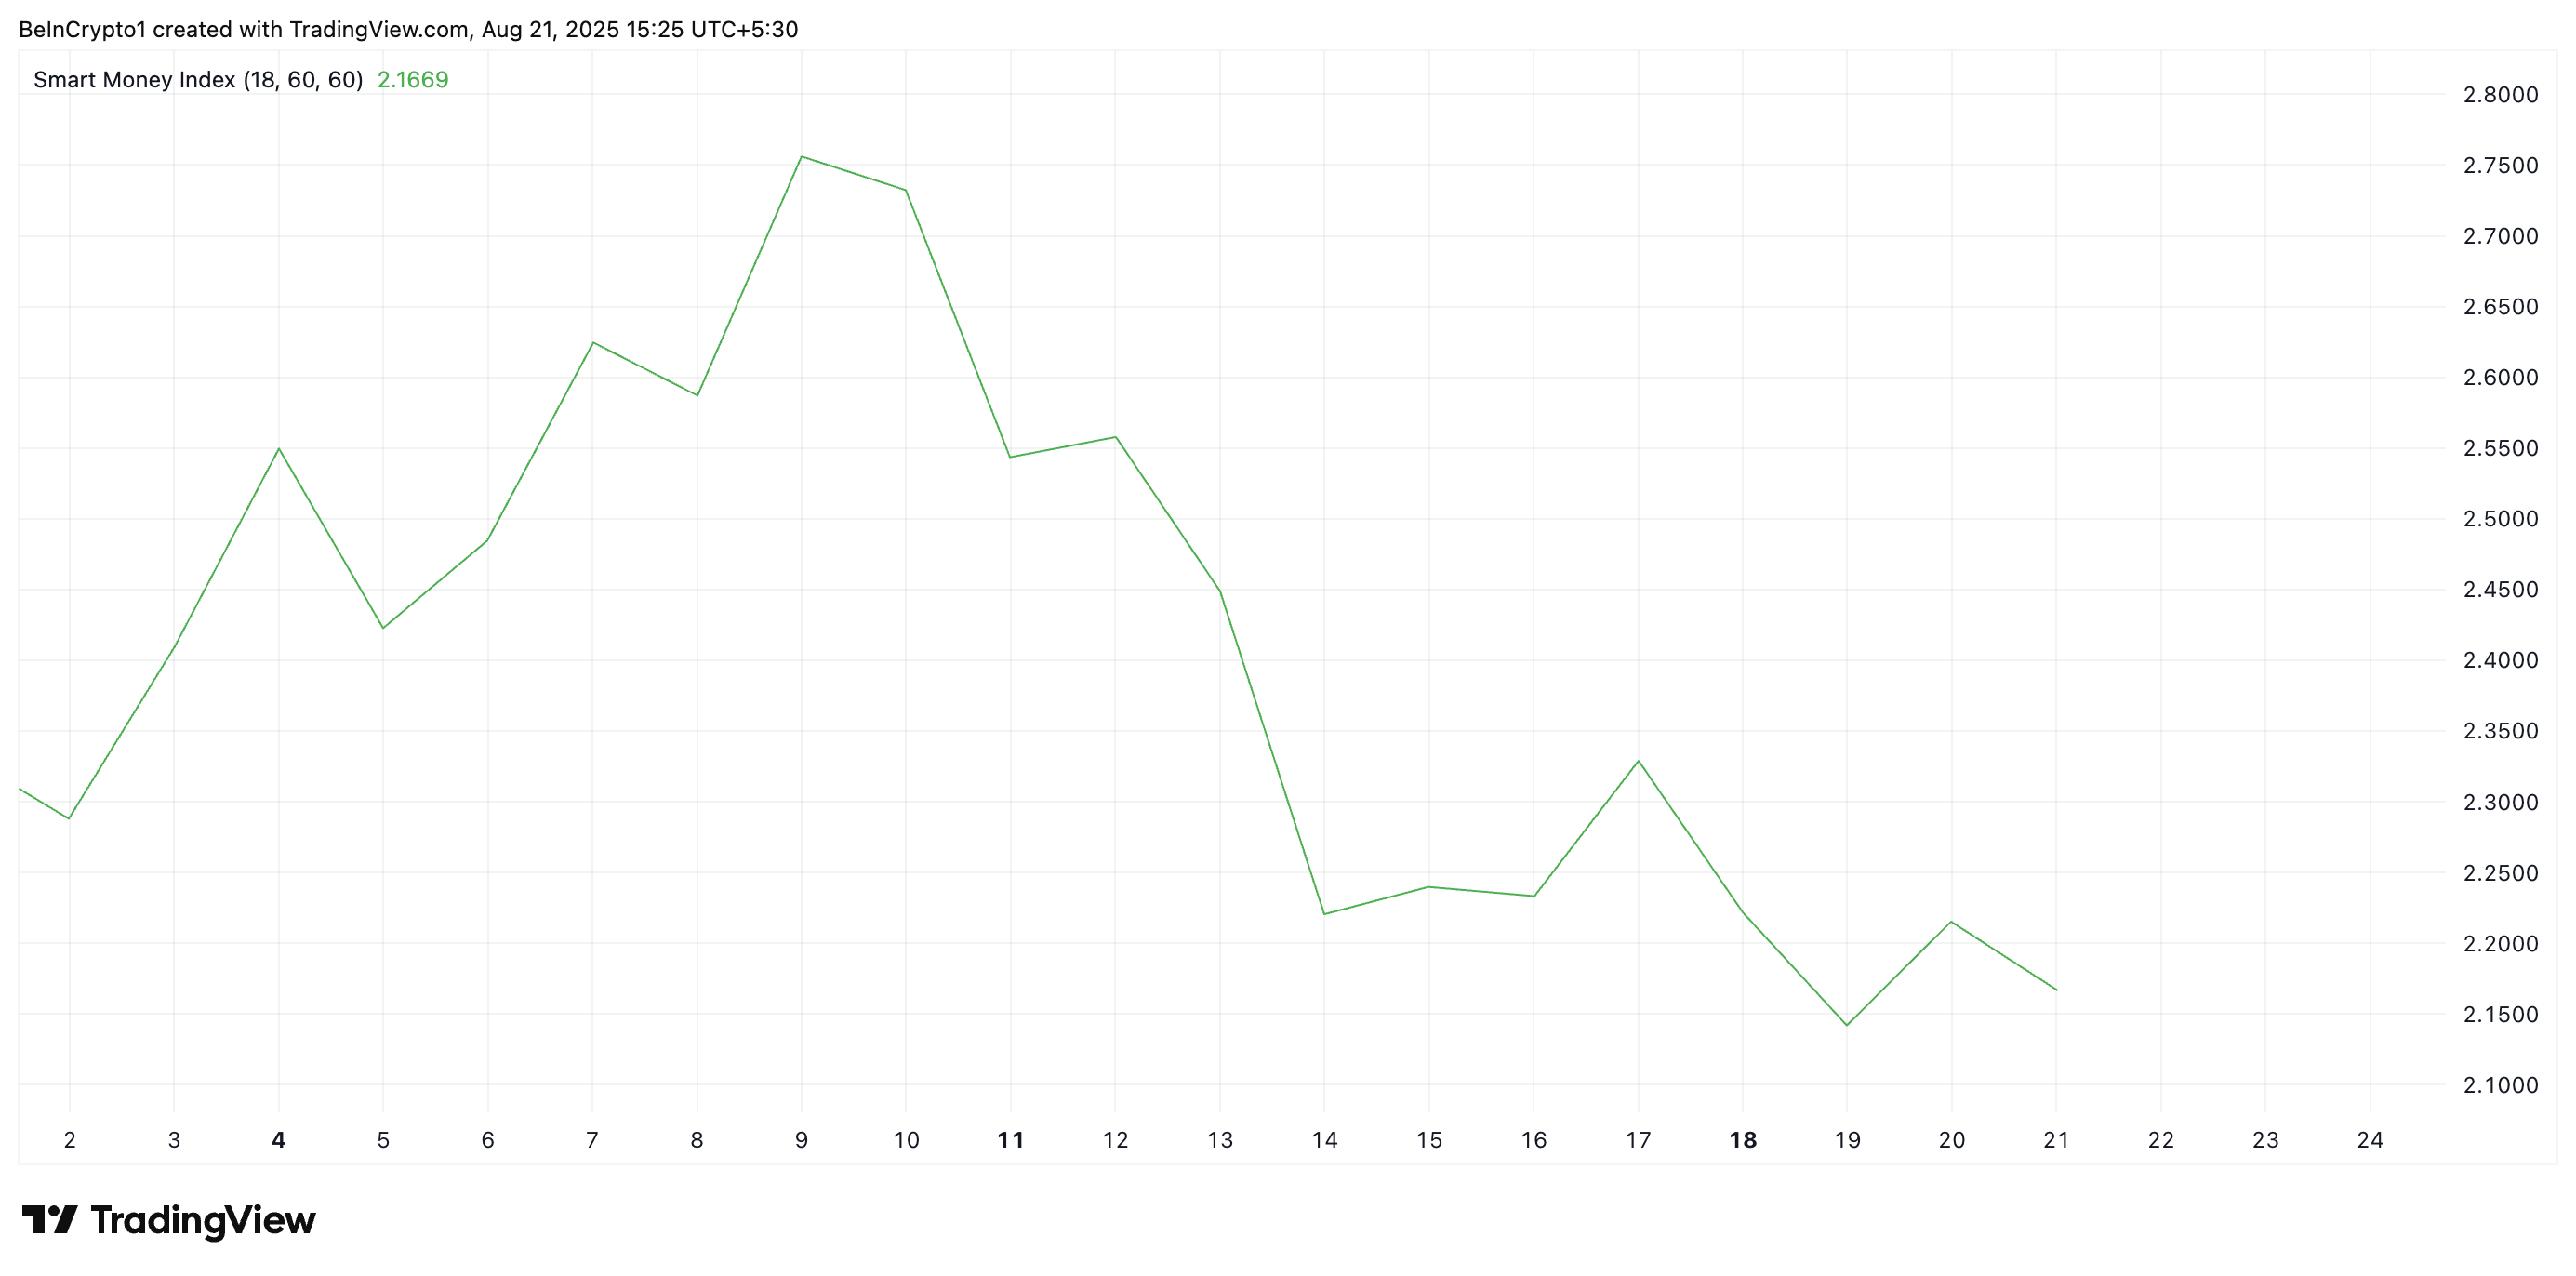
Smart money refers to experienced investors or institutions such as hedge funds, venture capitalists, and professional traders who are believed to have better insights than the average retail investor.
The SMI tracks the behavior of these investors by analyzing intraday price movements. Specifically, it measures selling in the morning (when retail traders dominate) versus buying in the afternoon (when institutions are more active).
A rising SMI signals that smart money is accumulating an asset, often ahead of major price moves. On the other hand, when this indicator falls, key holders of an asset are distributing their tokens.
This indicates that SPX could face even steeper declines soon if these investors keep selling.
Moreover, SPX’s Parabolic Stop and Reverse (SAR) currently forms dynamic resistance above its price at $1.93, lending credence to the bearish outlook above.
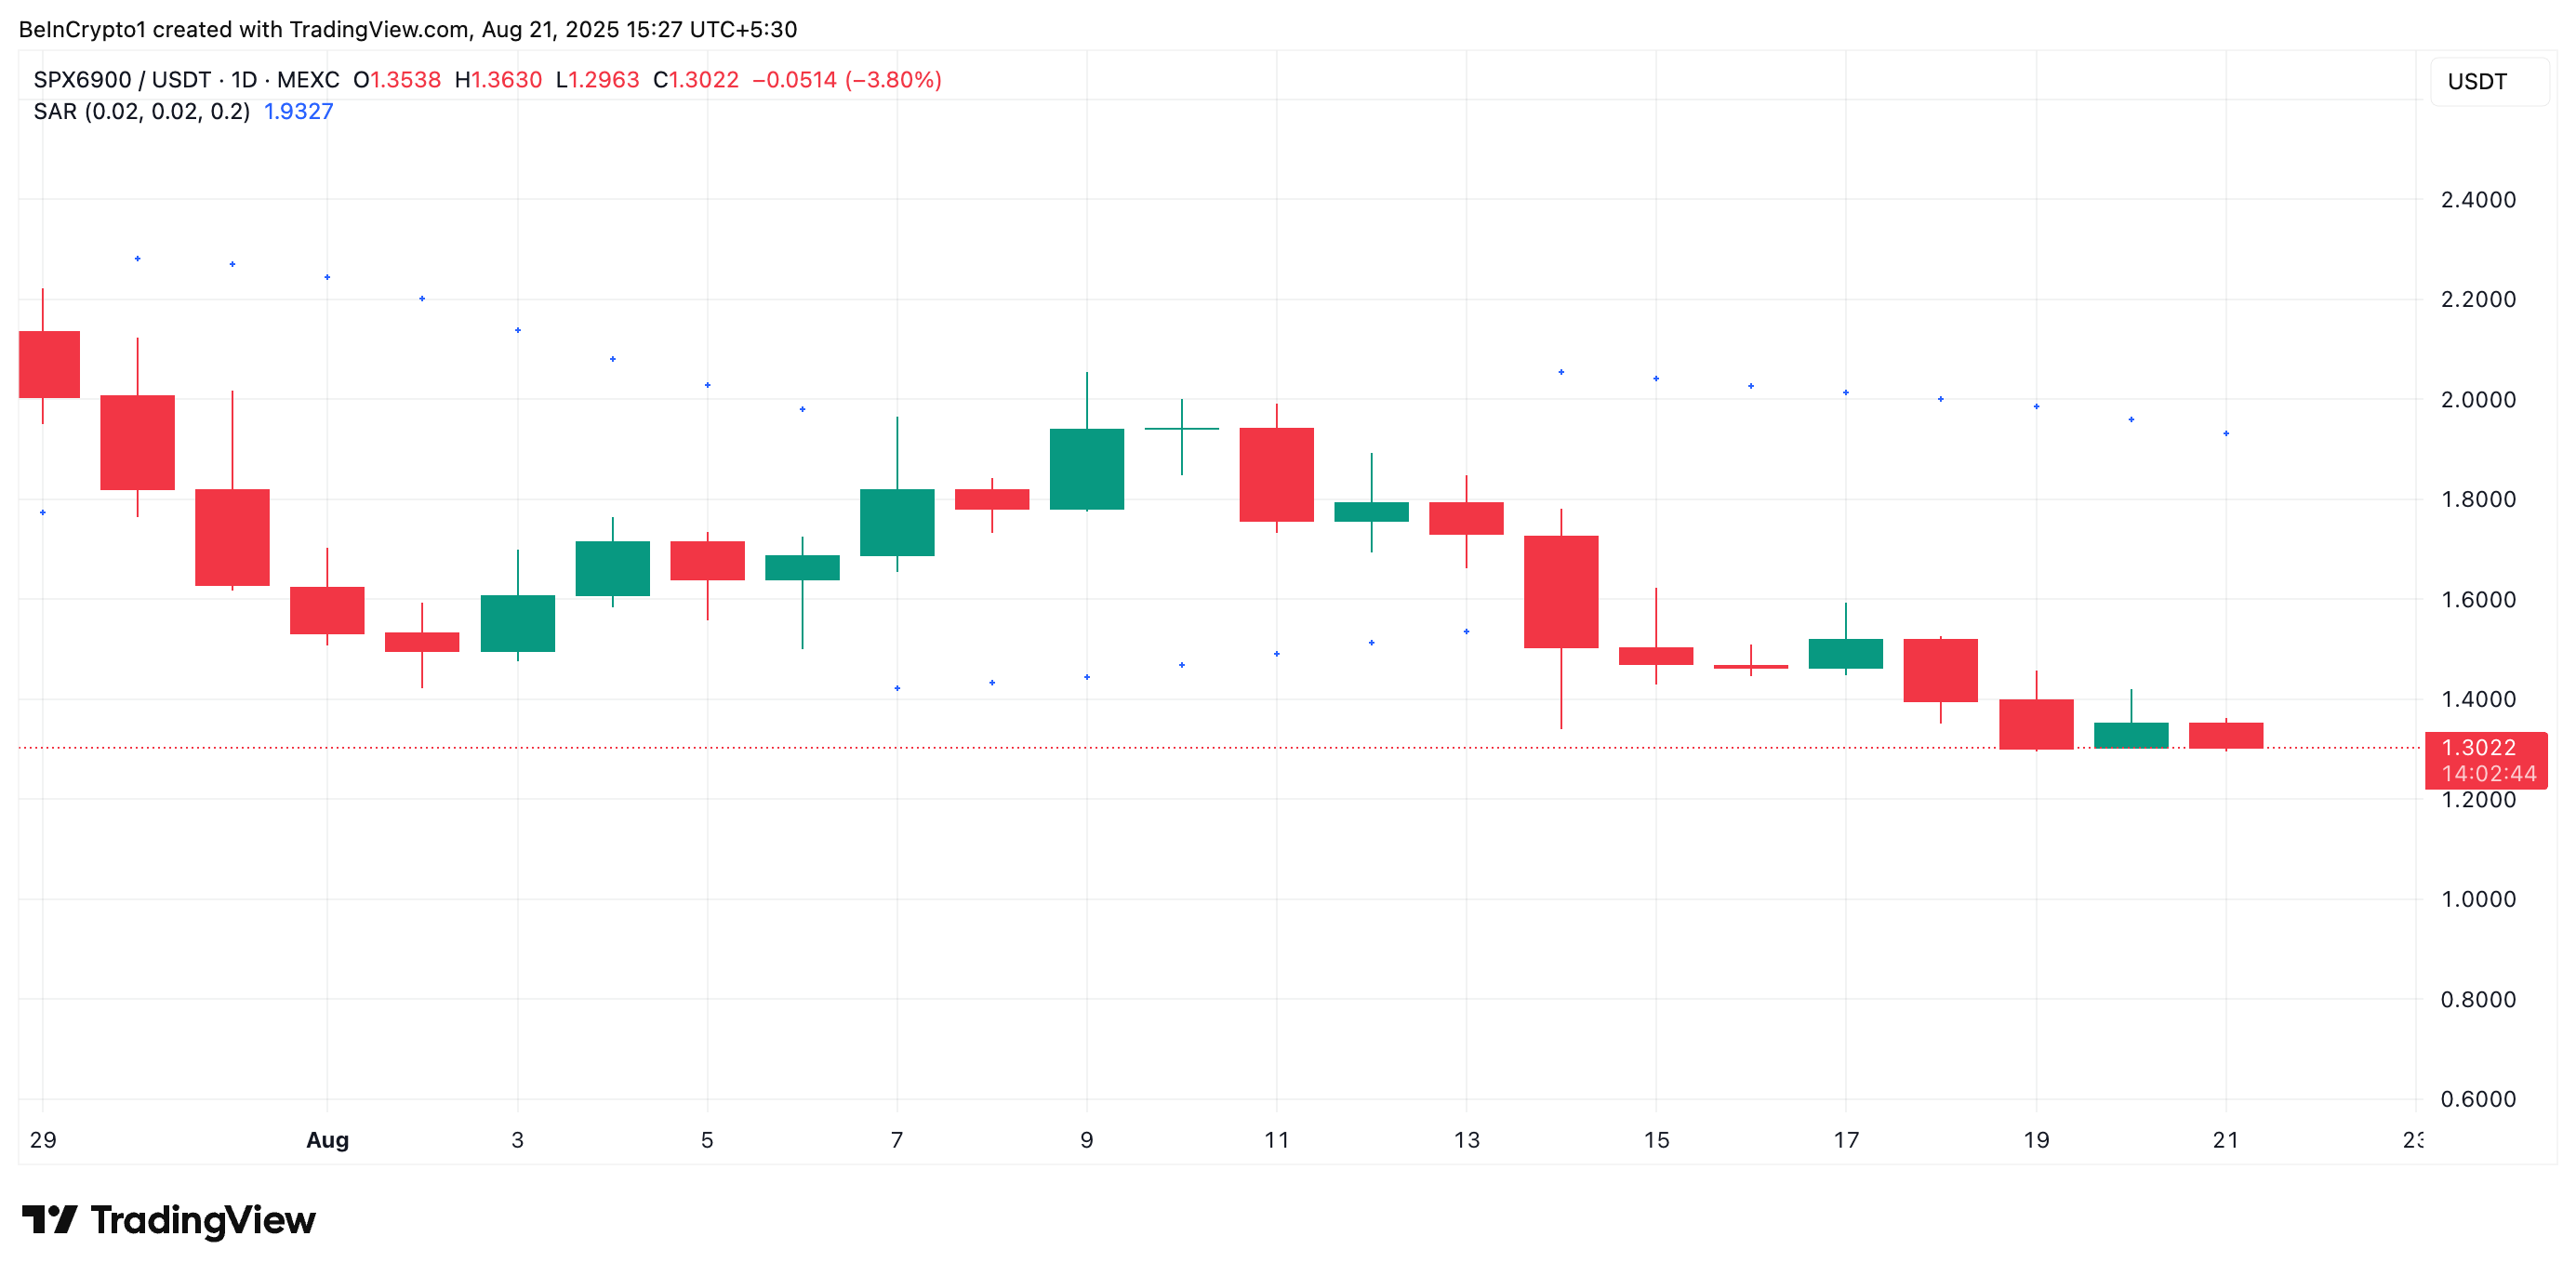
The Parabolic SAR indicator identifies an asset’s potential trend direction and reversals. When its dots are placed under an asset’s price, the market is in an uptrend. It indicates that an asset is witnessing bullish momentum, and its price could continue to rally if buying persists.
On the other hand, when the dots lie above an asset’s price, selling pressure is dominant. Traders often interpret this as a sell signal as it hints at a possible continuation of downward momentum.
SPX Could Slide to $1.19 if Selling Persists
SPX trades at $1.30 at press time, hanging above support formed at $1.27. If the decline deepens, the support floor could give way to a fall to $1.19.
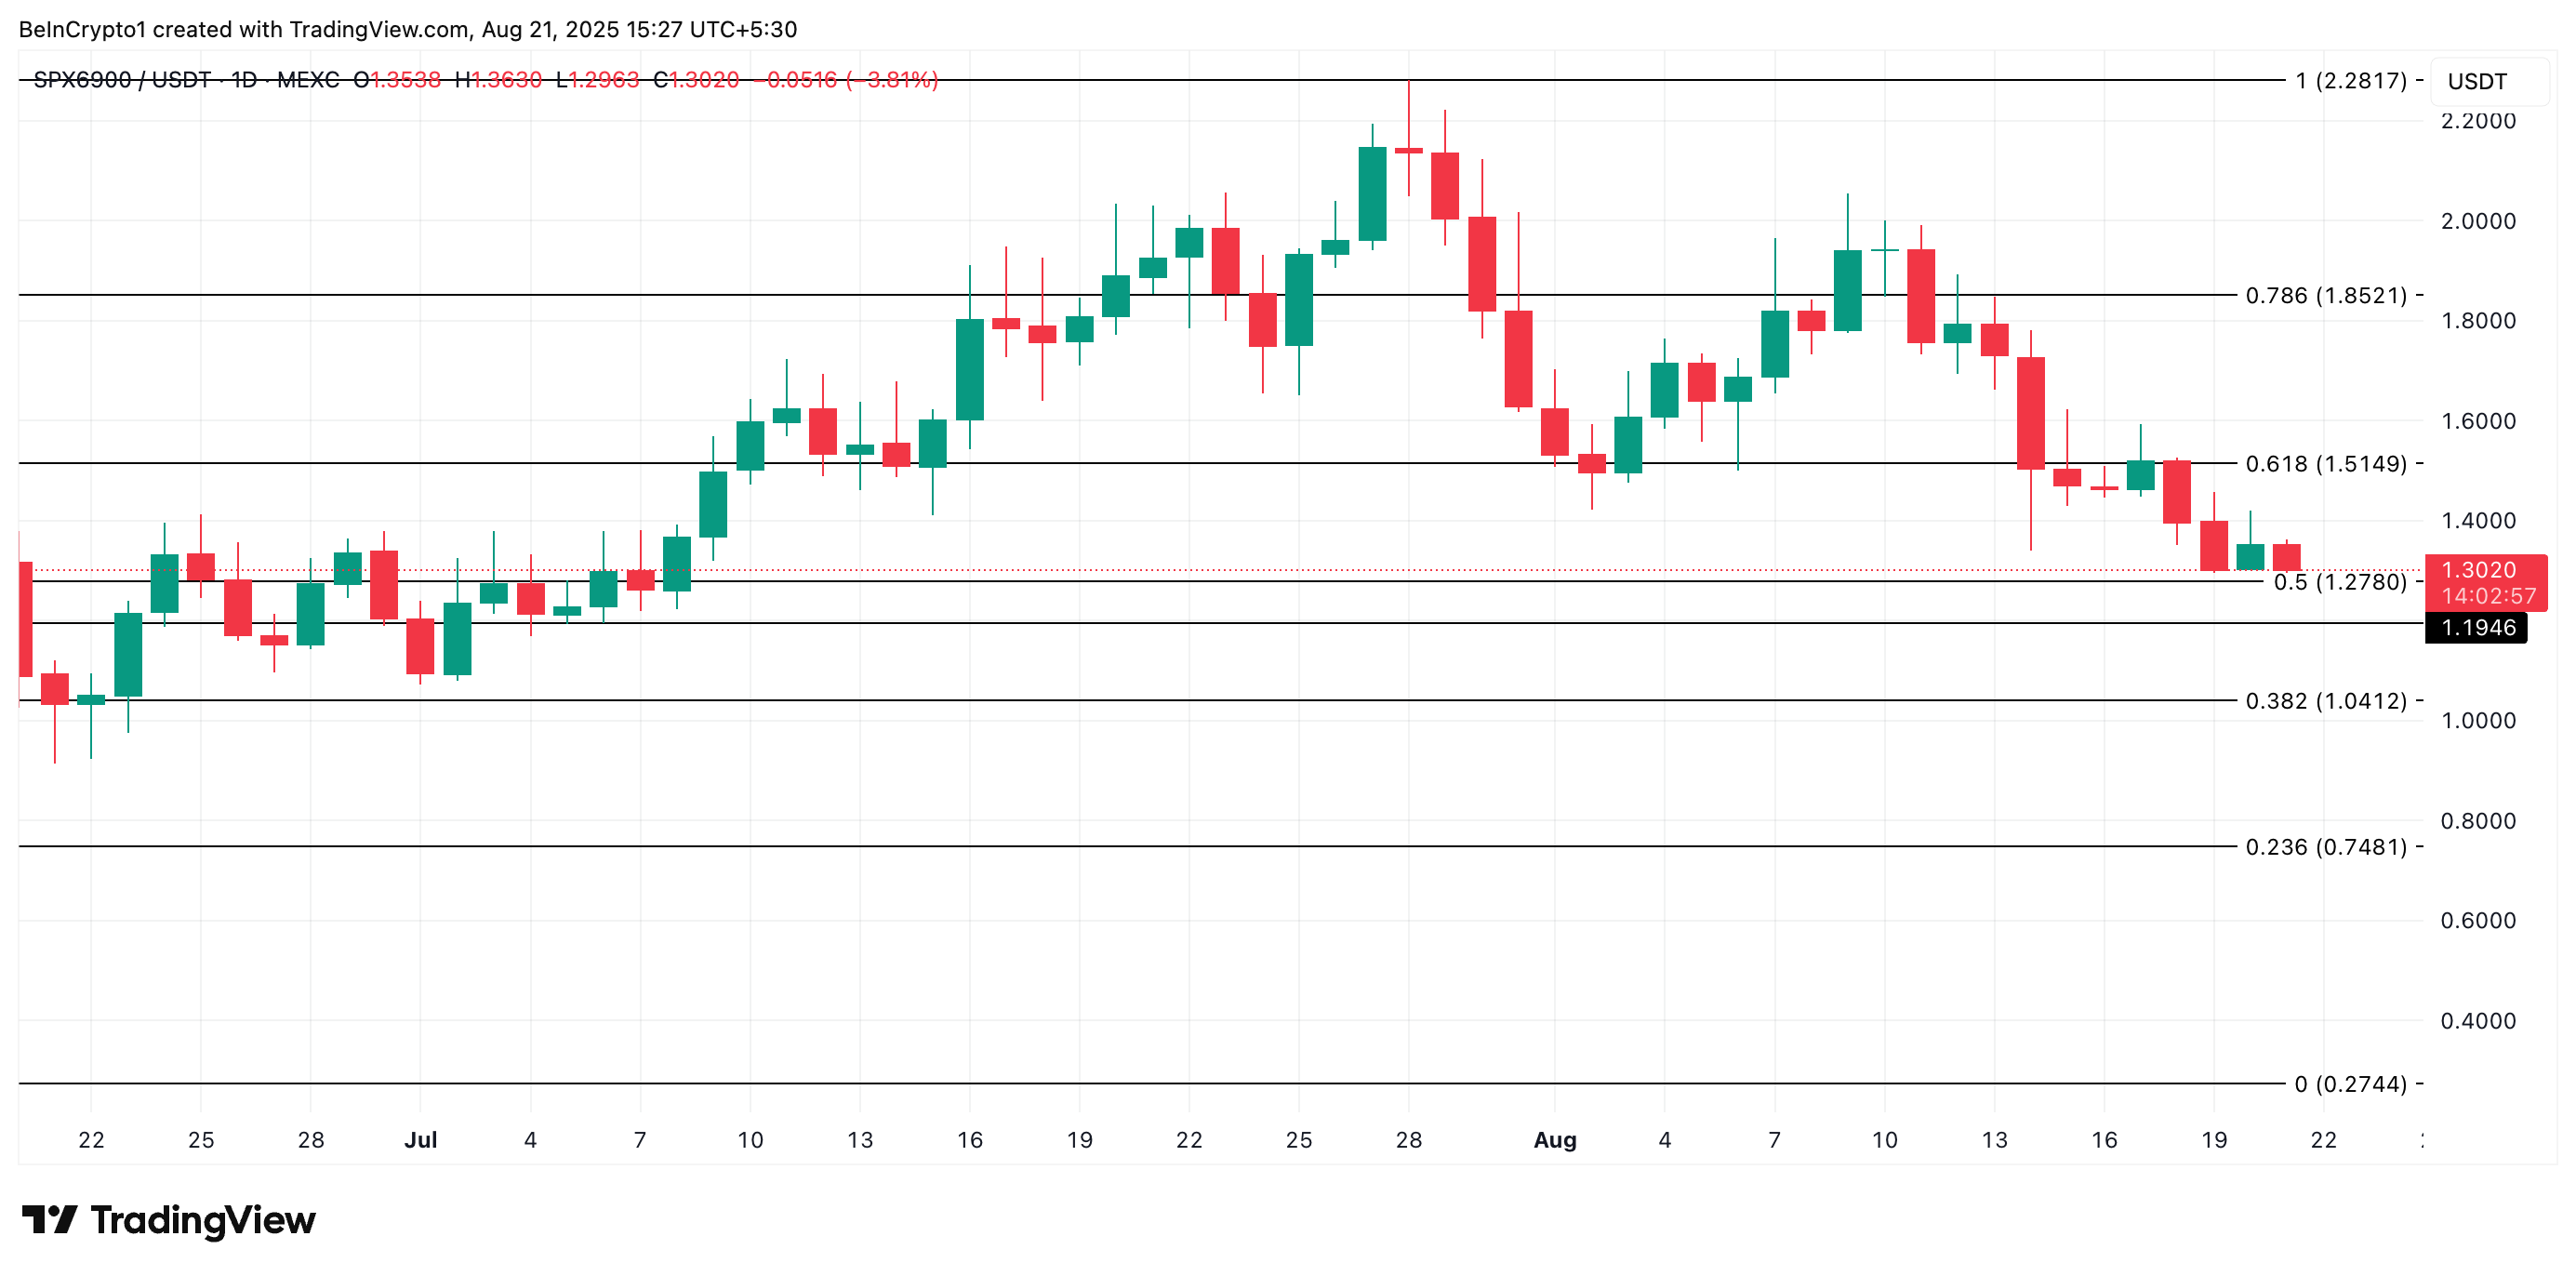
Conversely, a spike in accumulation could drive a rebound toward $1.51.
