


BeInCrypto takes a look at on-chain indicators, more specifically Spent Output Profit Ratio (SOPR) in order to determine if the current bull run will continue.
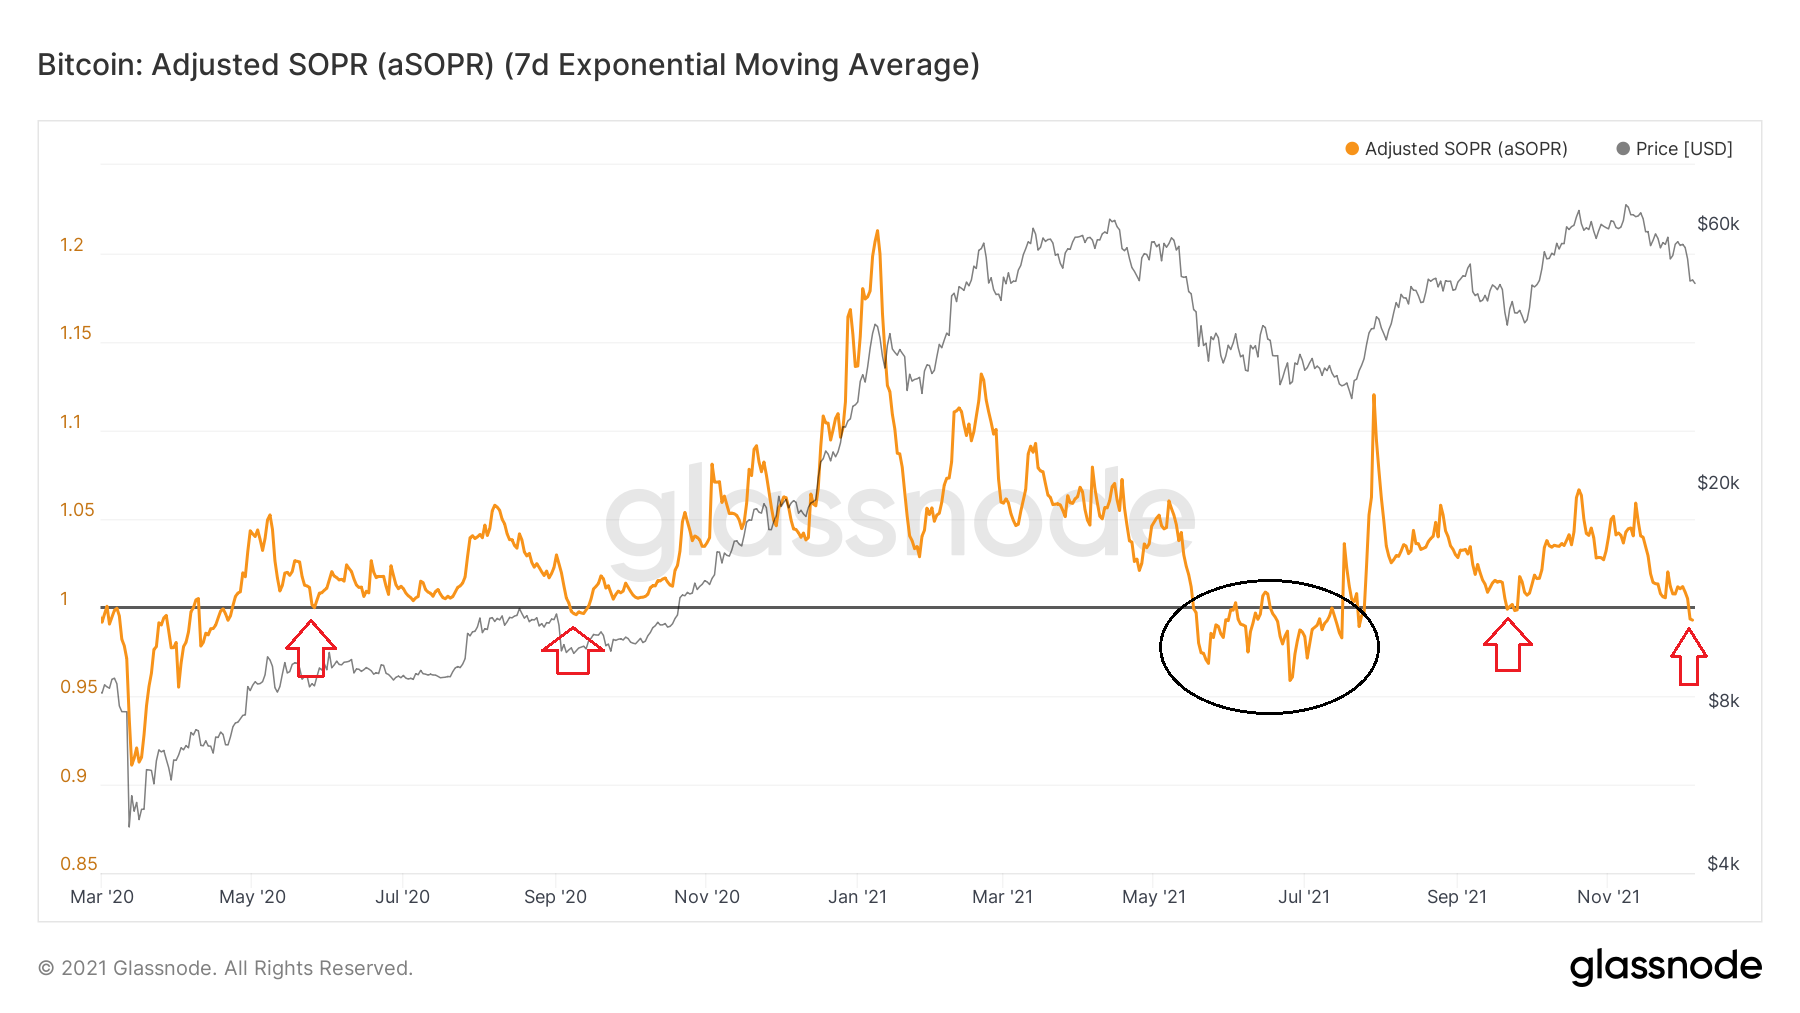
Current SOPR reading
SOPR is an indicator that measures if the state of the market is one of profit or one of loss. In order to derive its value, every buy price of each unspent transaction output (UTXO) is divided with every sell price.
Historically, the indicator has reached values between 0.9 and 1.35. A value of one means that the market is in a neutral state.
Currently, the indicator (orange) shows that the BTC market is in a state of profit, since it is above 1. Until it breaks down below it, a bearish trend reversal is not confirmed.
Since March 2020, SOPR has traded above the 1 line. This means that the market is in profit. There has been one deviation (black circle), which transpired between May – July.
Besides the deviation, there have been four touches (red icons) of the 1 line. Such touches are considered resets, since the market falls from a state of profitability to a neutral state.
In Sept, after the second touch, the BTC price became parabolic and nearly tripled in value until March.
After the ensuing drop and bounce, the second touch of the 1 line occurred on Dec 6.
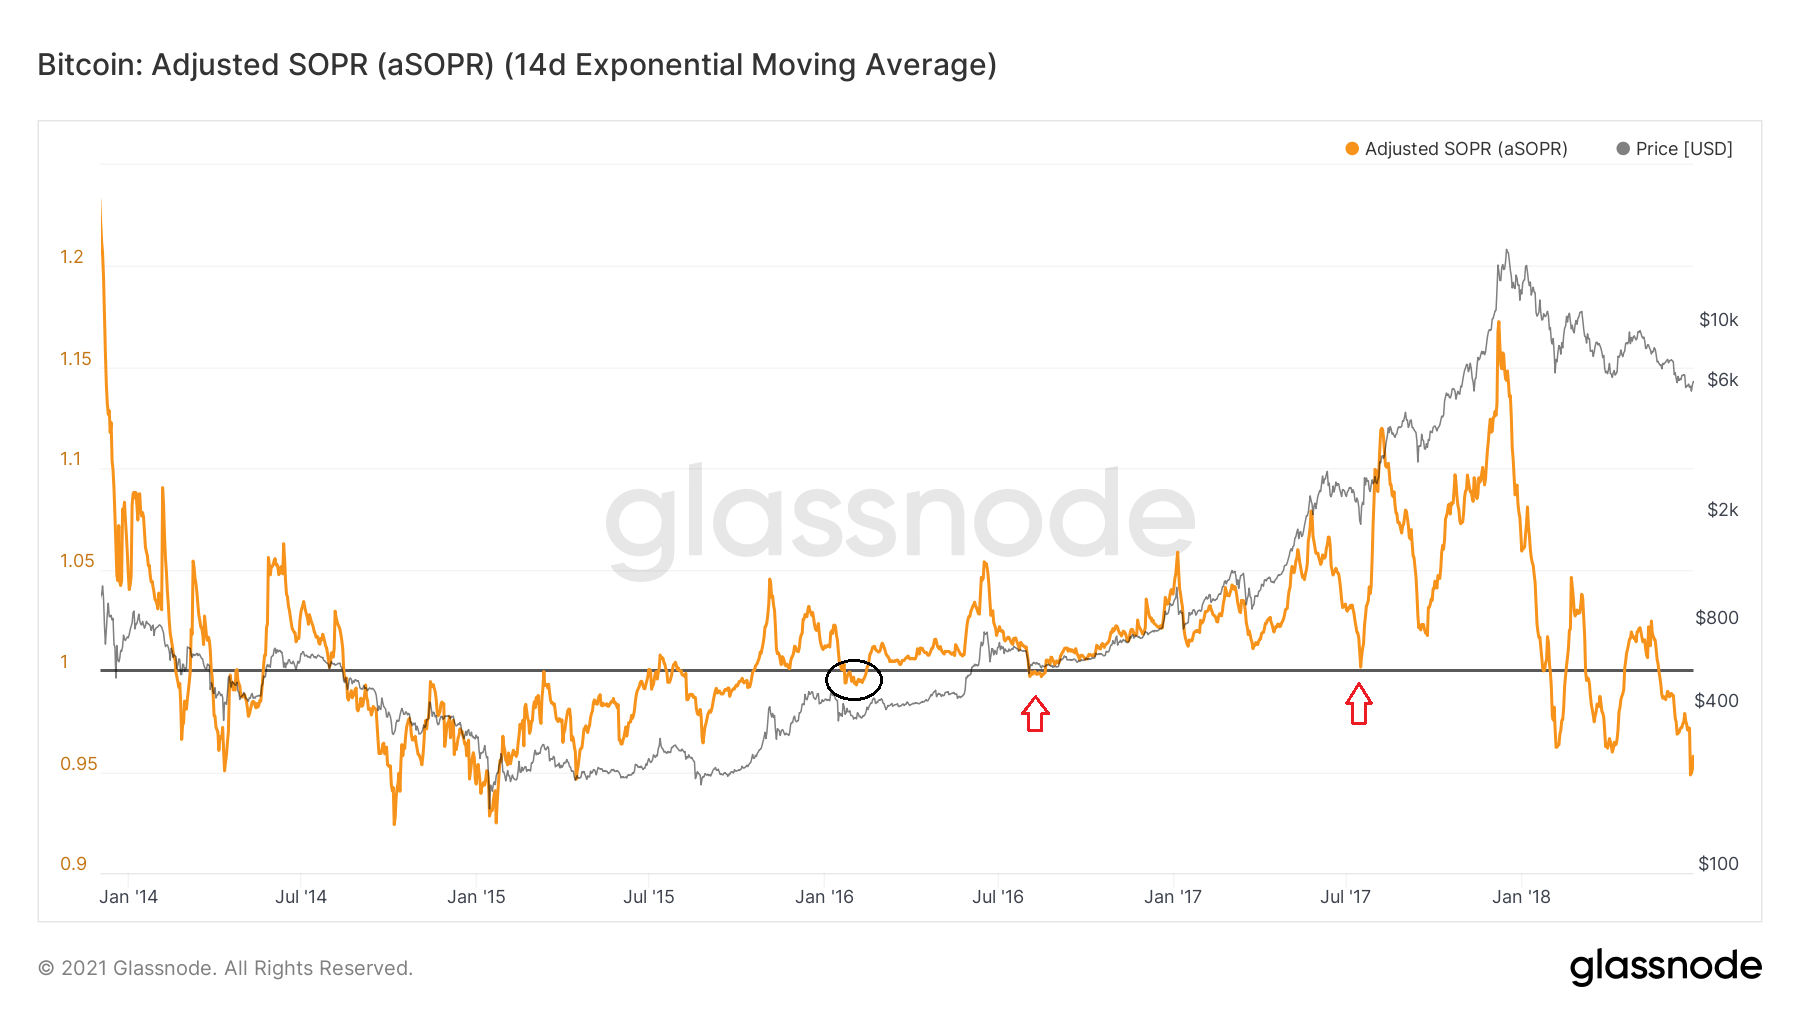
Historical values
In our previous SOPR article, it was stated that if SOPR fall back below the 1 line after reclaiming it, the increase can be considered a relief rally.
This is especially visible when looking at the movement in 2014-2017.
After the upward movement began, the indicator fell below the line once more in Jan – Feb 2016 (black circle). However, it only re-tested the line (red arrow) afterwards, but did not fall below it.
The next time it did was in Jan 2018, and marked the beginning of the two-year bear market.
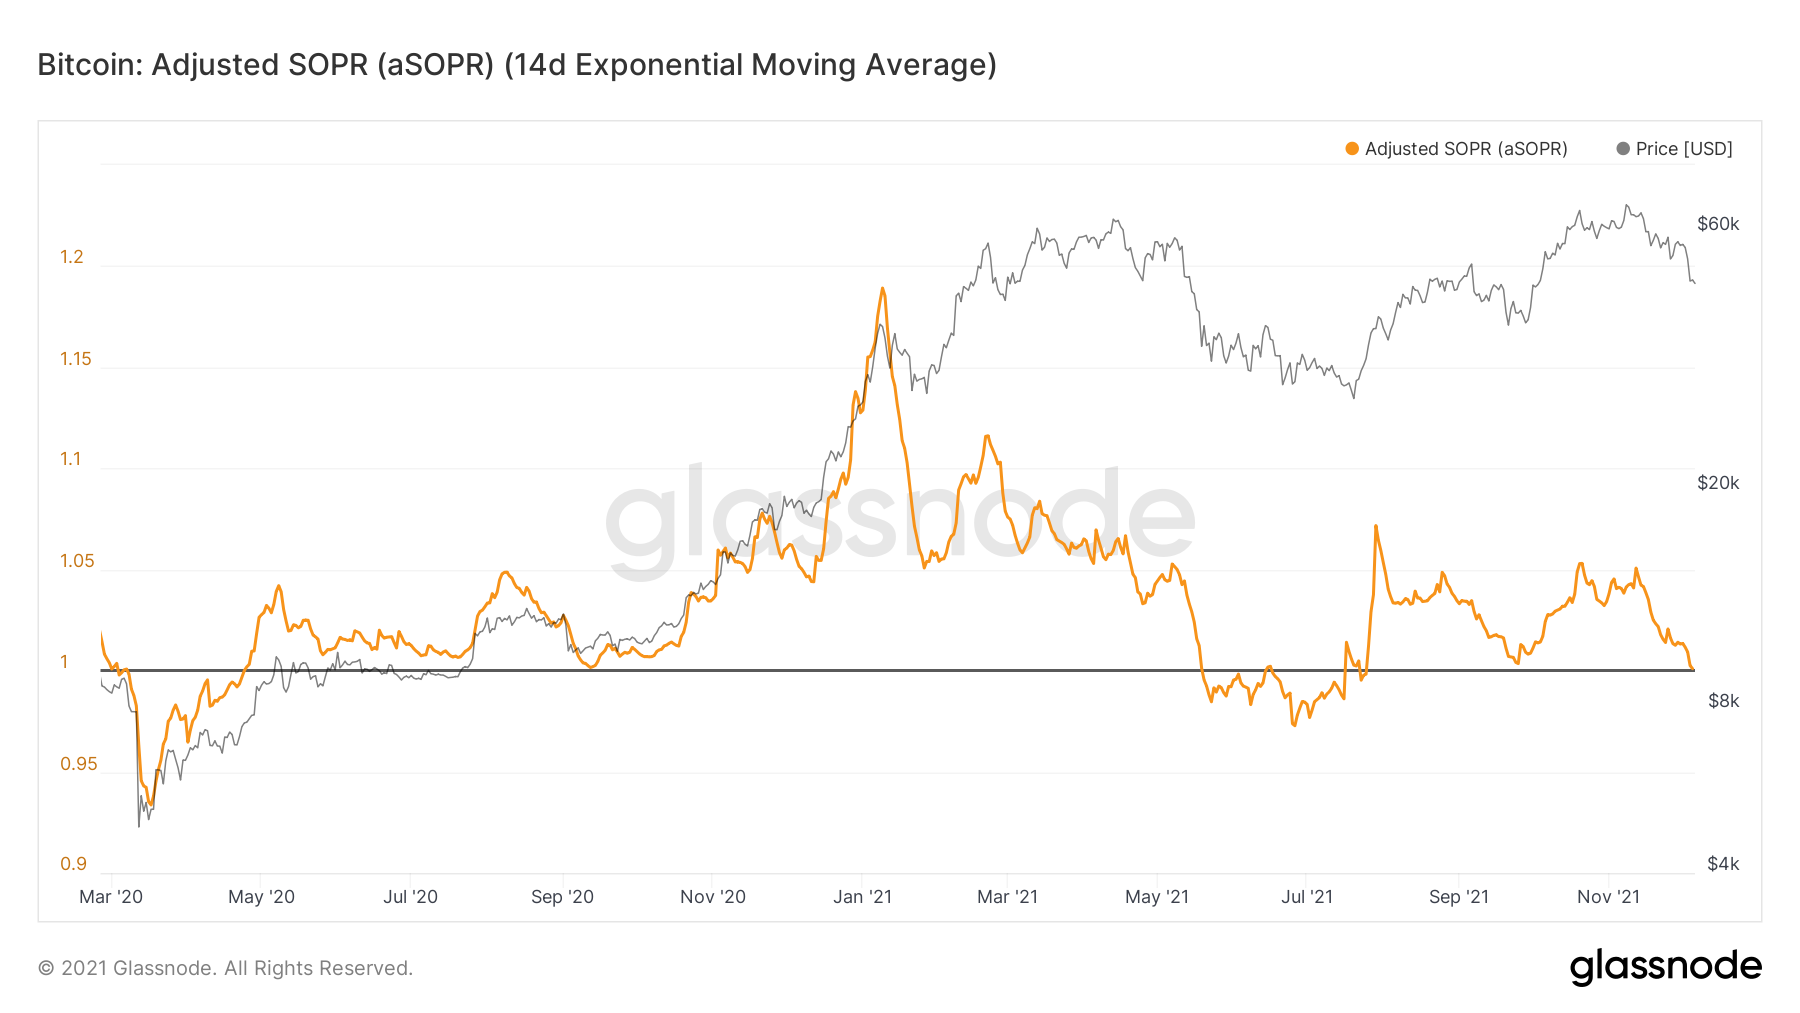
In the current upward movement, SOPR fell below the 1 line in May-July, but has reclaimed the line afterwards.
Therefore, in order for the current increase to not be considered a relief rally, it is crucial the SOPR holds above this line.
For BeInCrypto’s latest Bitcoin (BTC) analysis, click here.


