


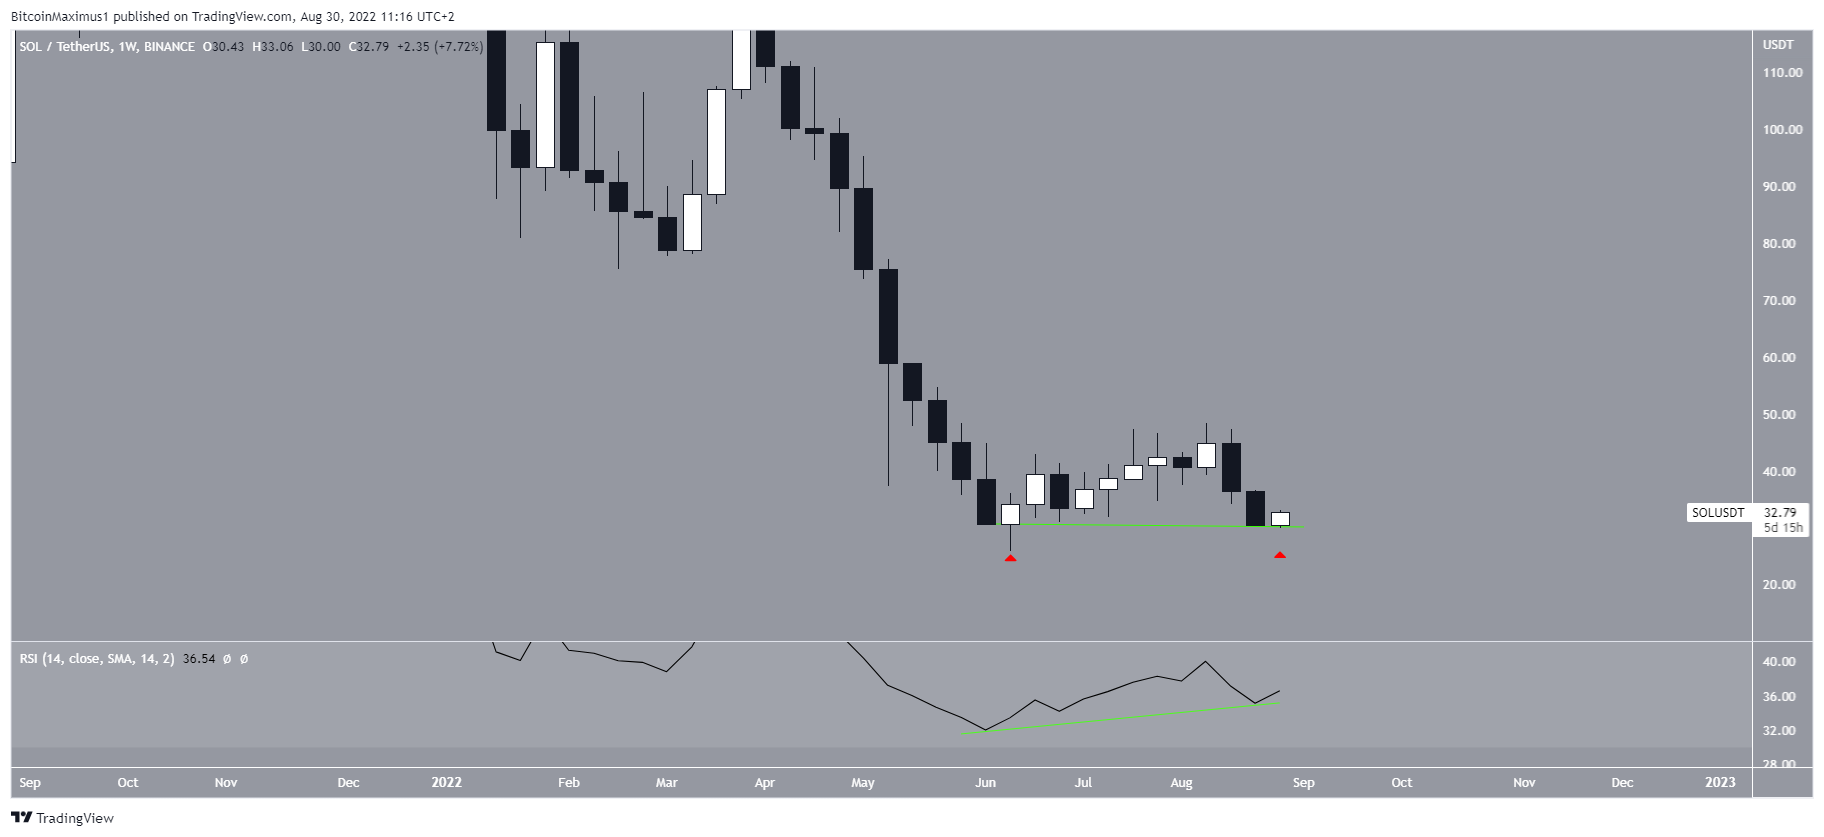
Solana (SOL) has broken down from an ascending wedge and is at risk of invalidating a long-term double bottom pattern. If this happens, the price would be expected to fall below its yearly lows at $25.86.
The weekly chart shows that SOL has nearly returned to its yearly low of $25.85, after seemingly initiating an upward movement in June. This movement has potentially created a double bottom pattern, which has also been combined with bullish divergence in the weekly RSI.
The price of blue chip SOL non-fungible tokens (NFTs) has also been increasing over the past two weeks, potentially preceding an increase in price.
However, the pattern has not yet been confirmed, since the second bottom has not been created, and could be invalidated with a continued decrease.
SOL breaks down
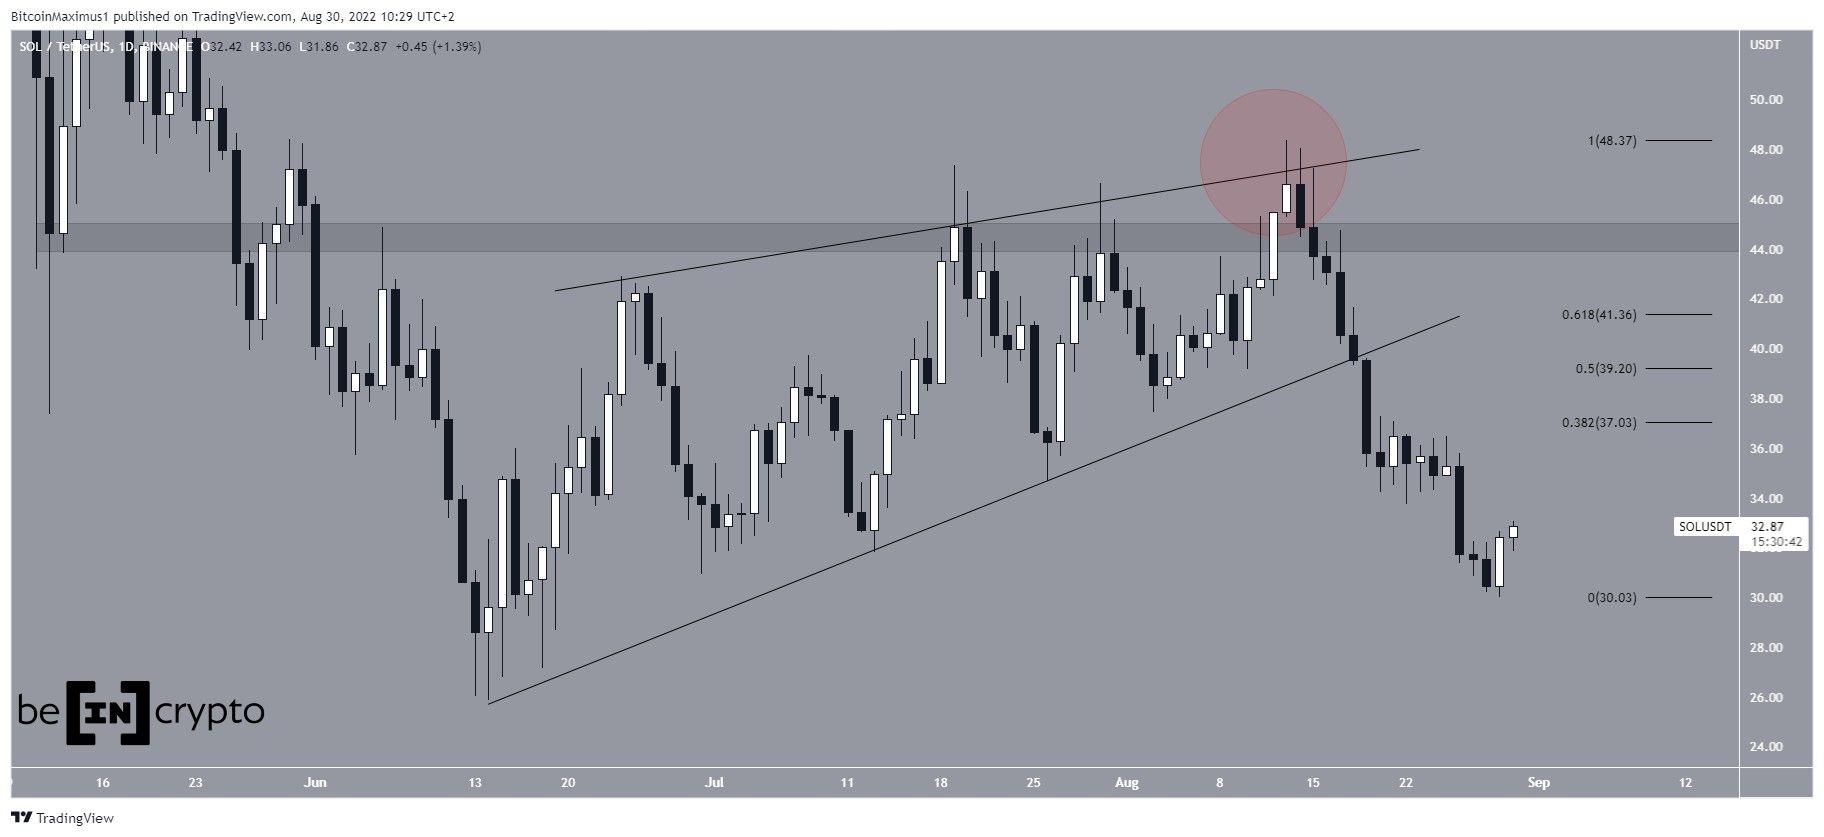
Despite the potential long-term bullish pattern, the daily chart provides a bearish outlook. The price had been increasing inside an ascending wedge since reaching a bottom on June 14. The ascending wedge is considered a bearish pattern, meaning that an eventual breakdown from it would be expected.
On Aug 14, the price reached the resistance line of the pattern and seemingly moved above $44.50 (red circle).
However, it was rejected by the resistance line and the purported breakout turned out to only be a deviation.
SOL has been decreasing since and broke down from the wedge on Aug 18. The price reached a low of $30 on Aug 29. It created a bullish engulfing candlestick and has been increasing since.
If the upward movement continues, the main resistance levels would be at $37, $39.20 and $41.40. These are the 0.382, 0.5 and 0.618 Fib retracement resistance levels, respectively.
Wave count analysis
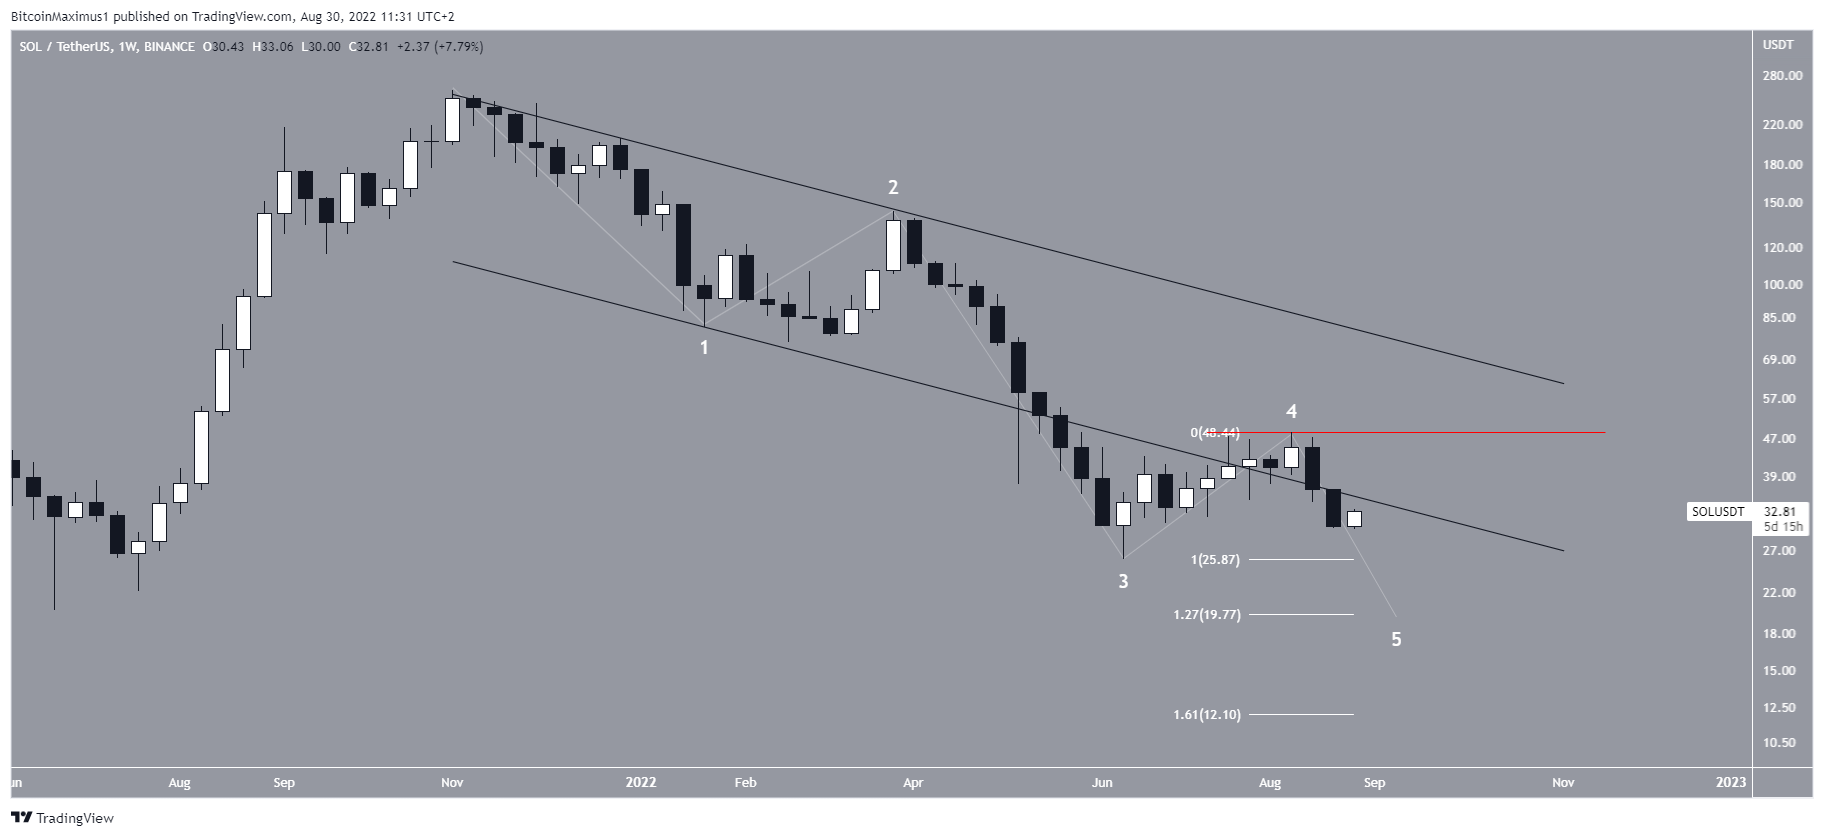
Finally, the wave count suggests that the price has been mired in a five-wave downward movement since the all-time high price in Nov 2021.
If so, it is currently in wave four, potentially completing a fourth-wave pullback. Then, the two main targets for the bottom of the move would be at $19.77 and $12.10, created by the 1.27 and 1.61 external Fib retracement levels, respectively.
An increase above the wave four high at $48.38 (red line) would invalidate this particular wave count.
For Be[in]Crypto’s latest Bitcoin (BTC) analysis, click here


