


The Solana (SOL) price deviated above a short-term resistance area suggesting that new lows will soon follow.
On Feb. 26, the Solana network had an unresolved technical issue, which prevented users from completing transactions on the mainnet. It lasted for 24 hours. However, the network is now fully operational.
Solana (SOL) Fails to Break Out
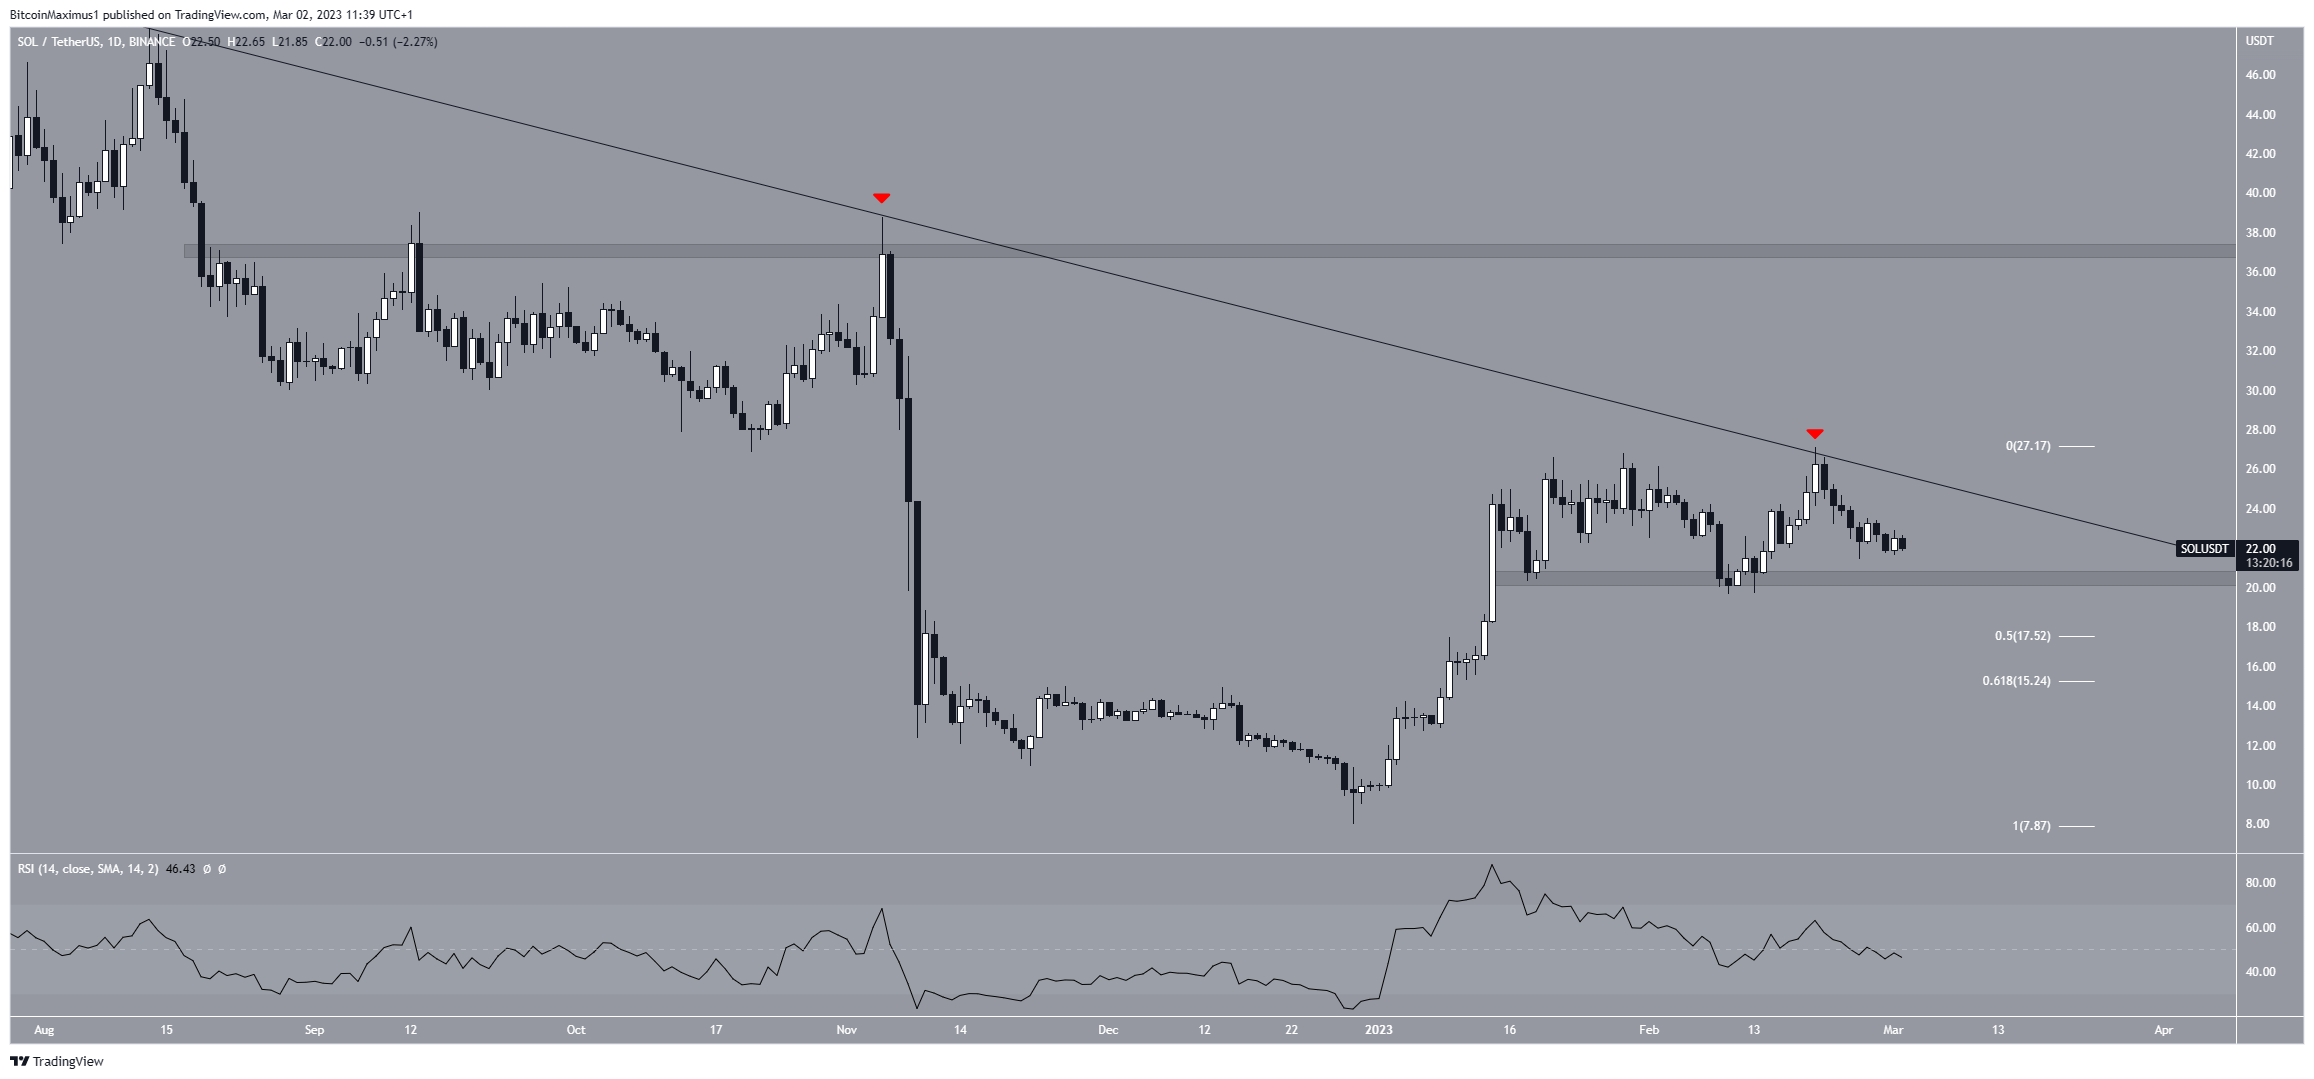
The Solana price has decreased under a descending resistance line since August 2022. More recently, the line rejected the price on Feb. 20 (red icon). The price has fallen since and is approaching the $20 horizontal support area, which has been in place since Jan. 14.
The daily RSI reading has fallen below 50, a sign of a bearish trend. Therefore, if the SOL price breaks down from the $21.50 support area, it could fall to the closest Fib retracement support level at $17.50.
A breakout from the descending resistance line would invalidate this bearish forecast. In that case, the SOL price could increase to the next resistance at $36.
Solana (SOL) Price Deviates Above Range High
The technical analysis from the six-hour chart provides a bearish outlook. The price deviated above the $26 resistance area (red icon) before falling below it. The deviation also coincided with the rejection from the descending resistance line.
Considerable downward movements often follow these deviations. As a result, they suggest that a breakdown from the closest support area at $21.50 is expected. In that case, the SOL token could fall to the 0.5 Fib retracement support. This would be the lowest price since early January.
Since the $26 area also coincides with the descending resistance line, a breakout above it would invalidate the bearish hypothesis and instead suggest that the trend is bullish.
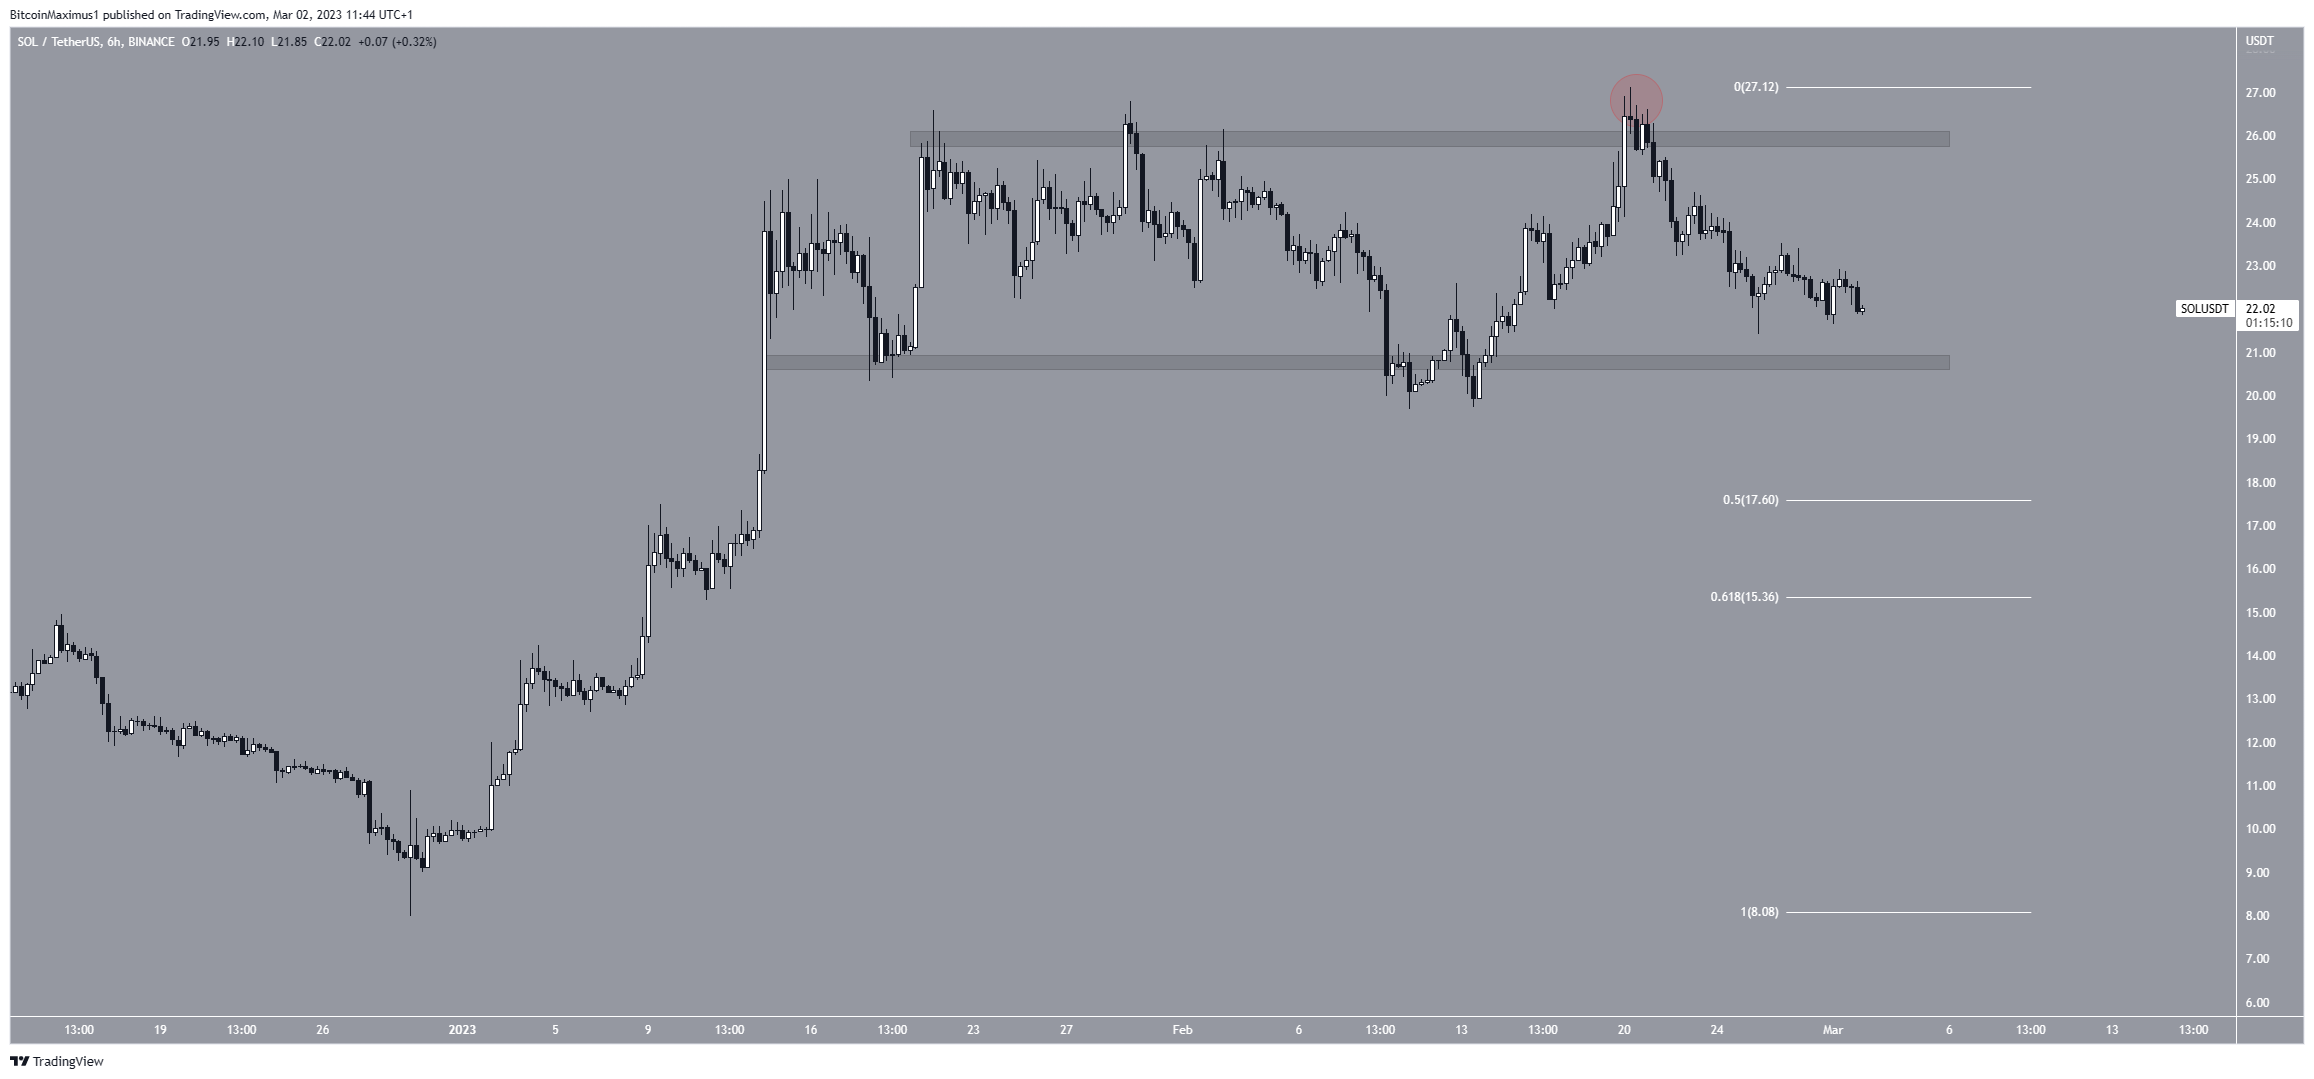
To conclude, the most likely Solana price forecast is a drop to the 0.5 Fib retracement support level at $17.60. After the decrease is done, the upward movement could continue.
On the other hand, a breakout from the long-term descending resistance line would invalidate this bearish forecast. In that case, SOL could increase to $37.
For BeInCrypto’s latest crypto market analysis, click here.



