


Despite being in a long-term downward trend, Solana (SOL) has created a bullish pattern above an important support area.
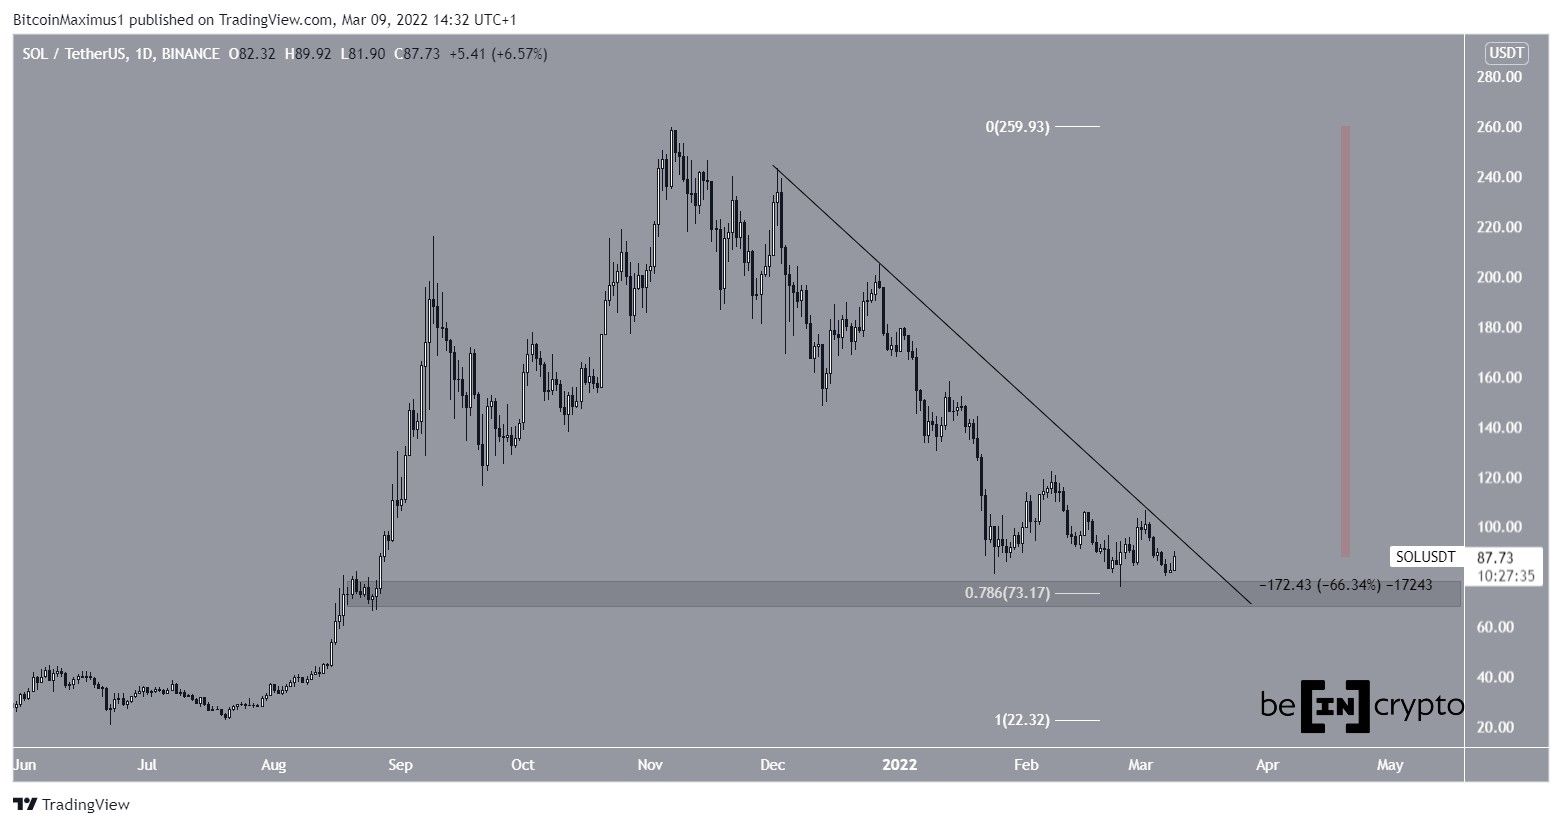
SOL has been decreasing since reaching an all-time high price of $259.90 on Nov 6. Throughout the decrease, it has been following a descending resistance line, which was most recently validated on March 2.
So far, the price has reached a low of $75.35 on Feb 2. The ensuing bounce served to validate the $73 area as support. This is both the 0.786 Fib retracement support level and a horizontal support area.
Currently, SOL is trading 66% below its all-time high price.
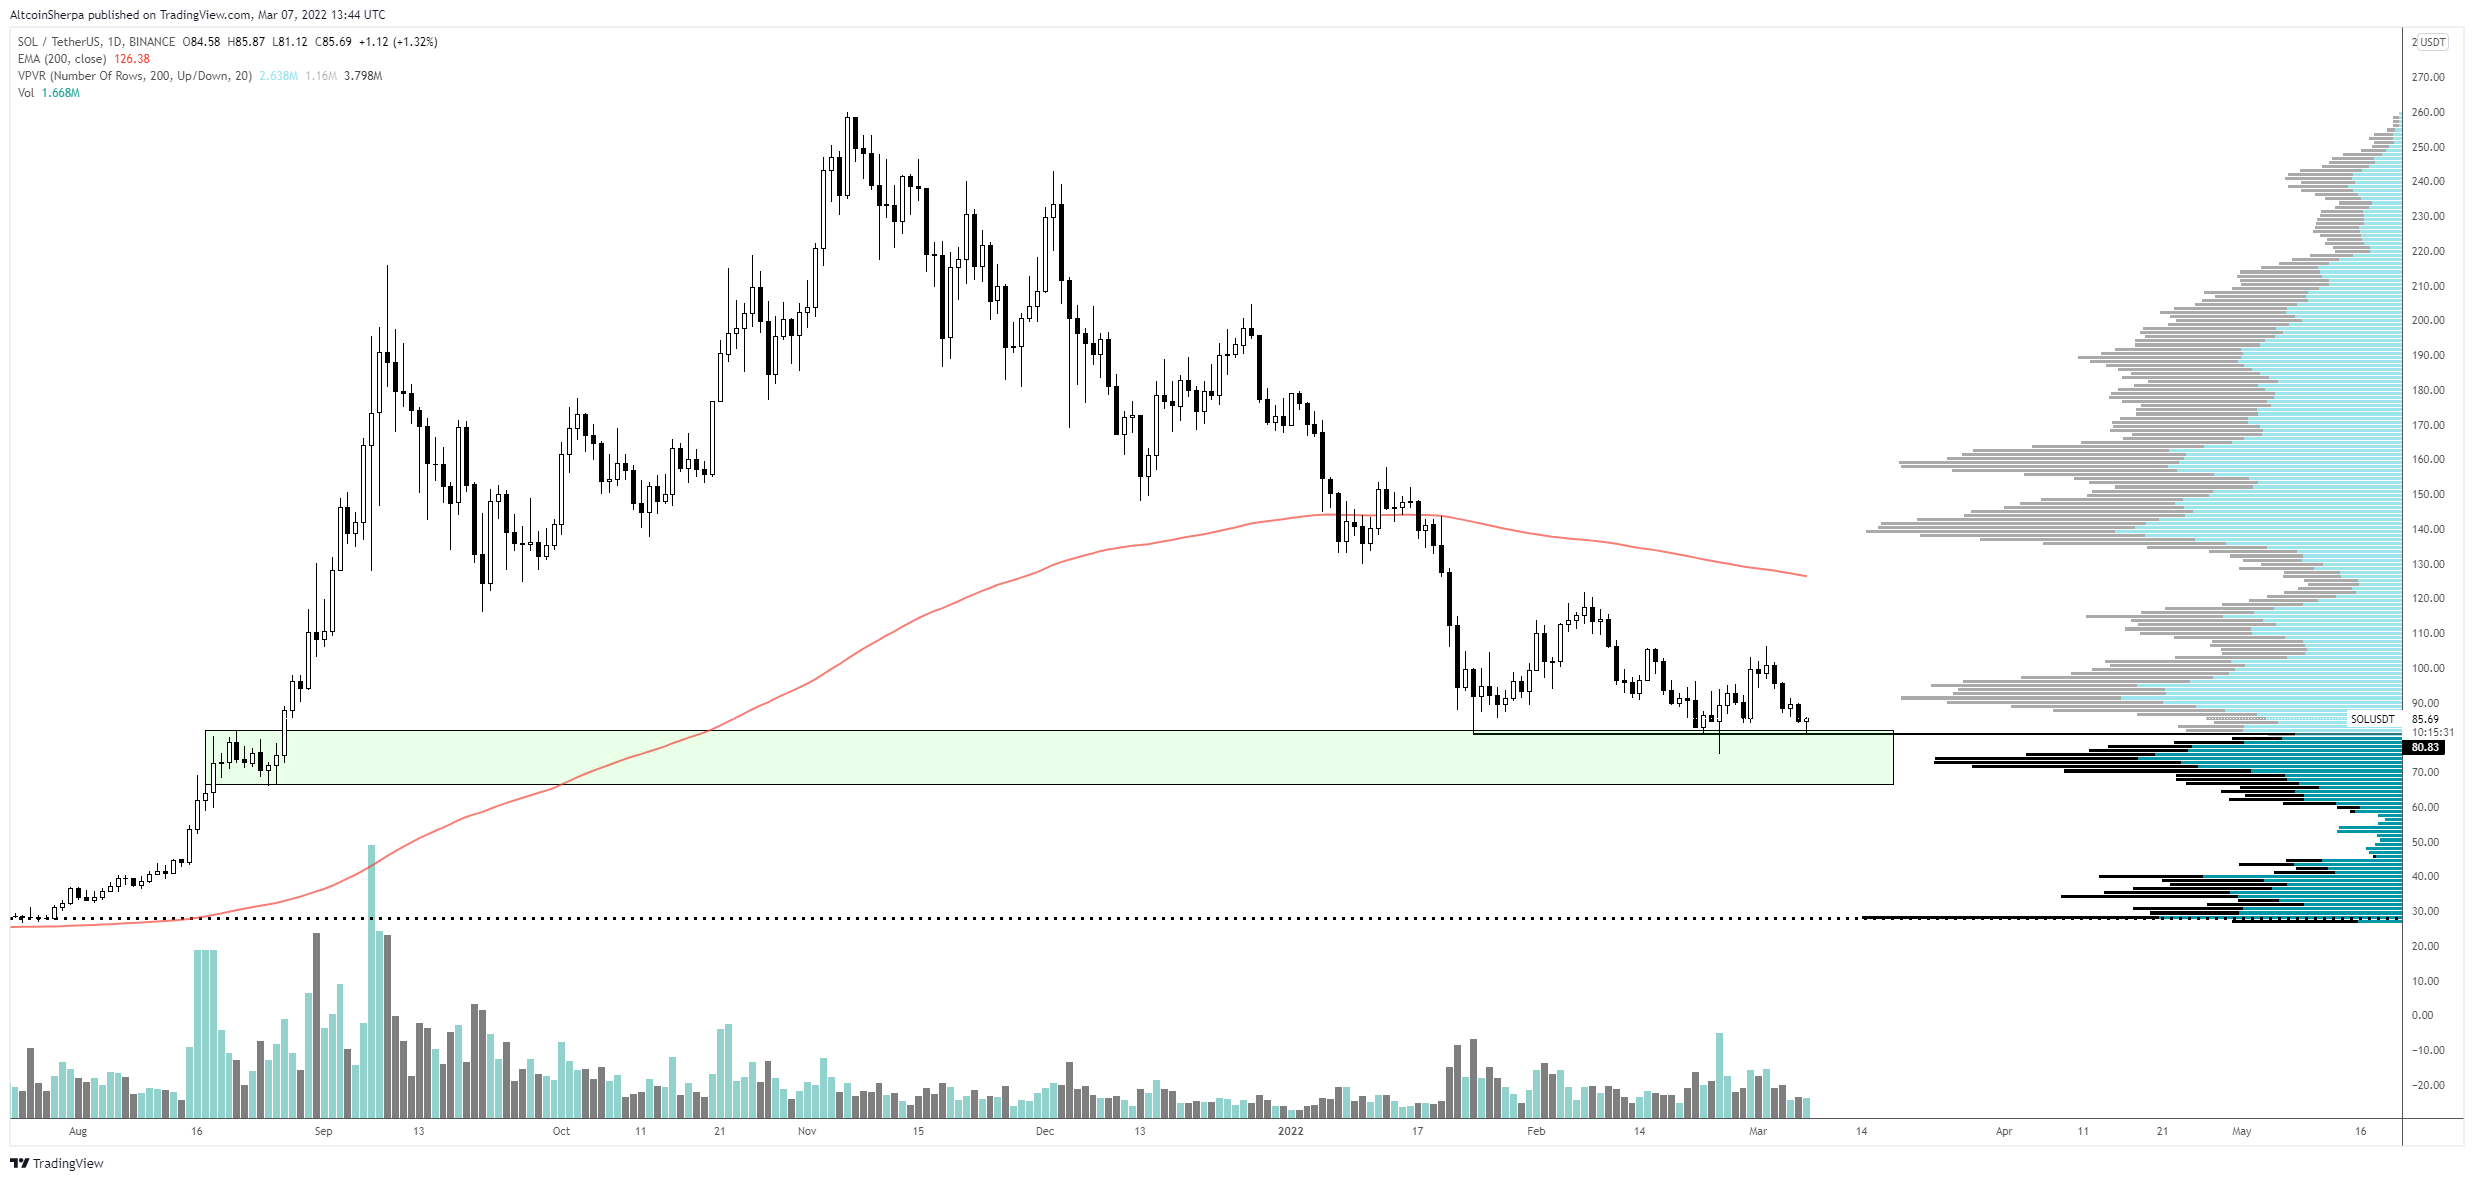
Cryptocurrency trader @Altcoinsherpa tweeted a SOL chart which shows that the price is trading above strong support between $70-$90. The area coincides with the 0.786 Fib retracement support level.
Potential SOL breakout
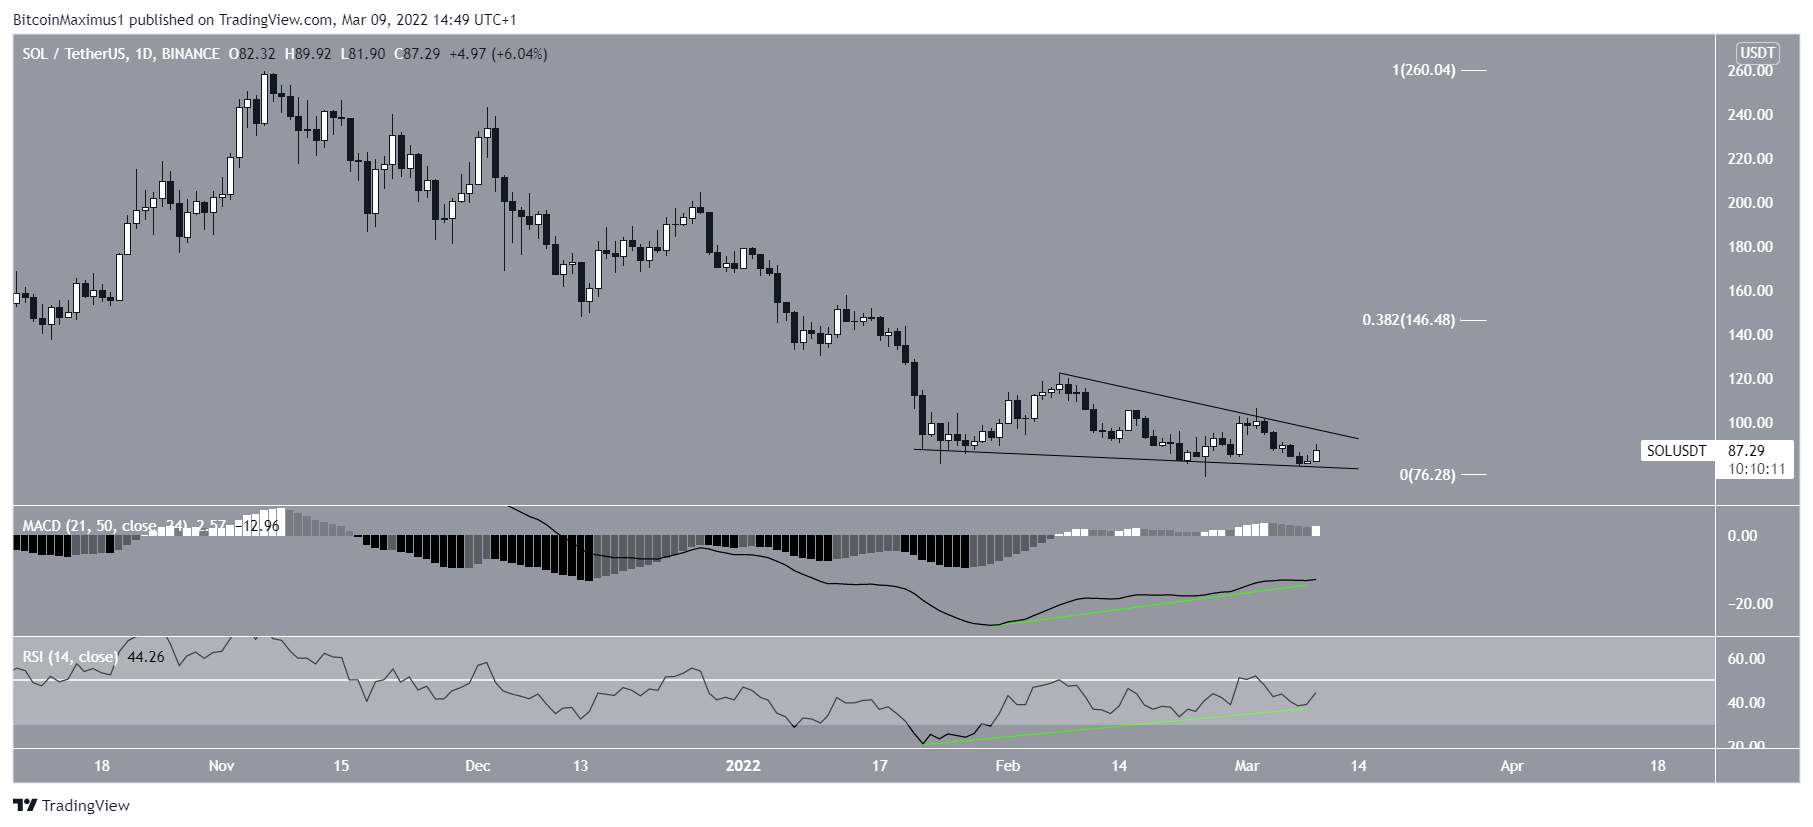
The daily chart suggests that SOL will bounce and break out from the long-term descending resistance line.
The reason for this is that the price is trading inside a descending wedge, which is considered a bullish pattern.
Furthermore, the wedge has been combined with bullish divergences in both the RSI and MACD (green lines). Such readings often precede bullish trend reversals. However, the former is below 50 and the latter is still negative.
If a breakout does occur, the closest resistance area would be at $146, created by the 0.382 Fib retracement resistance level. This would also cause the MACD and RSI to move into bullish territory.
Short-term movement
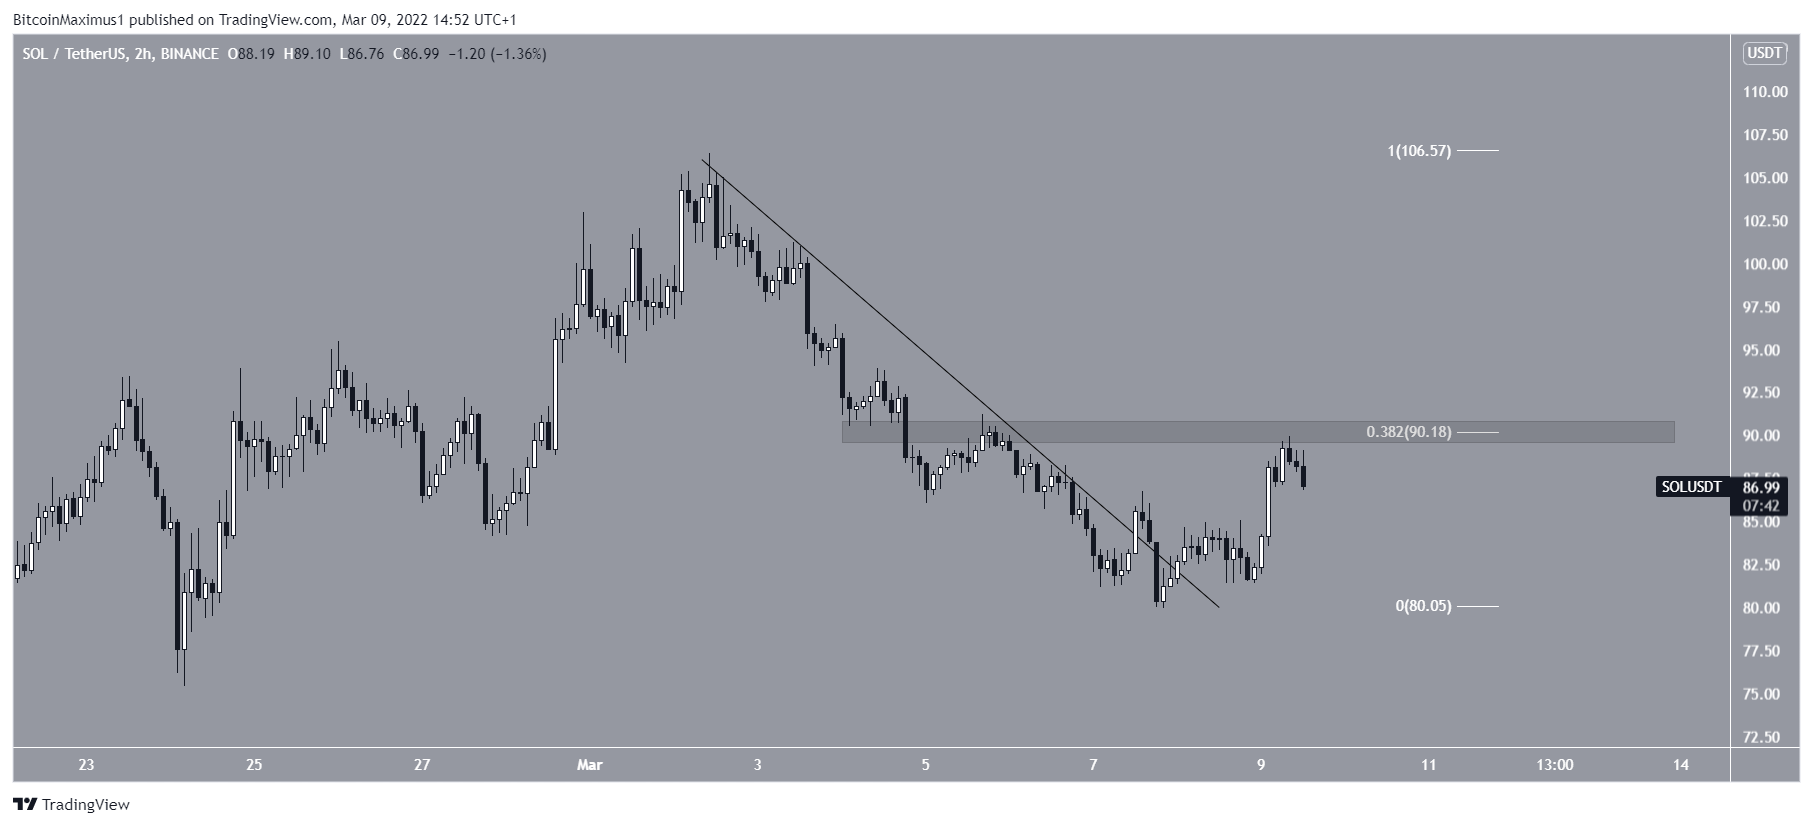
Finally, the two-hour chart shows that SOL has broken out from a descending resistance line.
However, it is struggling to reclaim the $90 resistance area. This is both a horizontal and a Fib resistance level.
A movement above it would go a long way in suggesting that the previously outlined long-term upward movement has begun.
For BeInCrypto’s previous Bitcoin (BTC) analysis, click here


