


The Solana (SOL) network is in the midst of a massive exploit in which $6 million has been drained so far. The price has also created a short-term double top pattern.
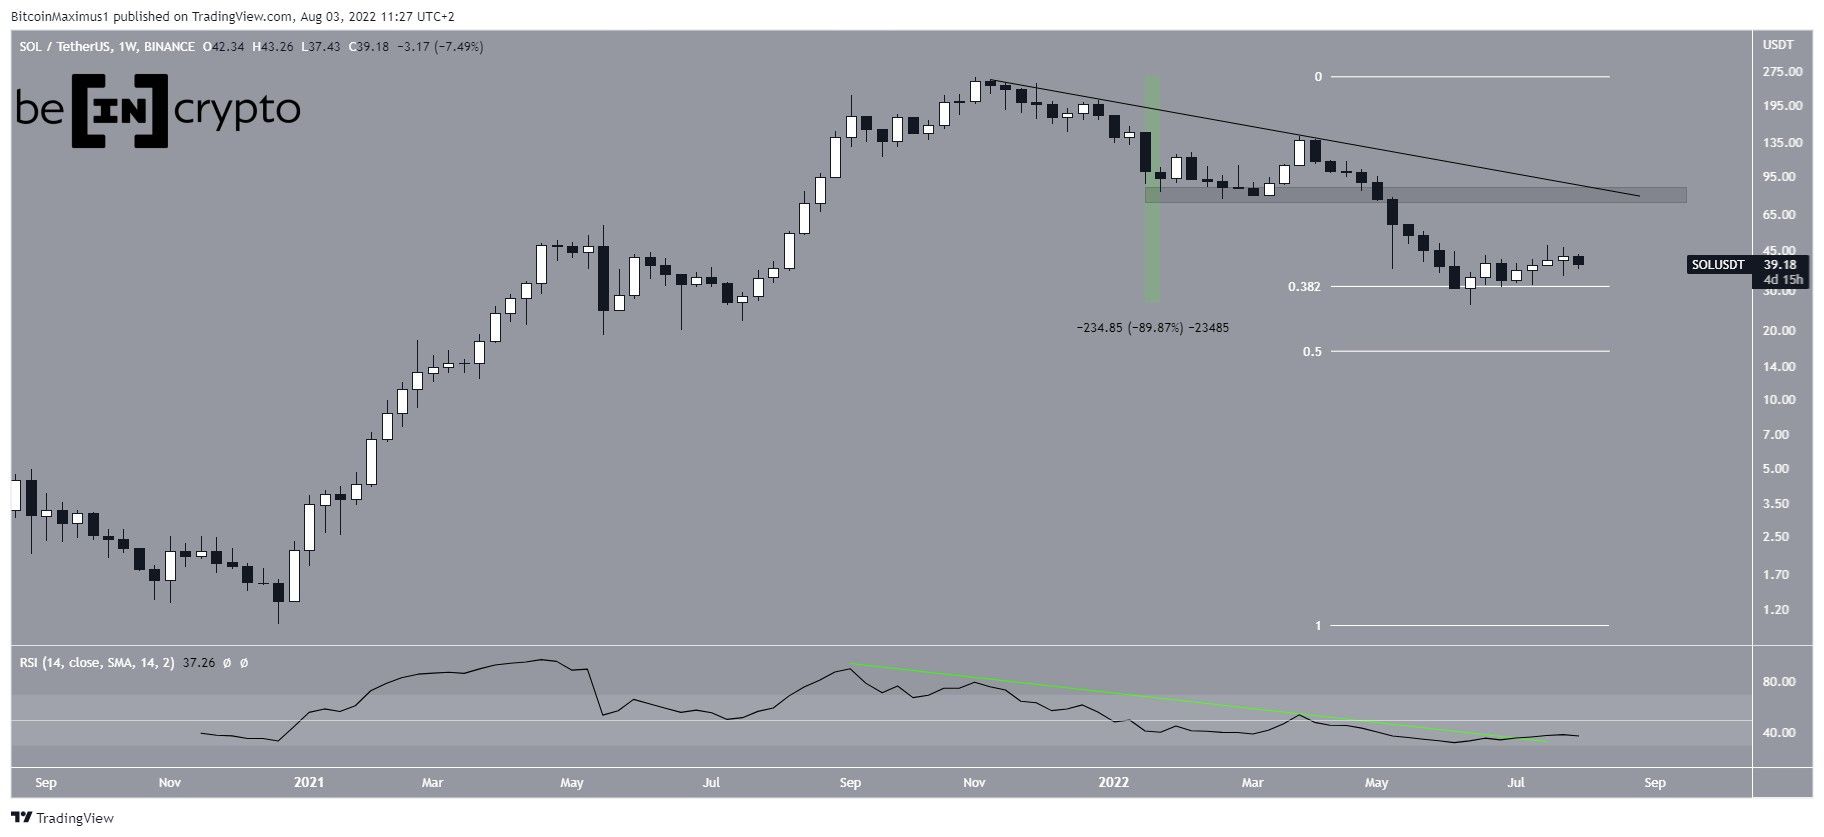
SOL has been falling since reaching an all-time high price of $259 in Nov. The downward movement has so far led to a low of $25.86 last month. This was a decrease of 90% when measuring from the all-time high price.
The price bounced afterwards (green icon), once it reached the 0.382 Fib retracement support level.
Interestingly, the weekly RSI has broken out from its bearish divergence trend line (green line). However, it has not generated any bullish divergence and is still below 50.
Additionally, it is possible that SOL has been following a descending resistance line since the all-time high. If so, the line would coincide with the $80 horizontal resistance area.
Ongoing SOL bounce
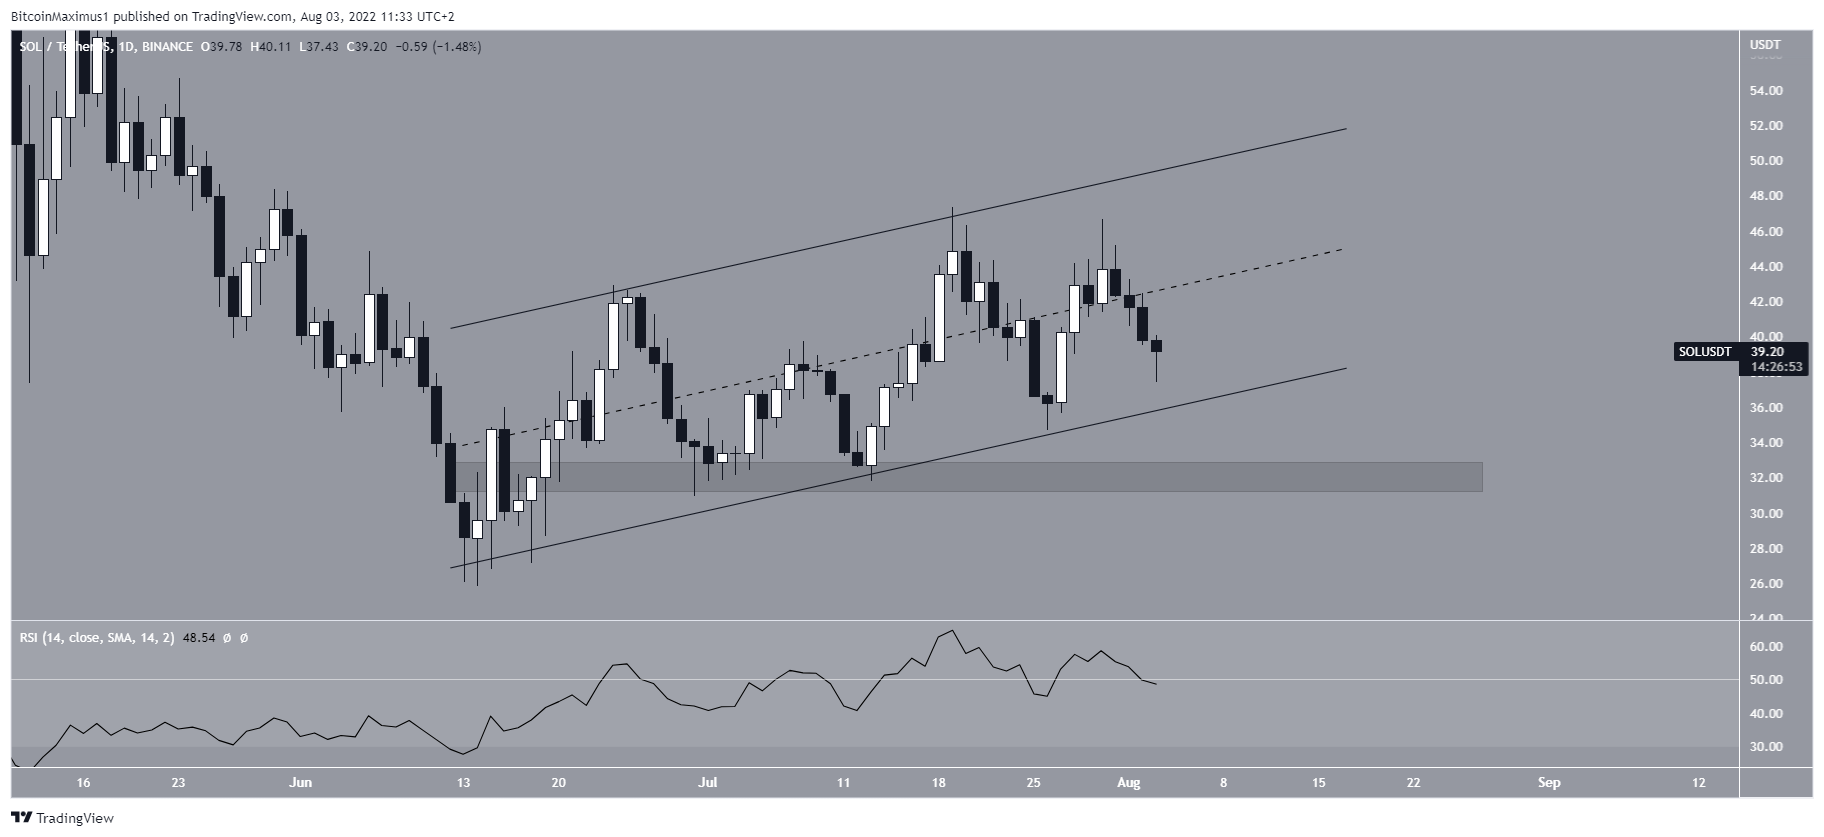
The daily chart shows that SOL has been increasing inside an ascending parallel channel since June 13. Ascending parallel channels usually contain corrective patterns, meaning that an eventual breakdown would be the most likely scenario.
Furthermore, the price is currently in the lower portion of this channel, increasing the possibility of an eventual breakdown. This scenario is also supported by the daily RSI, which is in the process of decreasing below 50.
If one occurs, the closest support area would be at $23.
Bearish short-term pattern
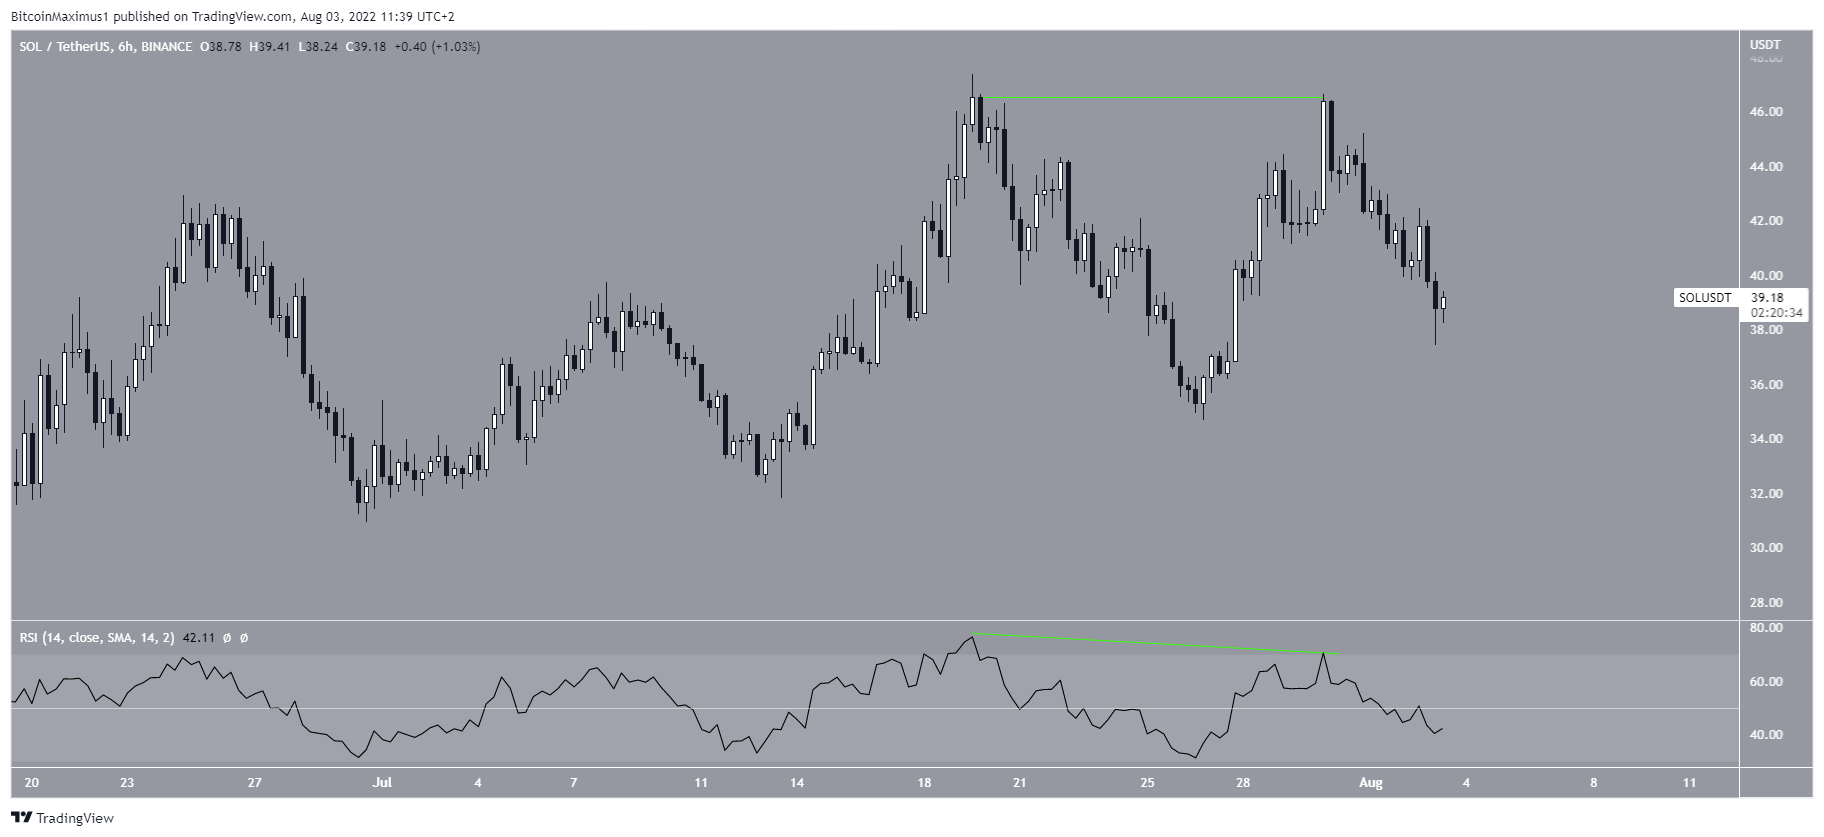
Finally, the six-hour chart shows that SOL has created a double top, which is considered a bearish pattern. Moreover, the double top has been combined with bearish divergence in the RSI (green line), further increasing the legitimacy of the pattern.
As a result of these readings, the six-hour chart is in alignment with the daily one and indicates that a decrease would be the most likely scenario.
For Be[in]Crypto’s latest Bitcoin (BTC) analysis, click here



