


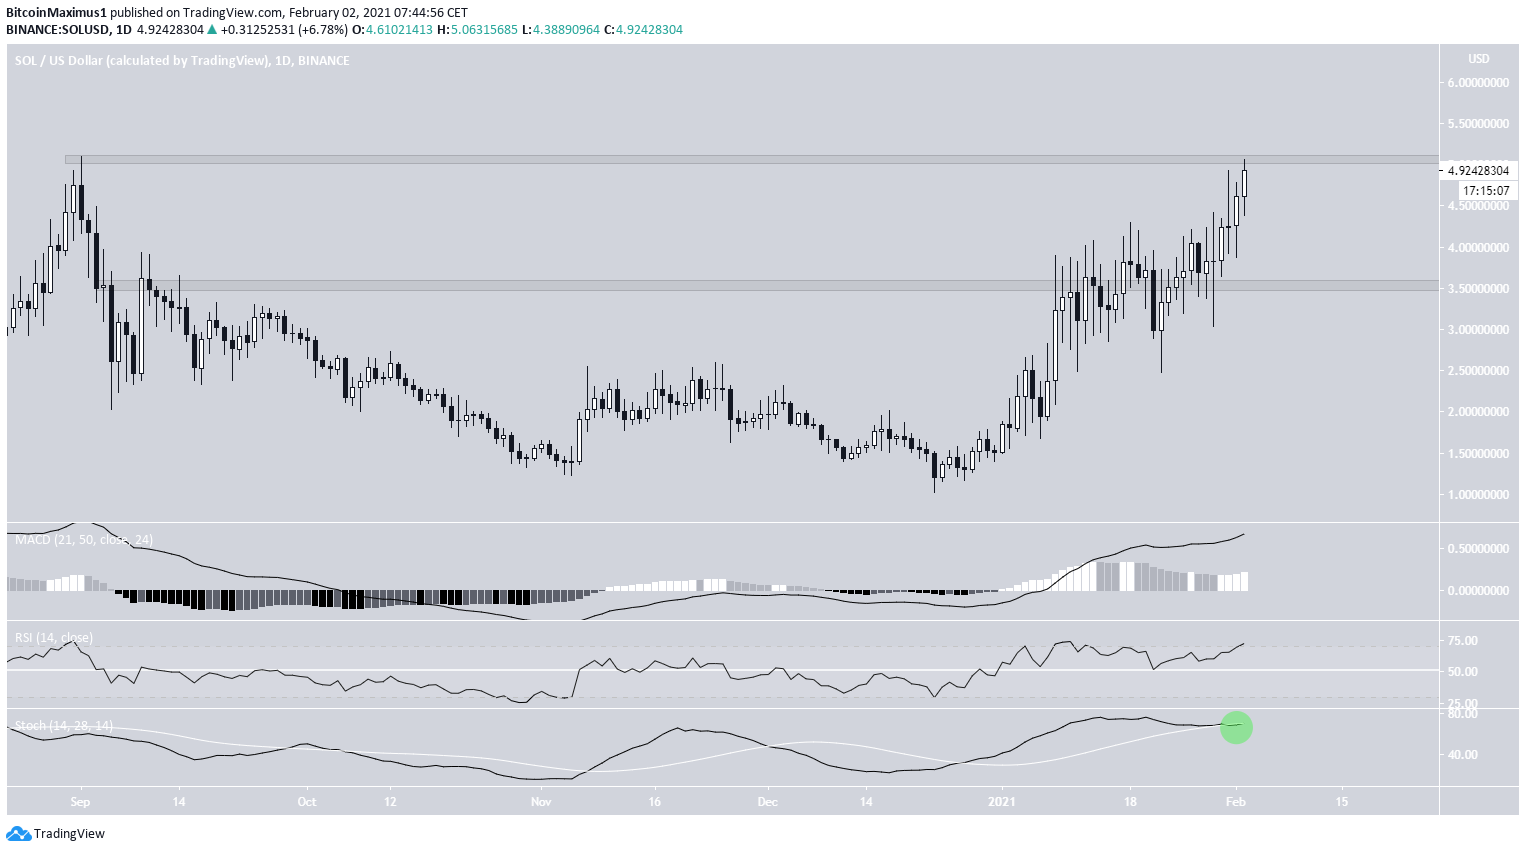
The Solana (SOL) price climbed to $5.33 to claim a new all-time high above the previous $5 high.
Technical indicators and the wave count support the continuation of the upward move for Solana.
New Solana All-Time High
SOL has been moving upwards since reaching a low of $1.01 on Dec. 23, 2020.
While it initially struggled with the $3.80 resistance, SOL managed to break out on Jan. 26, 2021 and has been moving upwards since.
So far, SOL has reached a high of $5.33 before a slight pullback.
Technical indicators are bullish and support the possibility that SOL will continue moving up.
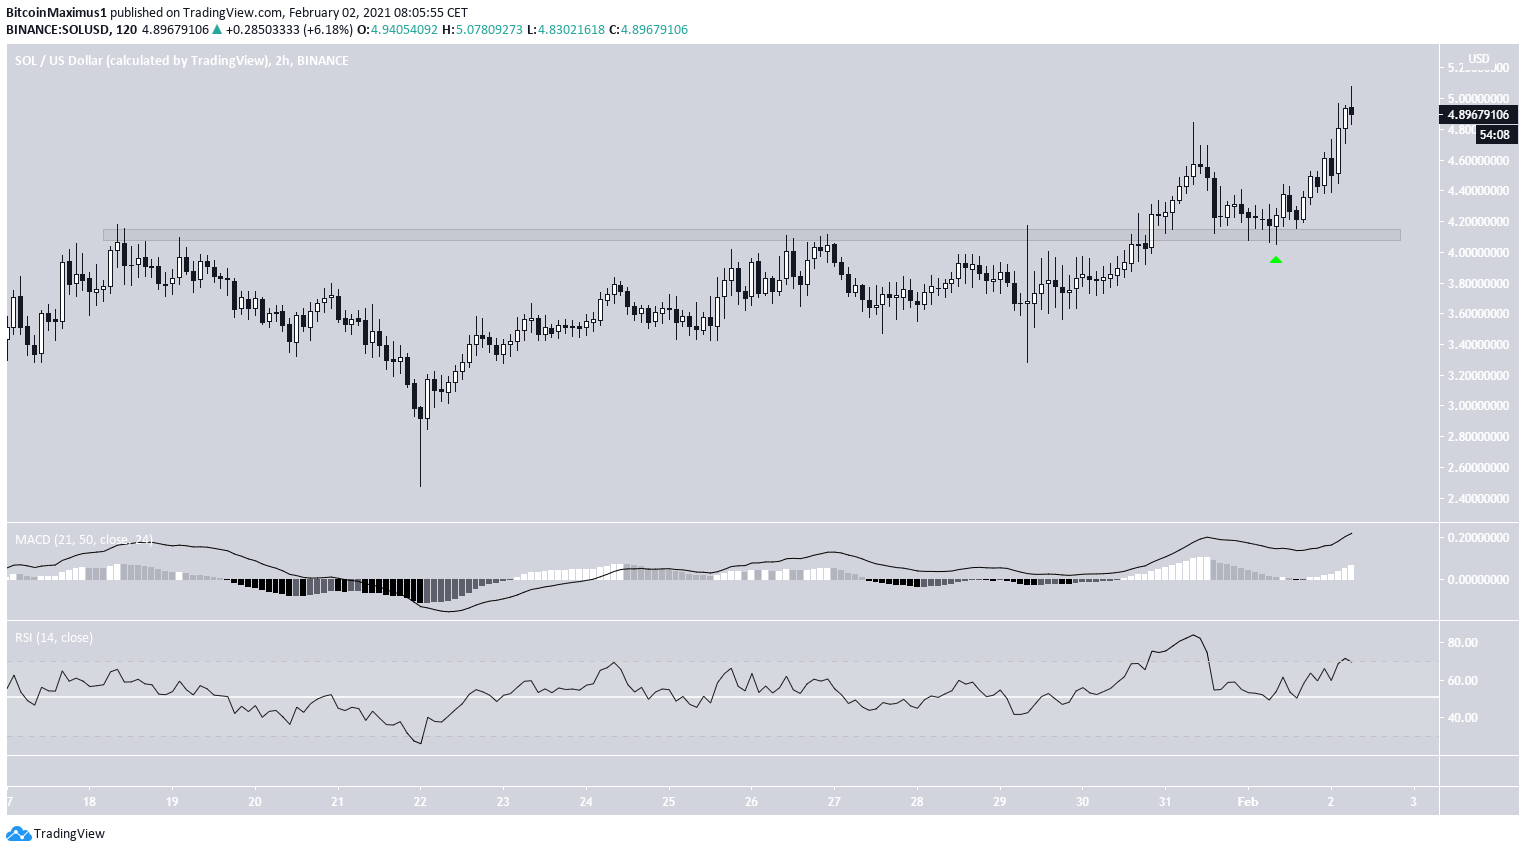
Short-Term Movement
The two-hour chart shows a breakout and re-test above the $4.10 area, which is now likely to act as support.
SOL has been increasing since validating the level as support.
Technical indicators are also bullish, supporting the possibility that the upward move will continue.
Wave Count
Cryptocurrency trader @Altstreetbet outlined a SOL chart, stating that the price is in an extended third wave and could increase all the way to $12.
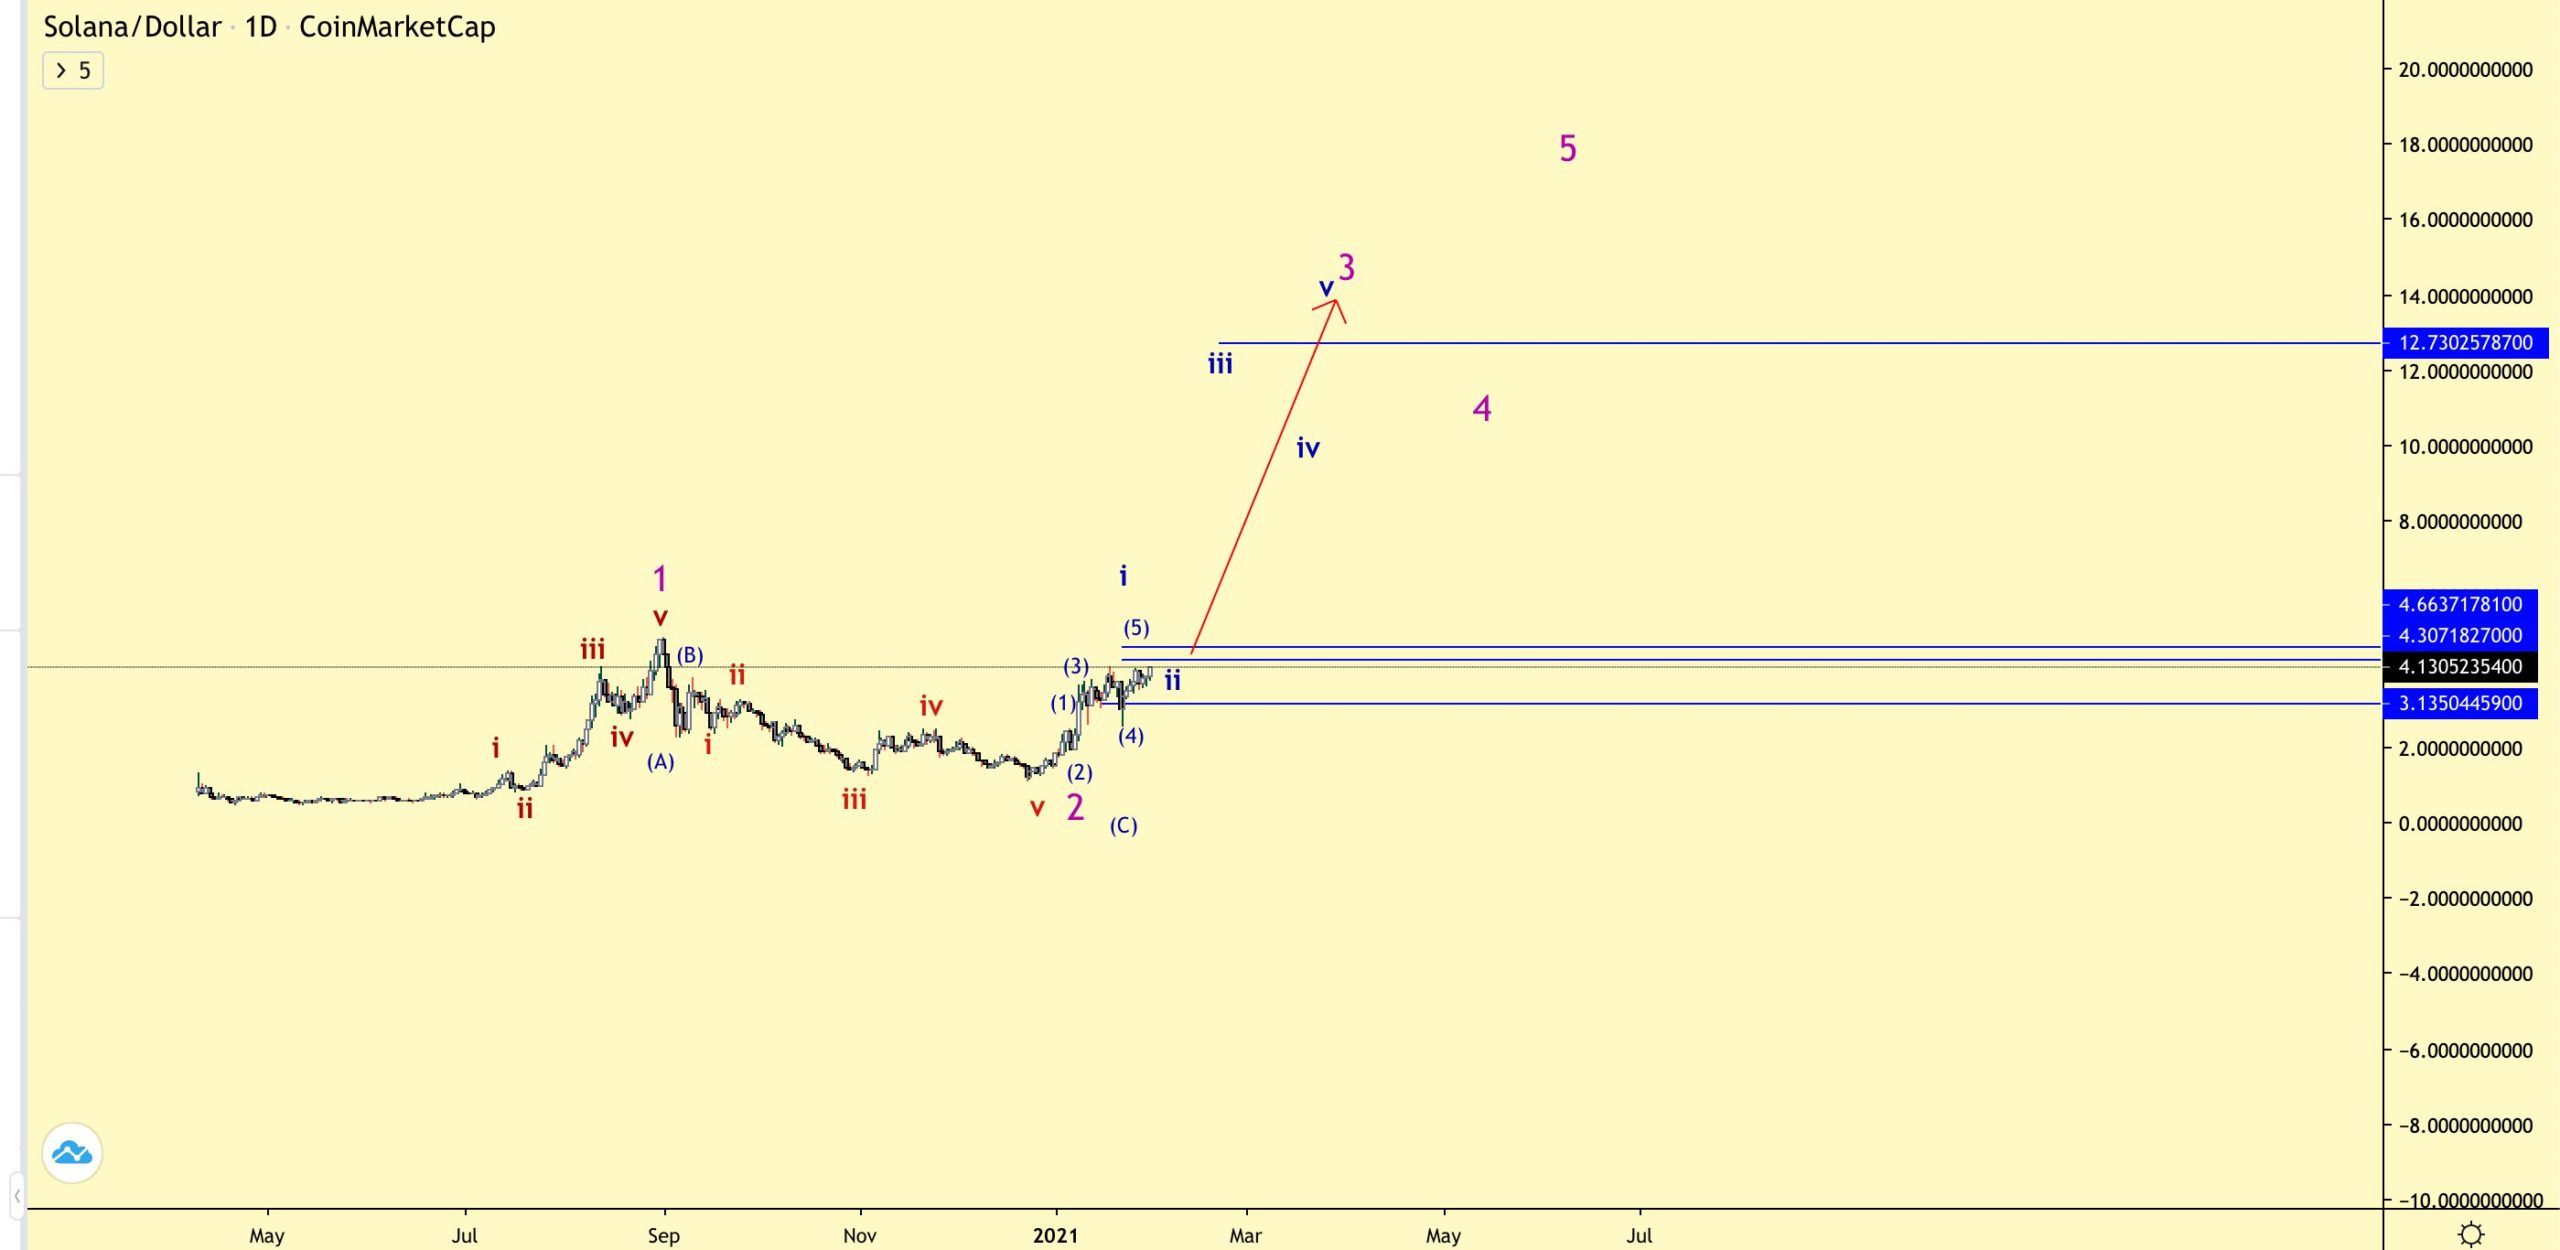
It does indeed seem that SOL is in an extended wave three of a bullish impulse that began in March 2020 (shown in white below).
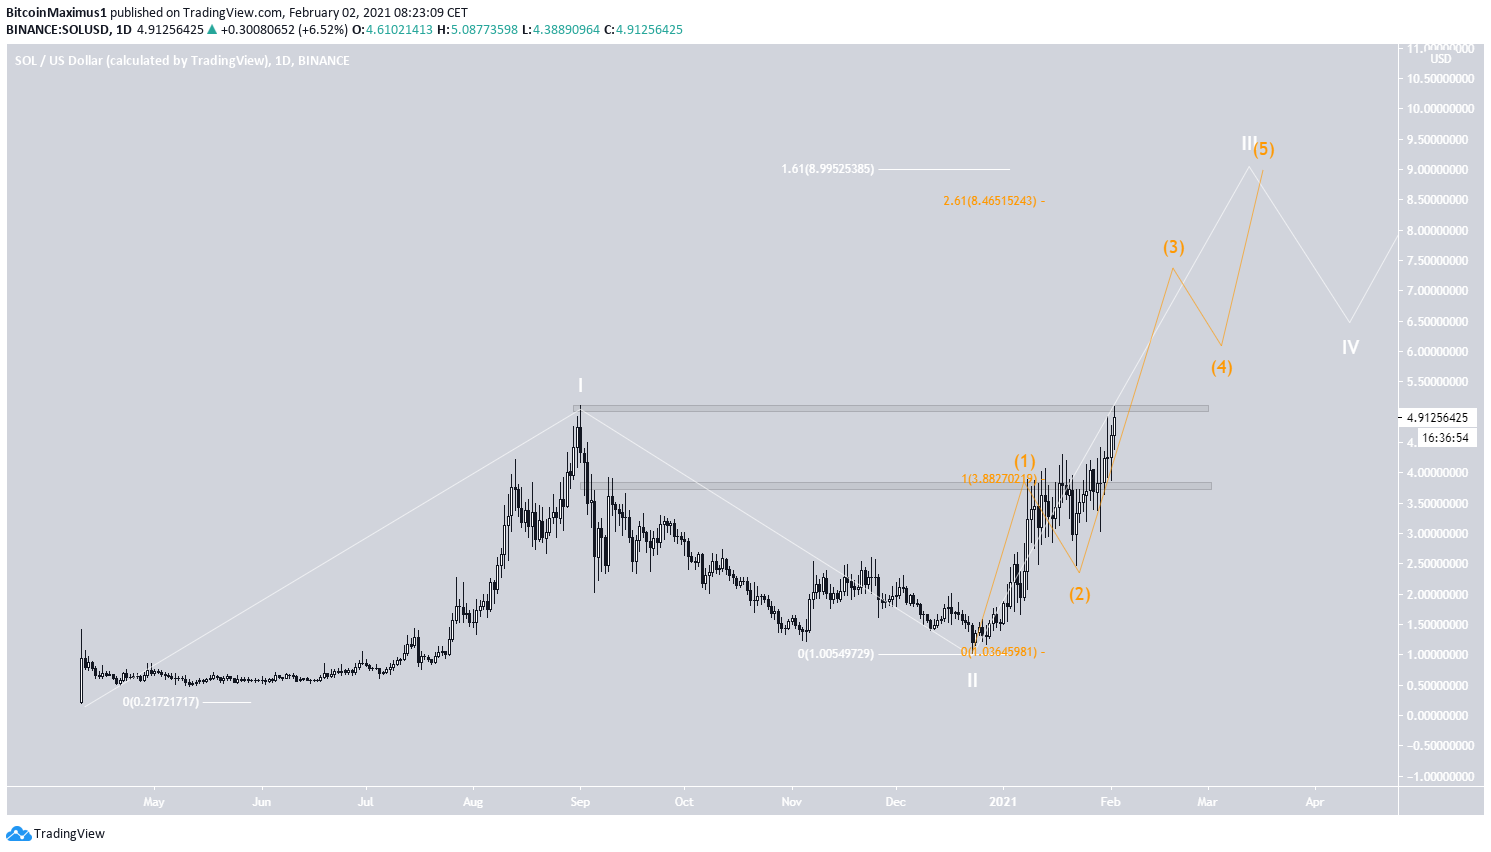
SOL is also in sub-wave three (orange) of the longer-term wave three.
The most likely target for the top of this impulse is found between $8.46-$8.99 (the 2.61 Fib extension of sub-wave 1 (orange) and the 1.61 Fib projection of wave 1 (white)).
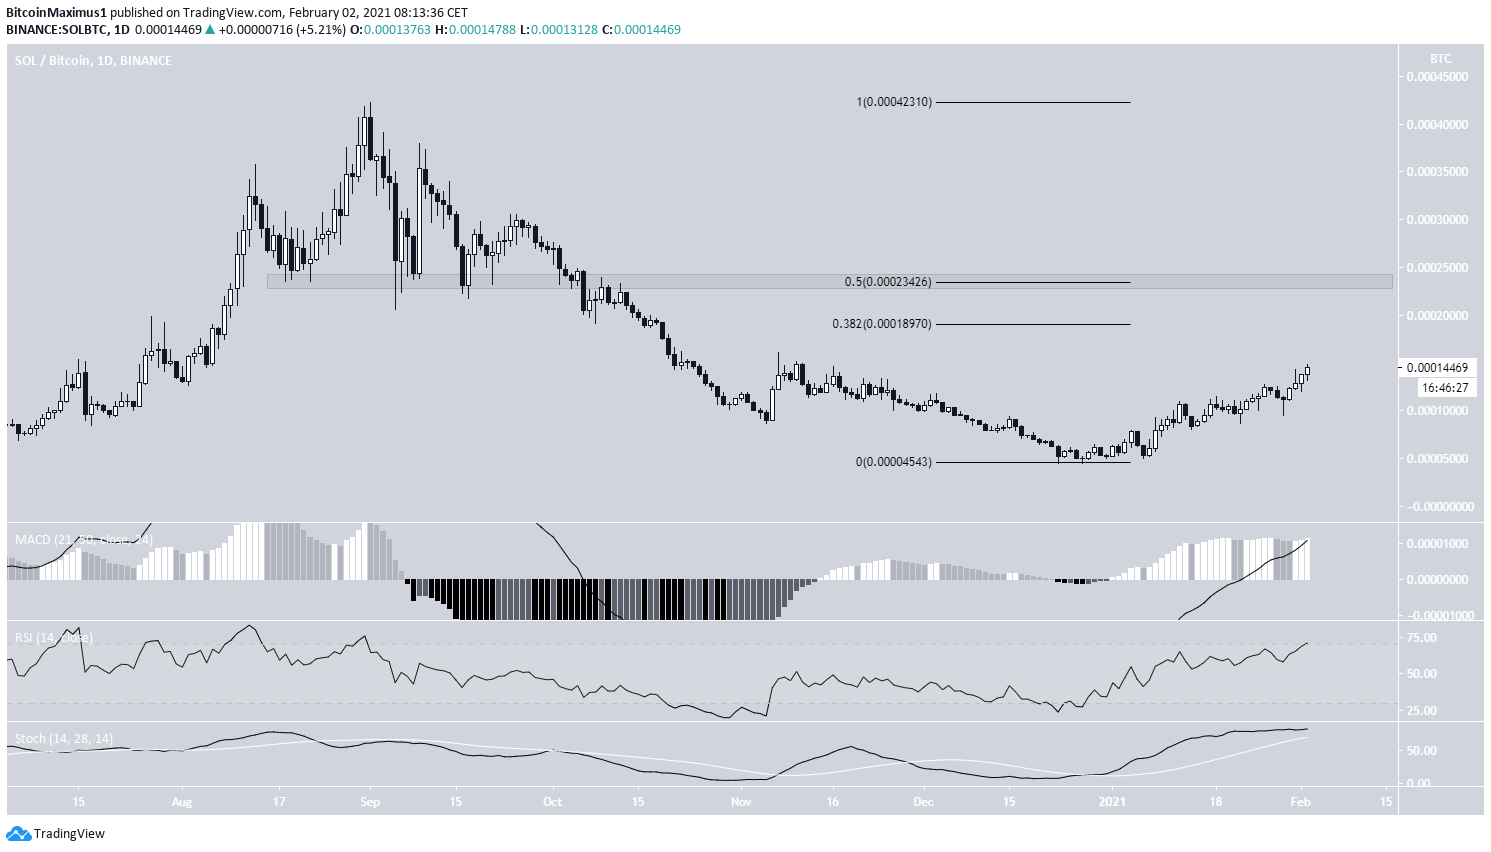
SOL/BTC
The SOL/BTC chart shows a similar upward move that has been going on since Dec. 27, 2020.
Technical indicators are also bullish, supporting the continuation of the upward movement.
However, SOL is likely to face resistance at both 19,000 and 23,500 satoshis (0.382 and 0.5 Fib retracement levels respectively).
Despite the bullish signs, until SOL reclaims the 0.5 Fib and horizontal resistance level, we cannot consider the trend bullish.
Conclusion
Both the SOL/USD and SOL/BTC pairs are expected to increase. SOL/USD is looks primed to continue making new all-time high prices
For BeInCrypto’s latest Bitcoin (BTC) analysis, click here


