


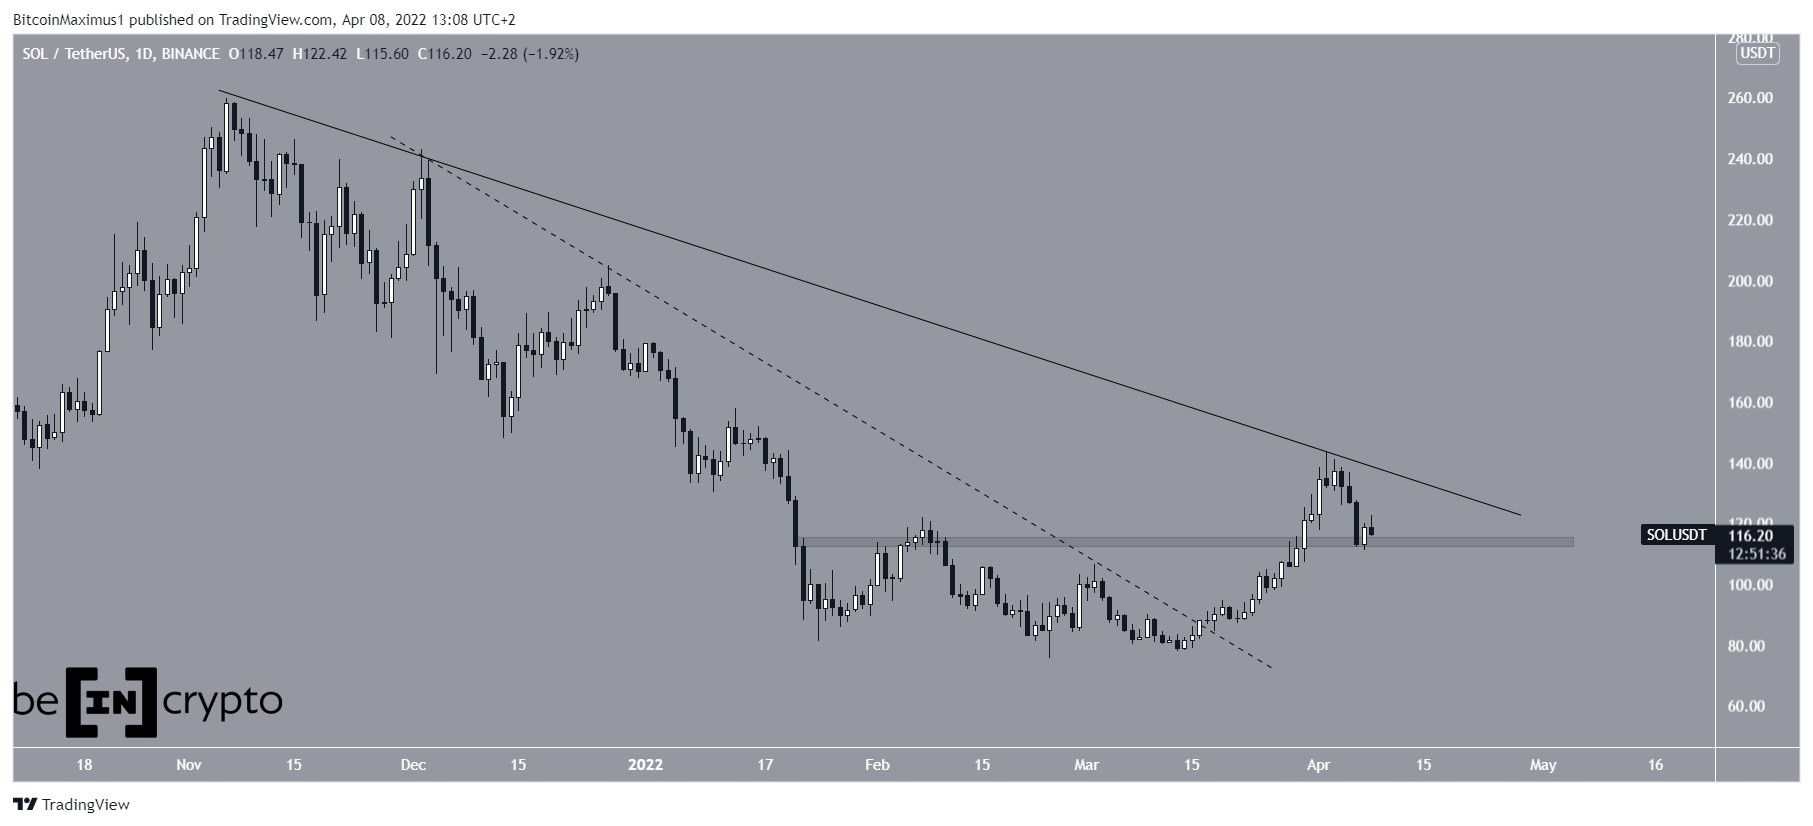
Solana (SOL) has failed to break out from a long-term descending resistance line and is attempting to find short-term support.
SOL has been falling since reaching an all-time high price of $259.90 on Nov 6. The downward movement led to a low of $75.35 on Feb 24.
The price has been moving upwards since and broke out from a short-term descending resistance line (dashed) on March 16 before accelerating its rate of increase.
However, the rally ended once SOL reached a high of $143.51 on April 2. This validated another longer-term descending resistance line, which is now acting as resistance.
After the rejection, the price returned to the $114 level where it bounced slightly.
Future SOL movement
Cryptocurrency trader @CryptoNTez tweeted a chart of SOL, stating that the price could potentially increase all the way to $150.
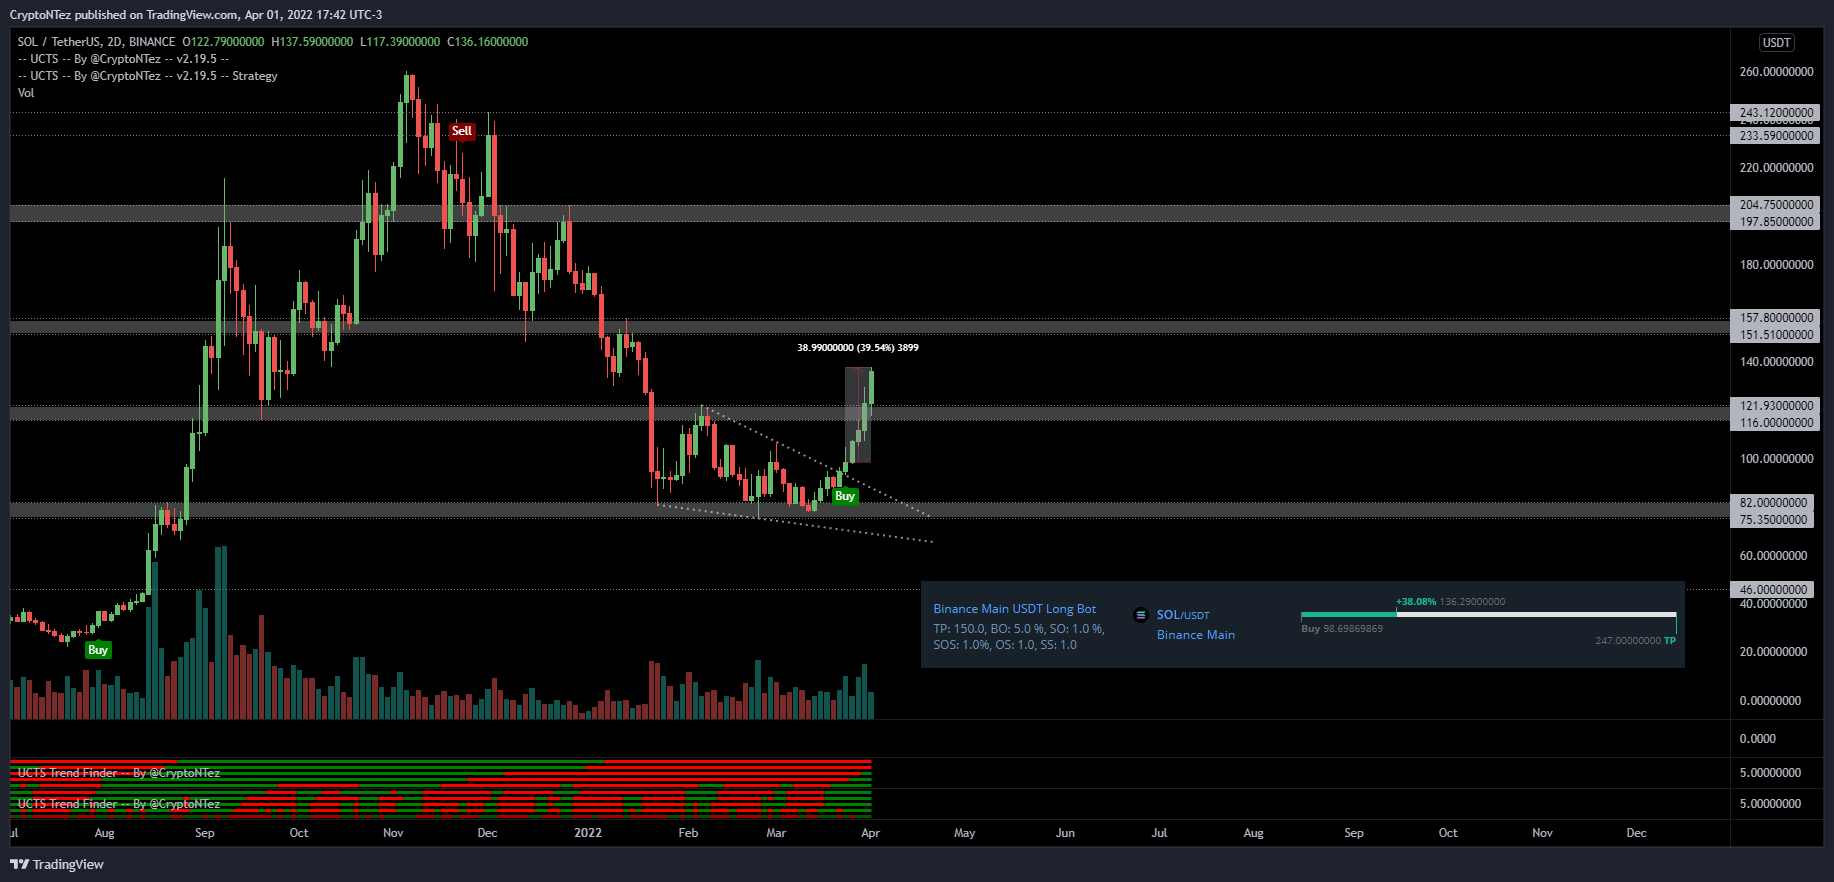
As outlined above, SOL reached a high of $143.51 before falling.
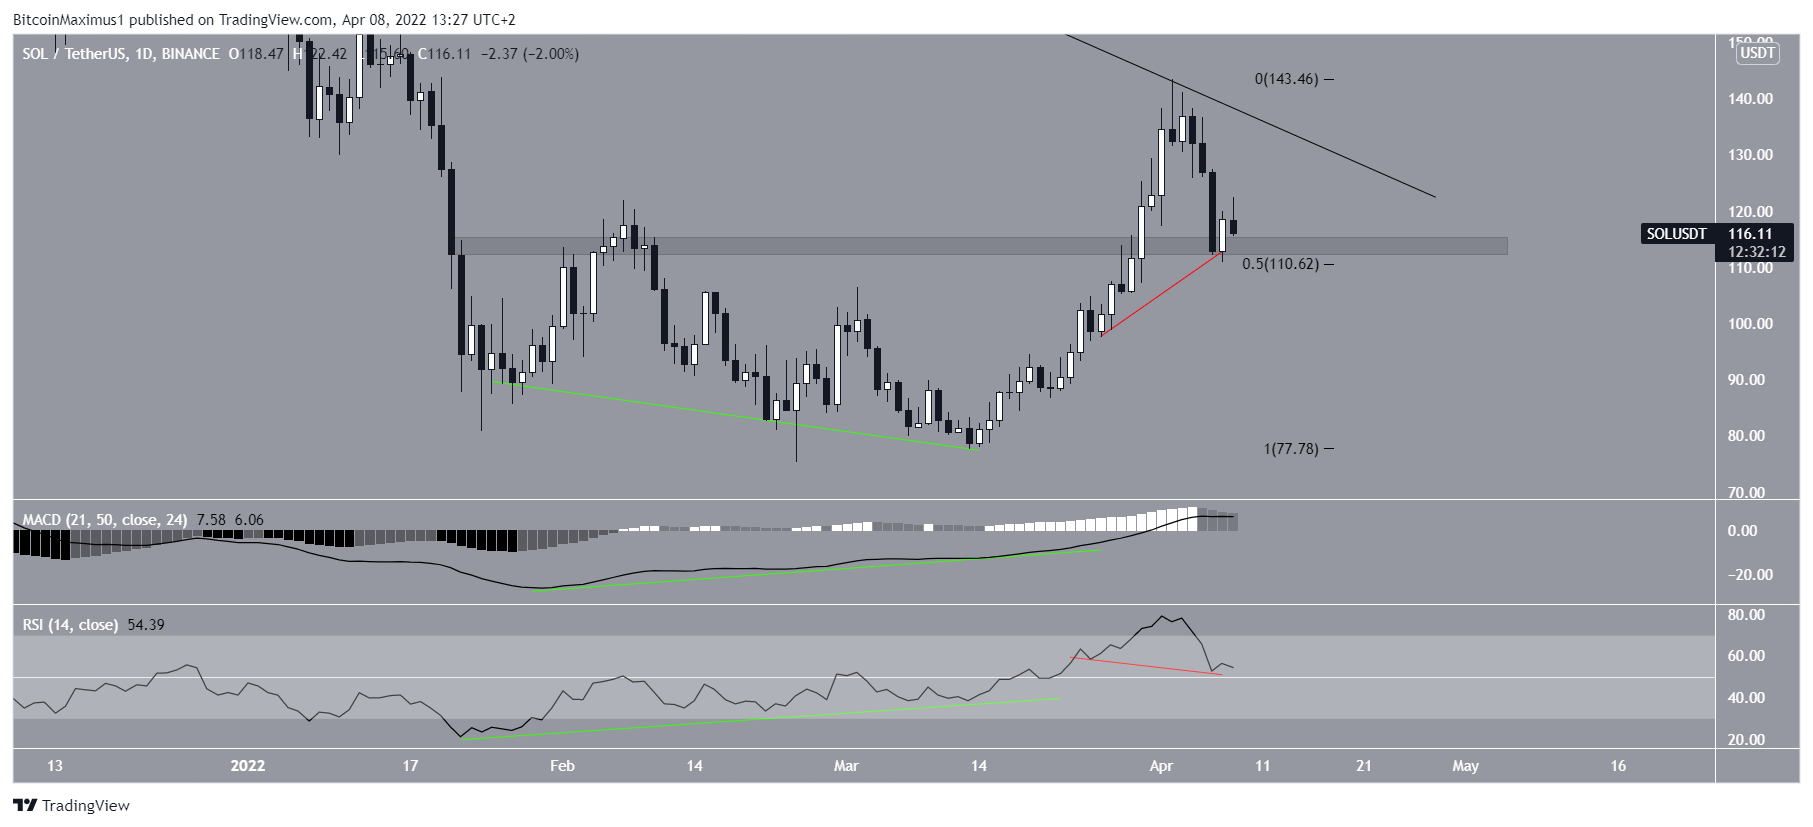
A closer look at the daily time frame shows that the increase was preceded by bullish divergences (green lines) in both the RSI and MACD. Now, the daily MACD is positive and the daily RSI is above 50. Both of these are considered signs of a bullish trend.
In addition to this, there is a hidden bullish divergence (red line) currently developing in the RSI. If confirmed, it would be a strong sign of trend continuation.
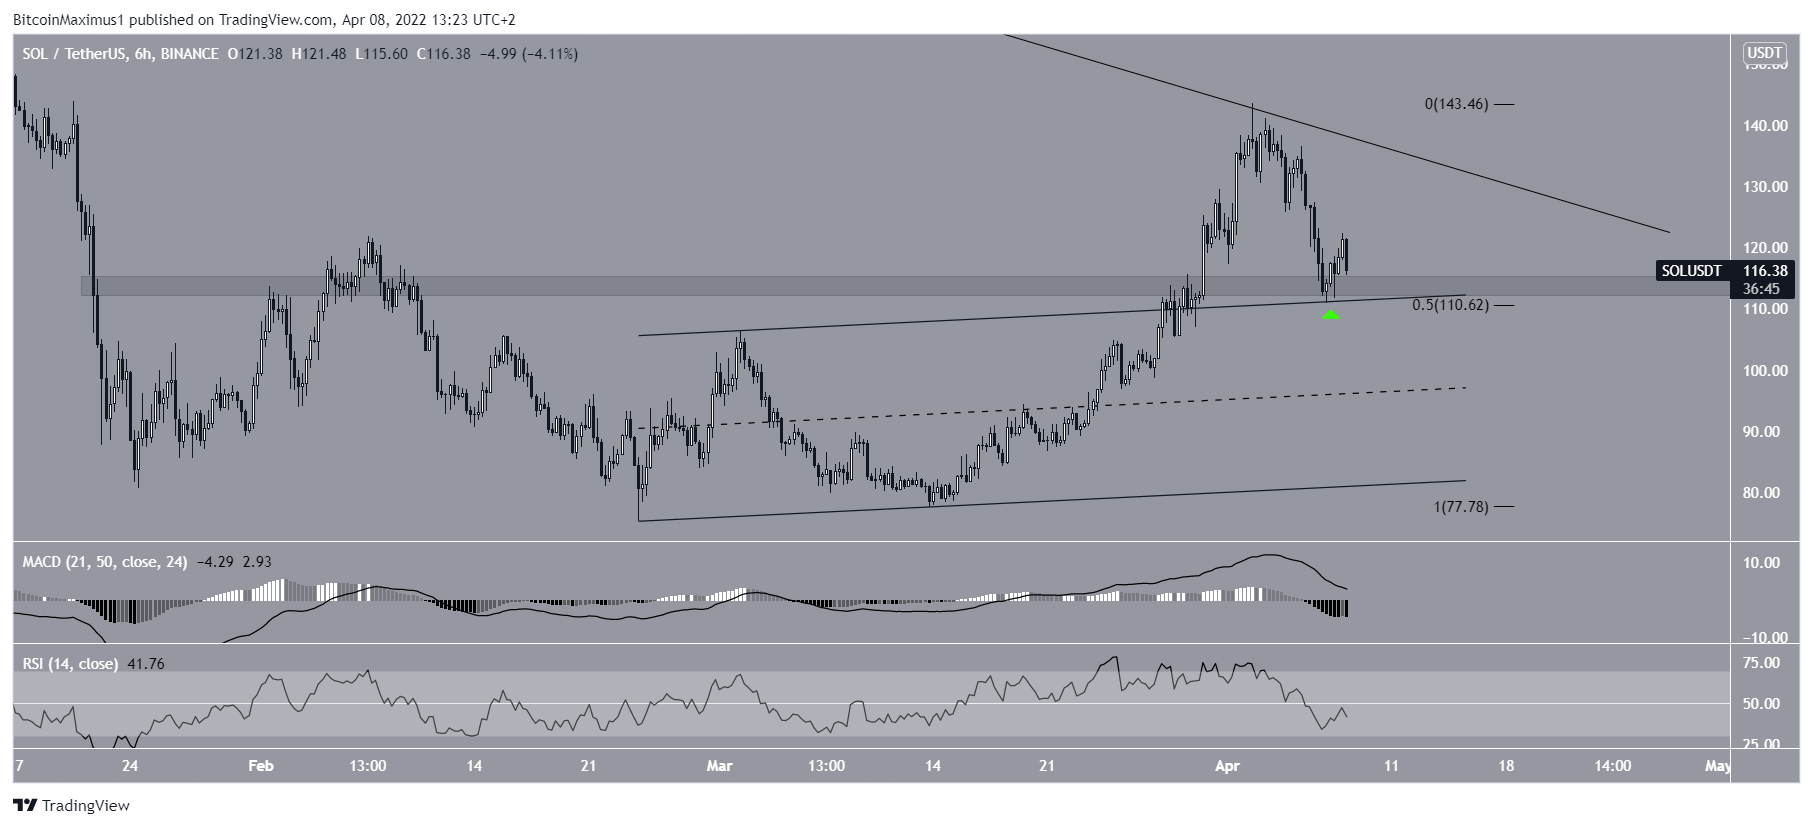
Despite the ongoing decrease, the six-hour chart shows that SOL has bounced at the resistance line of an ascending parallel channel (green icon).
Previously, the price broke out from this channel on March 29. The channel also coincides with the 0.5 Fib retracement support level when measuring the most recent portion of the upward movement.
However, even though the price has bounced at a confluence of support levels, technical indicators are bearish. Both the MACD and RSI are decreasing, and the latter has even fallen below 50. This is a sign associated with bearish trends.
Therefore, technical indicators in the daily and six-hour time frames are not in alignment with each other.
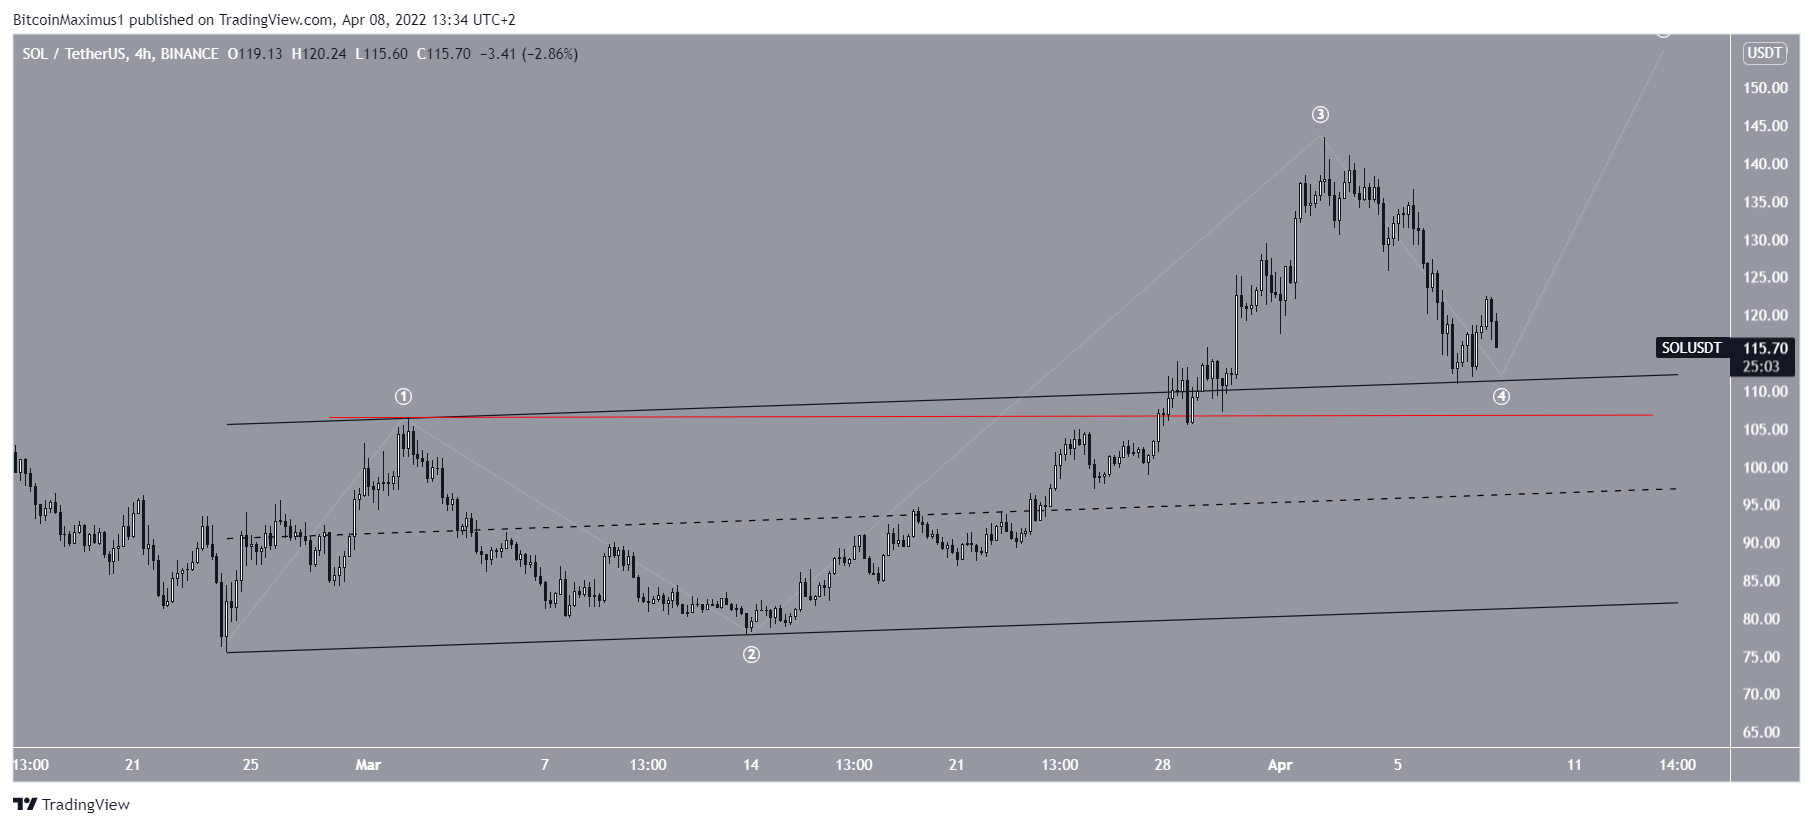
Wave count analysis
Due to the breakout from the channel and its subsequent validation as support, it is possible that the decrease is part of a fourth wave pullback. This is an occurrence in which a sharp fall completes wave four. If correct, SOL would begin the fifth and final wave after the short-term correction is done.
A decrease below the wave one high (red line) at $106.43 would invalidate this particular wave count.
For Be[in]Crypto’s latest Bitcoin (BTC) analysis, click here


