
Solana (SOL) has dropped over 6% in the past seven days and has been trading below $150 since March 6. The current trend shows clear bearish signals across multiple indicators.
From a death cross to a rising ADX and a red Ichimoku Cloud, technicals suggest growing downside pressure. With SOL nearing key support, the next few days could be critical for its price direction.
SOL Ichimoku Cloud Paints A Bearish Picture
The Ichimoku Cloud chart for Solana shows a clear bearish structure, with price action trading below both the Kijun-sen (red line) and Tenkan-sen (blue line).
The Lagging Span (green line) is also positioned below the price candles and the cloud, reinforcing the negative outlook. The Kumo ahead is red and descending, suggesting that resistance remains strong in the near term.
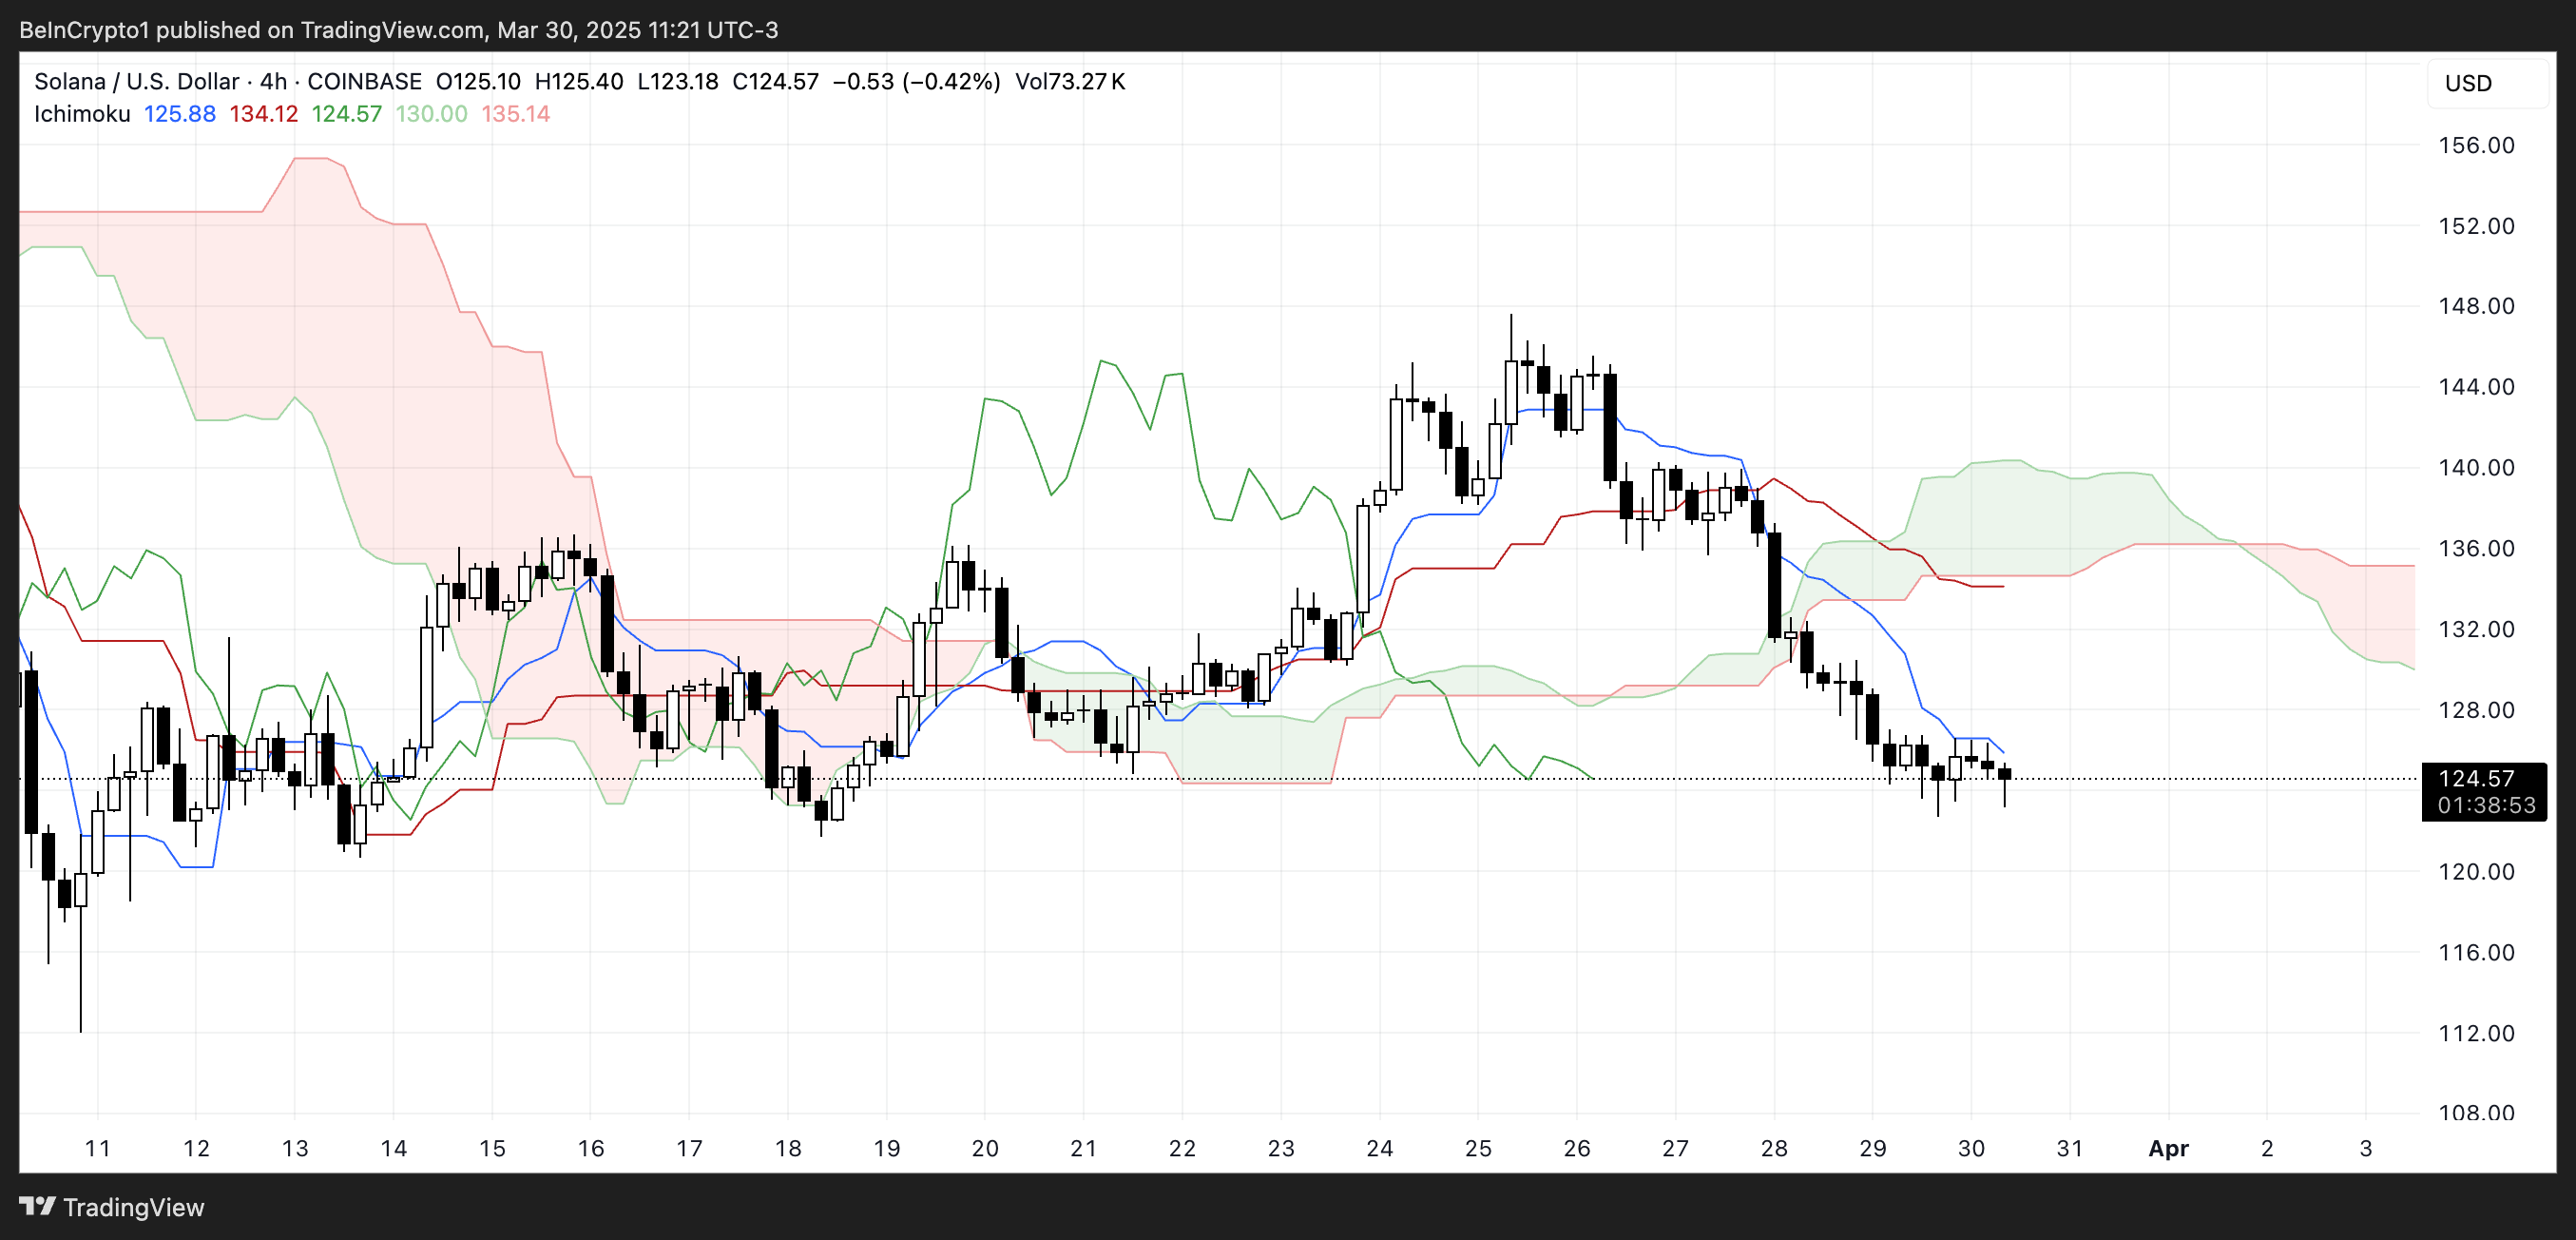
Solana has struggled to break above short-term resistance levels and remains stuck in a downward channel. The thin nature of the current cloud suggests weak support, making the price vulnerable to further downside if bearish momentum continues.
For a reversal, Solana would need to break above the Kijun-sen and push decisively toward the cloud, but for now, the trend remains tilted to the downside.
Solana DMI Shows Sellers Are In Control
Solana’s DMI chart shows a sharp rise in the ADX, now at 40.87—up from 19.74 just three days ago.
The ADX (Average Directional Index) measures the strength of a trend, with values above 25 indicating a strong trend and values above 40 signaling a very strong one.
This surge confirms that the current downtrend in SOL is gaining momentum.
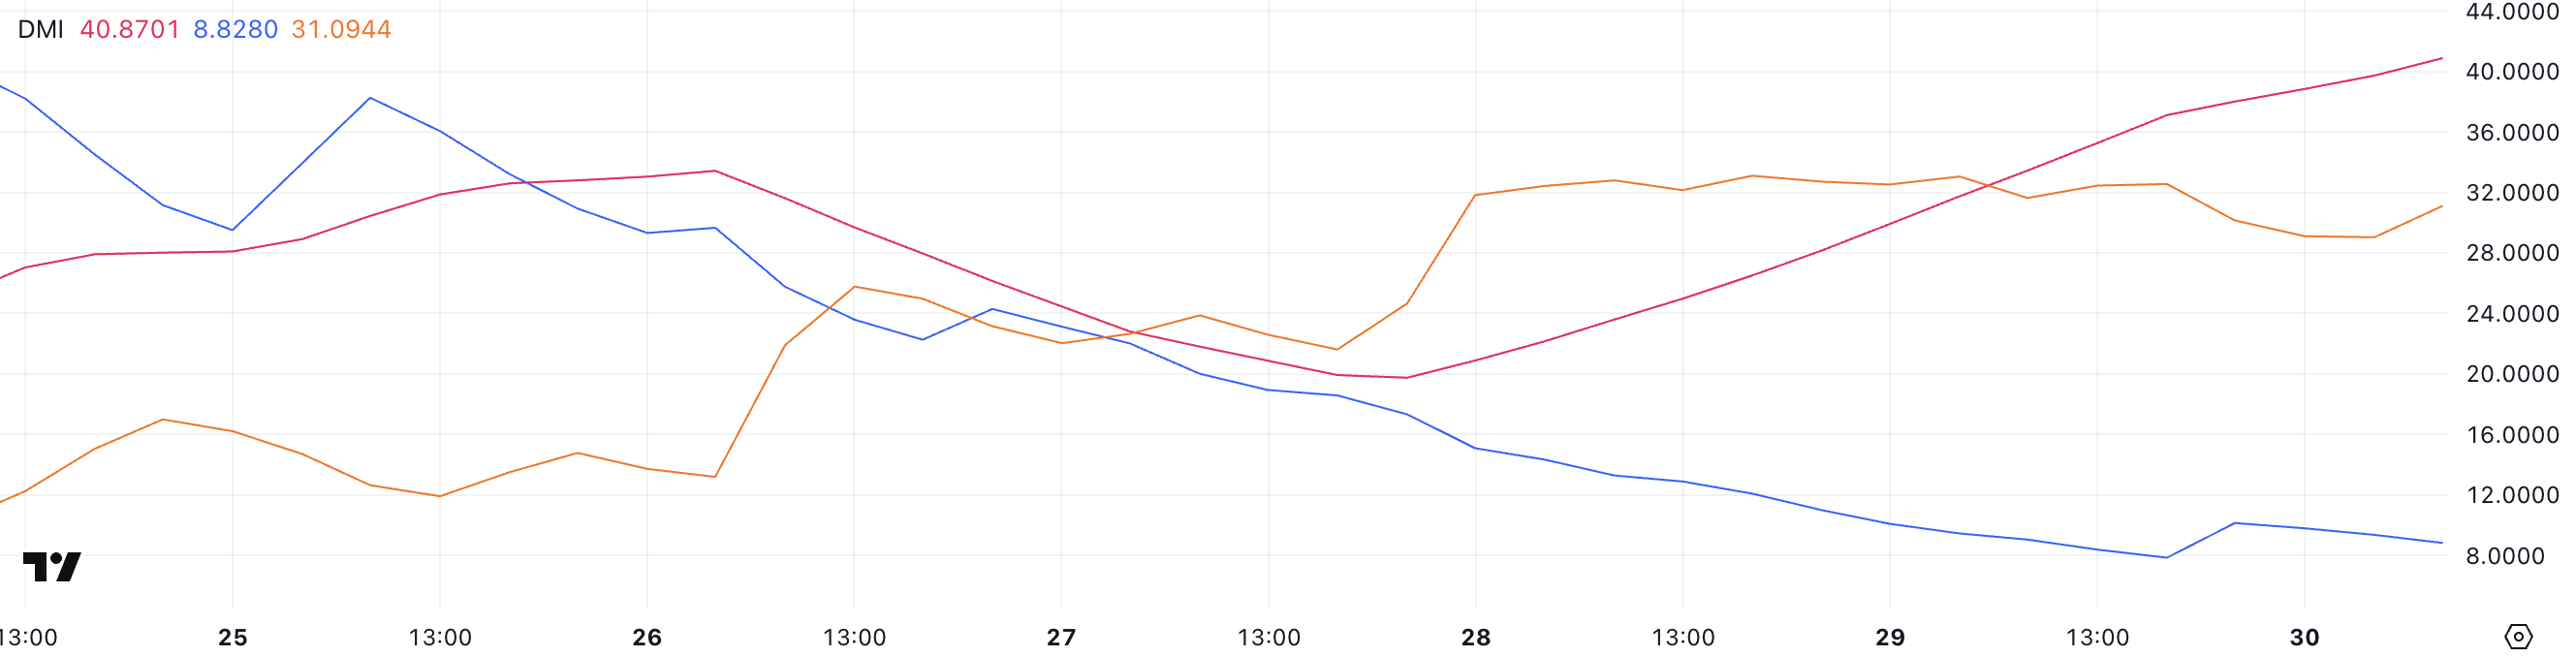
At the same time, the +DI has dropped from 17.32 to 8.82, while the -DI has climbed to 31.09, where it has held steady for the past two days.
This setup suggests that the sellers are firmly in control, and the downtrend is strong and also strengthening.
As long as the -DI remains dominant and ADX stays elevated, SOL is likely to remain under pressure in the short term.
Can Solana Drop Below $110 Soon?
Solana recently formed a death cross, a bearish signal where short-term moving averages cross below long-term ones.
It’s now approaching key support at $120—if that level breaks, Solana price could drop to $112, and possibly below $110 for the first time since February 2024.
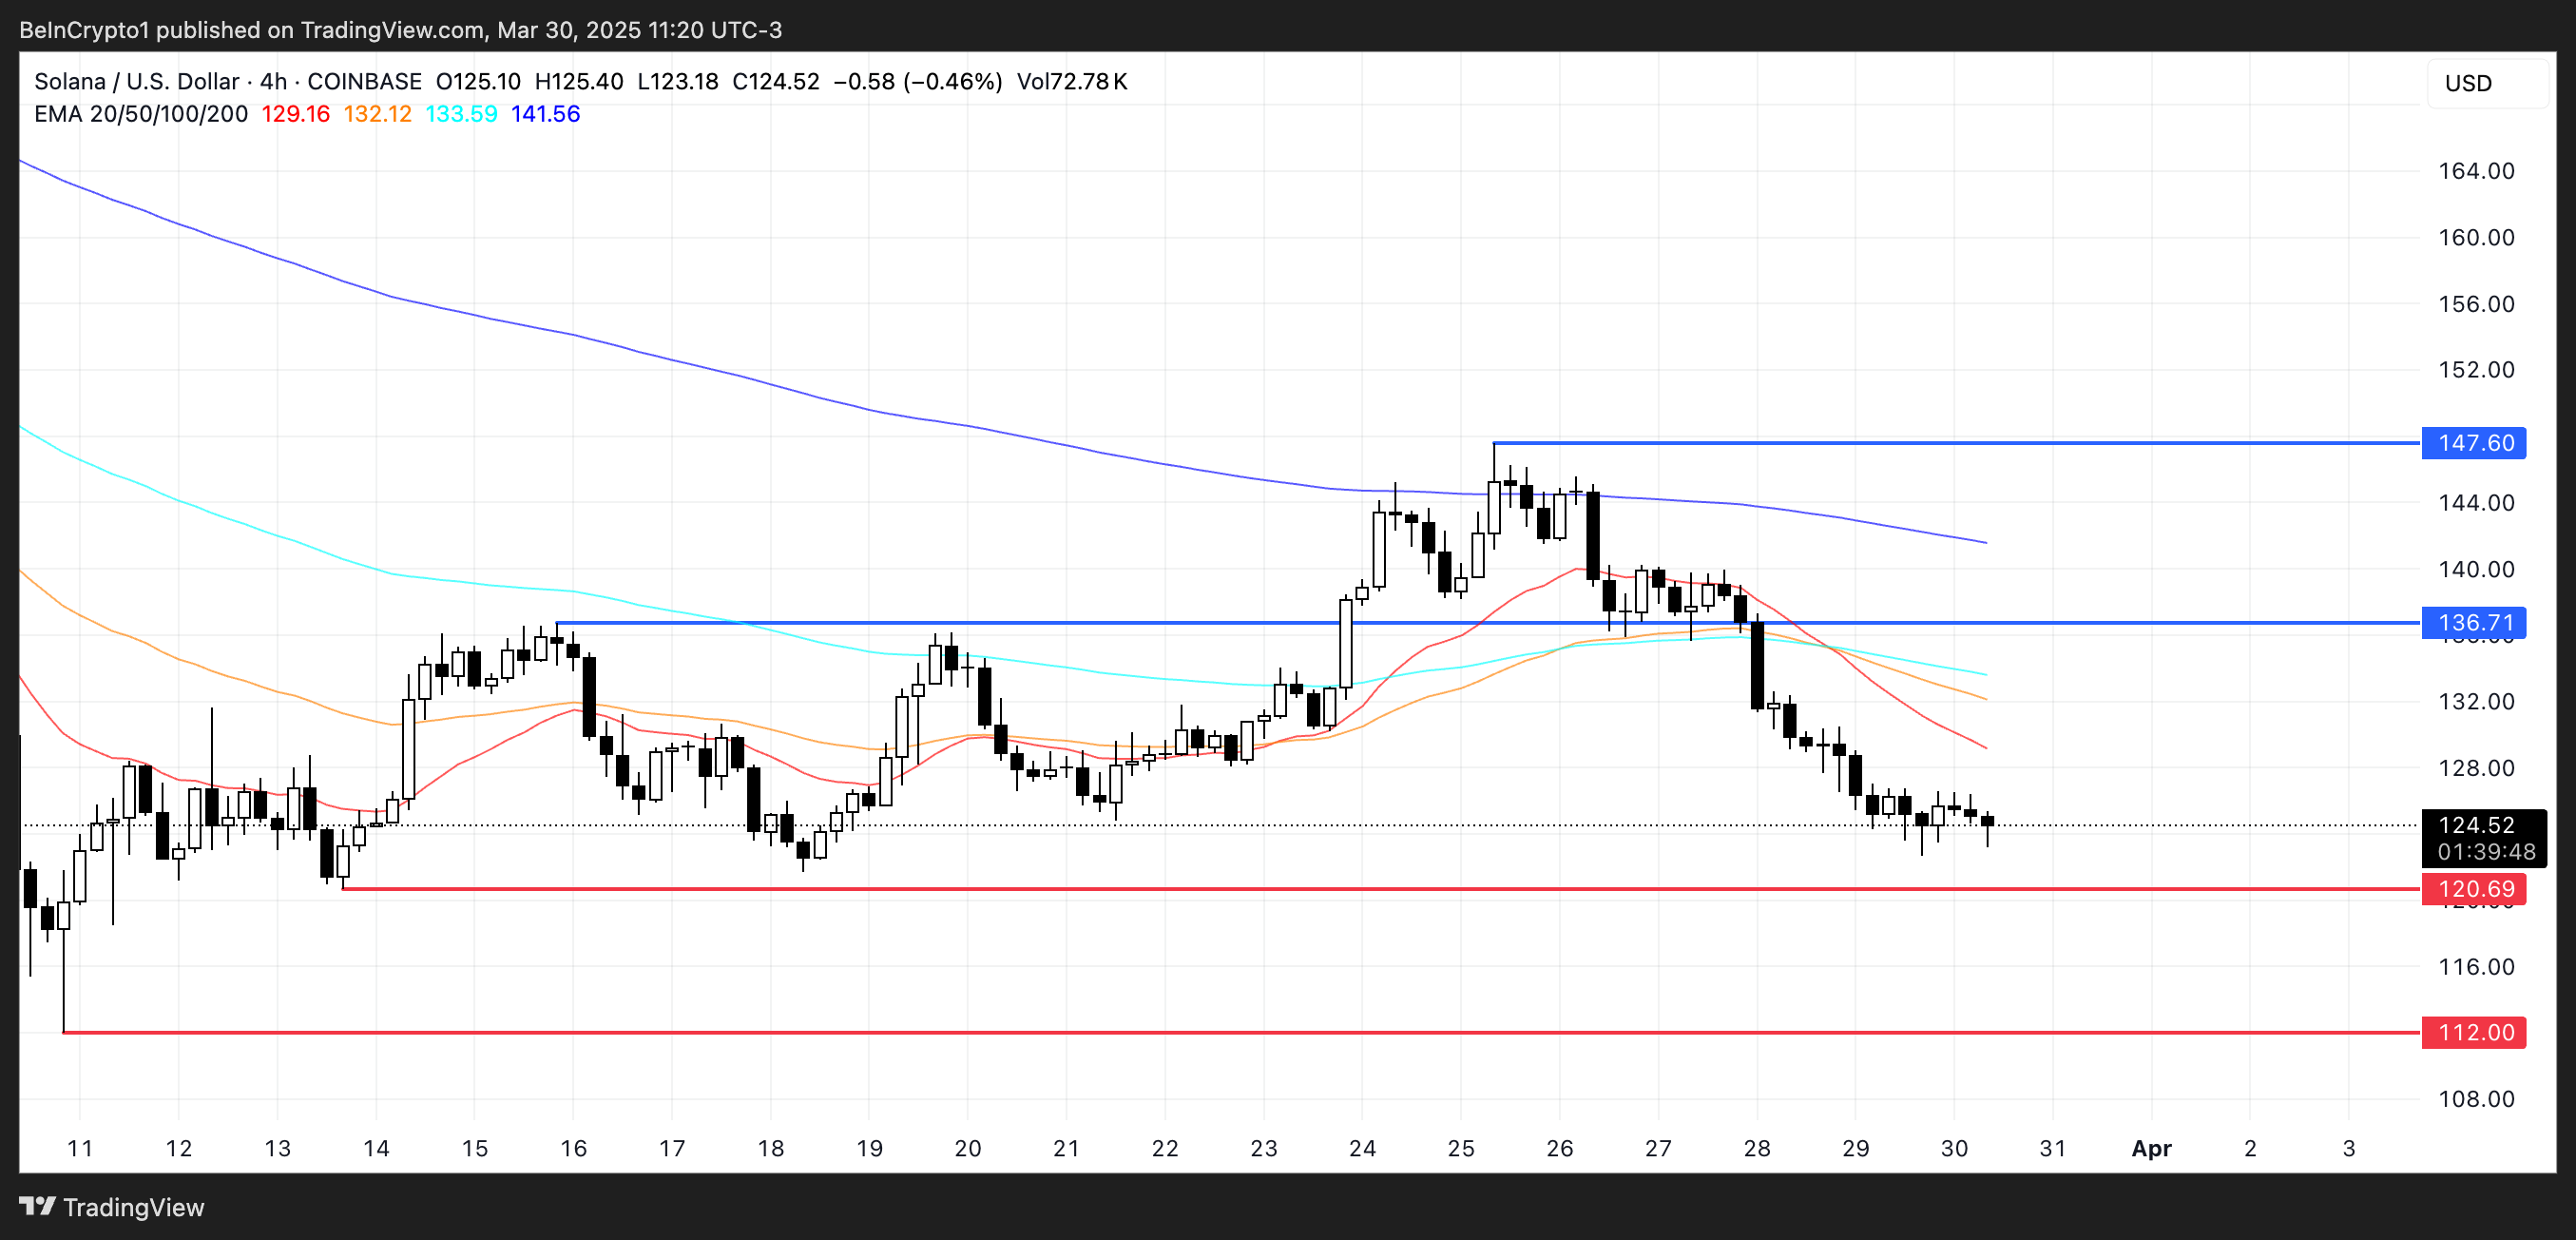
If bulls step in and buying pressure returns, SOL could rebound toward resistance at $136.
A breakout above that level may lead to a push toward $147, which acted as strong resistance just five days ago.
