
Solana (SOL) has recovered over 12% today after Trump announced a 90-day pause on tariffs. Despite the significant recovery, technical indicators continue flashing bearish warnings.
Solana RSI Shows The Lack Of Conviction Among Buyers
Solana’s Relative Strength Index (RSI) is currently sitting at 45.52, hovering in neutral territory but remaining below the midline of 50 for nearly two days.
This comes after the RSI briefly dipped to an oversold level of 21.53 two days ago, indicating that sellers had briefly dominated before demand began to stabilize.
The RSI’s slow climb back toward neutral suggests that while extreme selling pressure has eased, bullish momentum has not yet taken control.
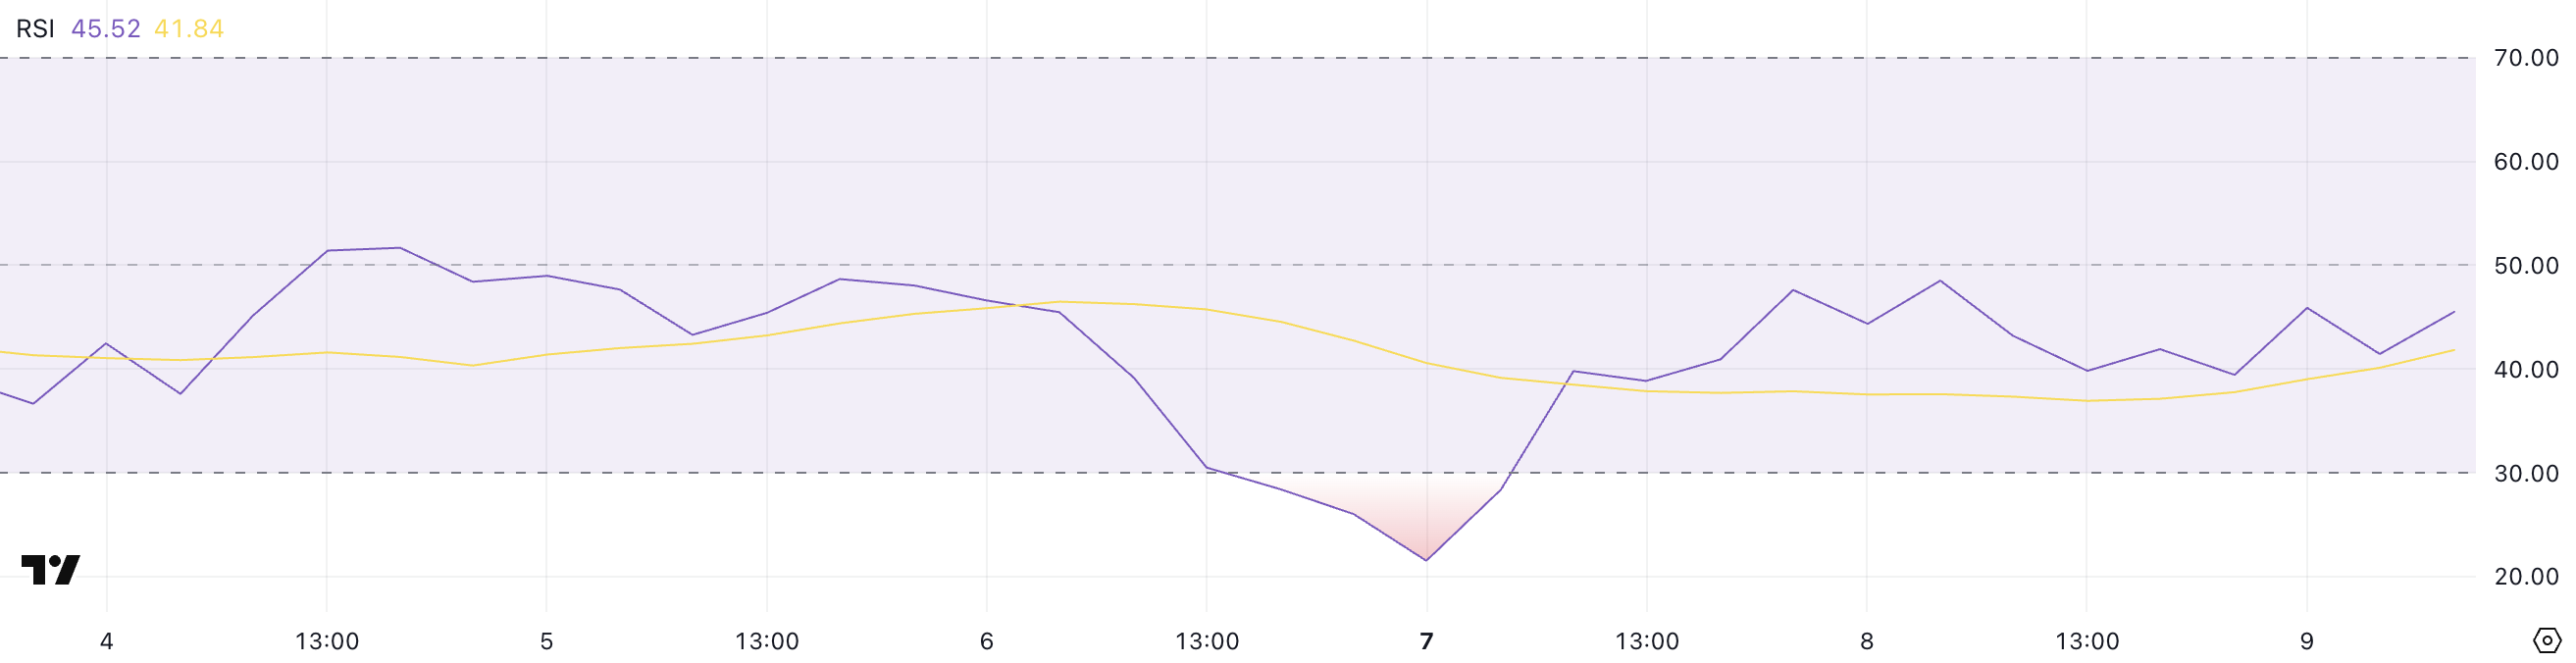
The RSI is a momentum oscillator that measures the speed and magnitude of recent price movements. It typically ranges from 0 to 100.
Readings above 70 are generally interpreted as overbought, signaling the potential for a pullback, while readings below 30 suggest oversold conditions and potential for a rebound.
Solana’s RSI at 45.52 indicates that the asset is in a recovery phase but lacks conviction. If the RSI fails to cross above 50 soon, it could imply continued hesitation among buyers and the potential for sideways price action or even another leg lower.
SOL BBTrend Has Reached Its Lowest Levels In Almost A Month
Solana’s BBTrend indicator is currently at -14.19, having turned negative since yesterday, and is at its lowest level since March 13—nearly a month ago.
This shift into deeper negative territory suggests that bearish momentum is building once again after a period of relative stability.
The return to these levels may indicate growing downside pressure, especially if follow-through selling continues in the short term.
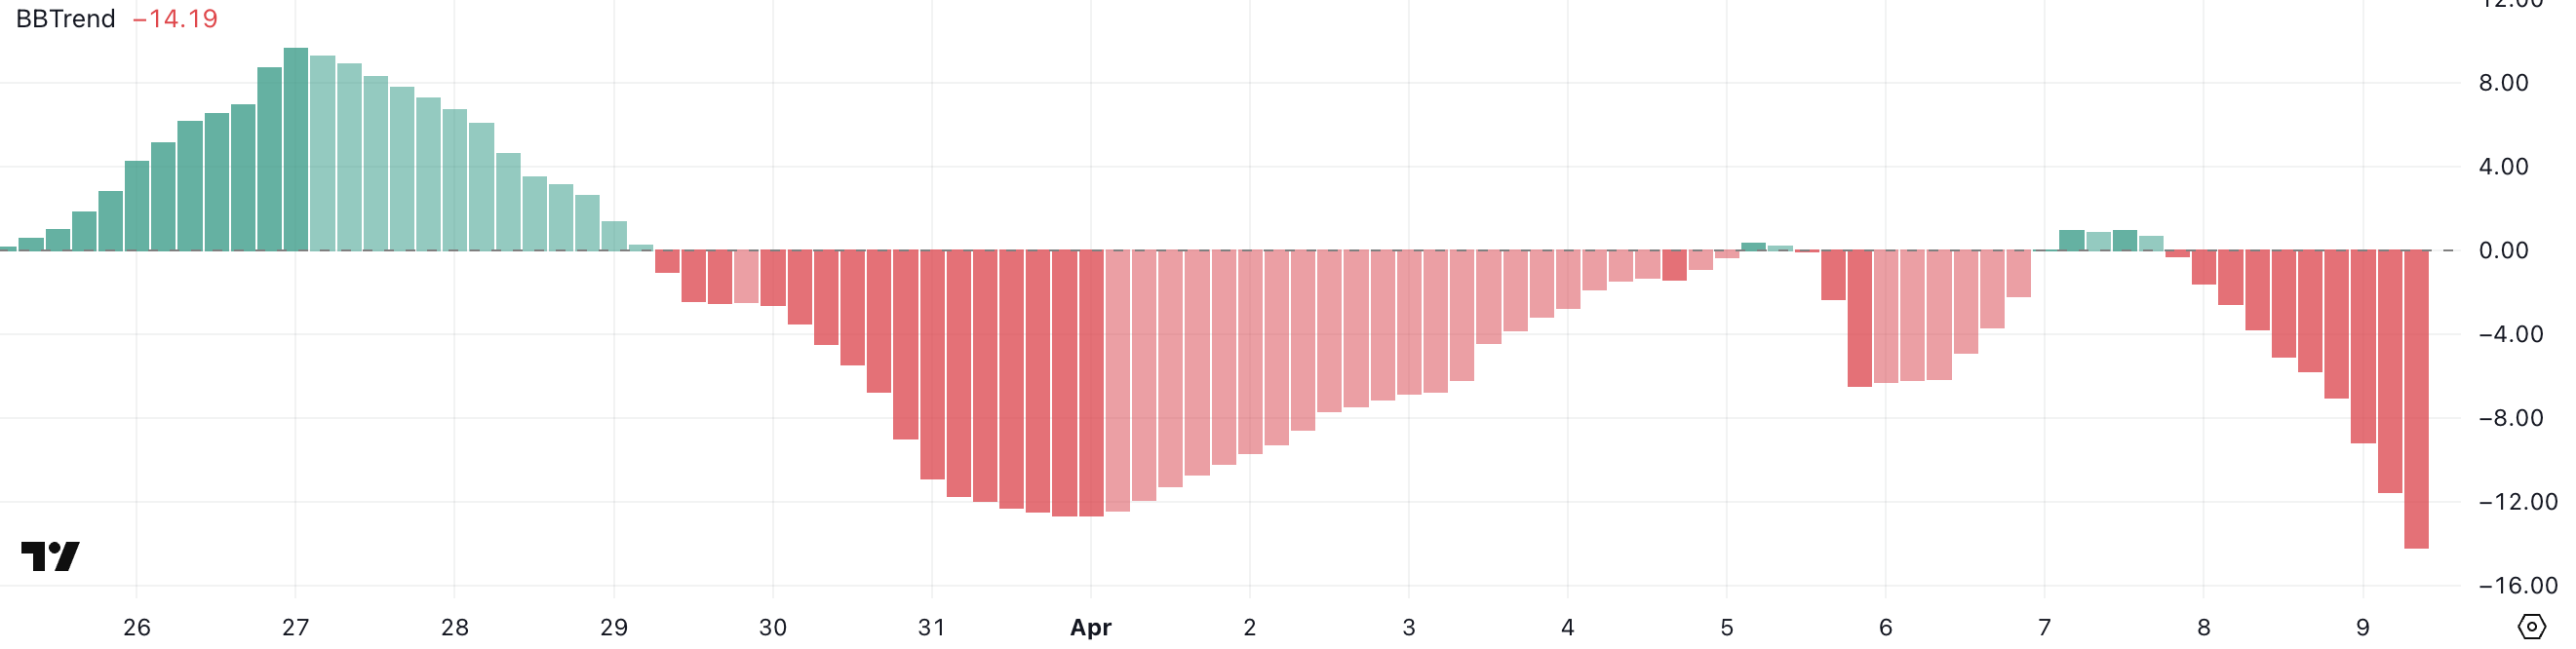
The BBTrend (Bollinger Band Trend) is a volatility-based indicator that measures the strength and direction of a price trend using the distance between price and Bollinger Bands.
Positive BBTrend values generally reflect bullish momentum, while negative values signal bearish momentum. The deeper the reading into negative territory, the stronger the downward pressure is considered to be.
Solana’s BBTrend is now at -14.19, implying an intensifying bearish phase, which could mean further price declines unless sentiment or volume shifts quickly in favor of buyers.
Will Solana Dip Below $100 Again In April?
Solana’s EMA setup continues to reflect a strong bearish structure, with short-term moving averages remaining well below long-term ones.
This alignment confirms that downward momentum is still in control, keeping sellers in a dominant position.
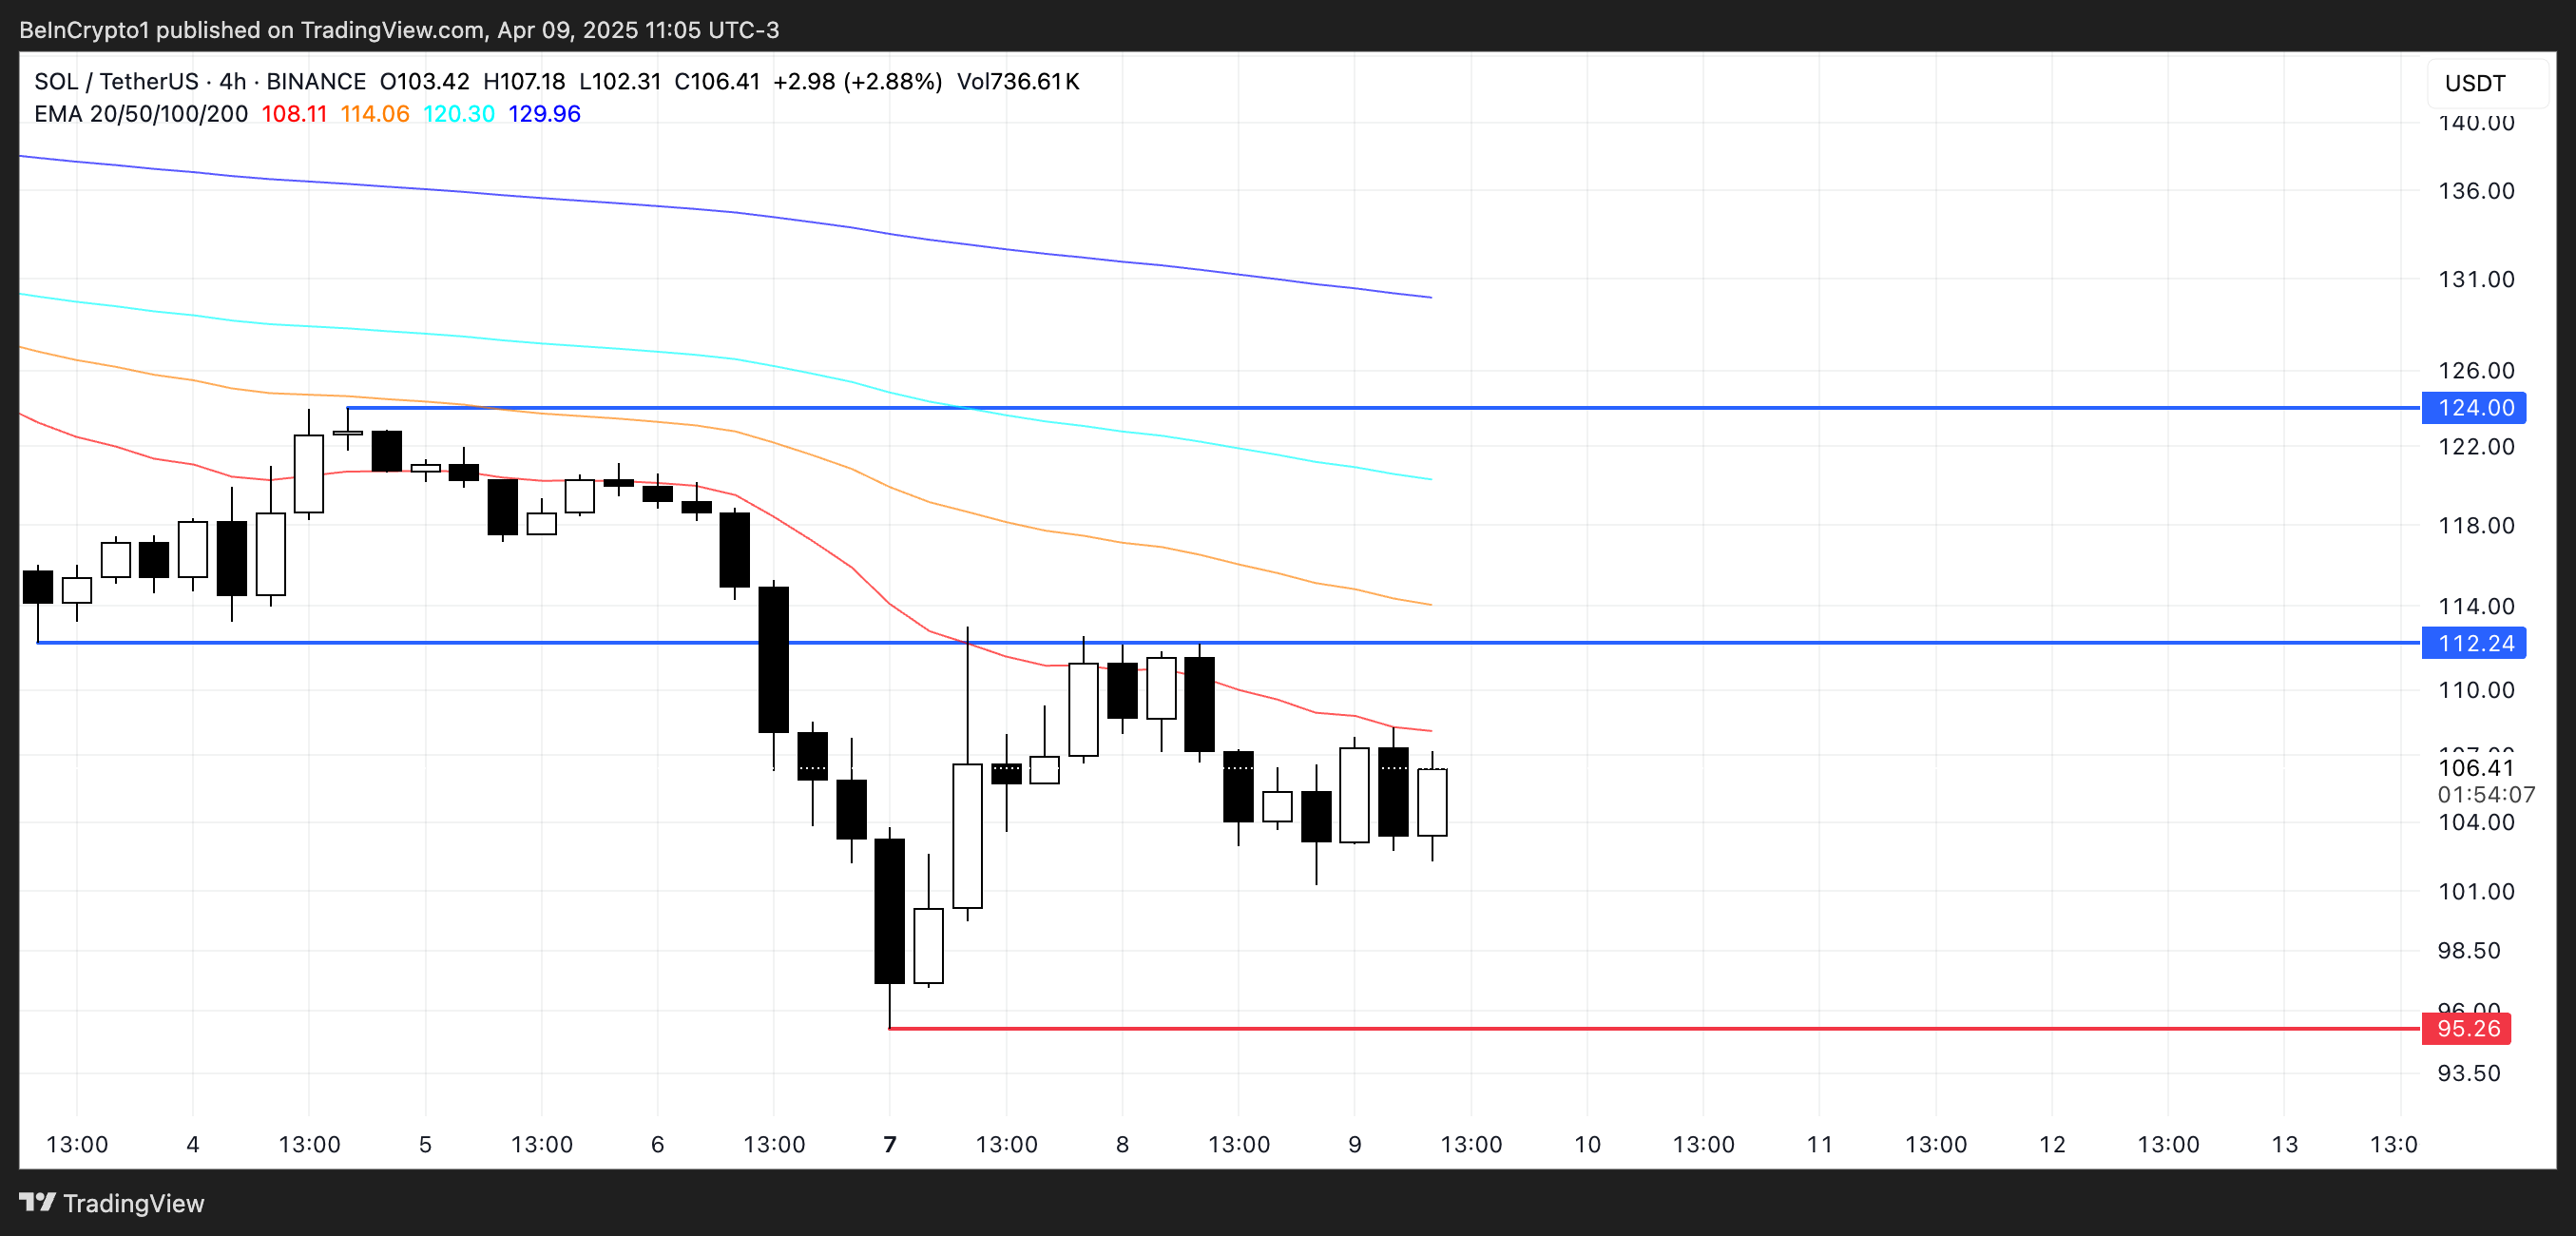
However, if Solana price manages to sustain the current strength and buying interest, it could test resistance at $120. A break above that level may open the path toward the next target at $134.
On the downside, if the current bearish trend persists, Solana could revisit support near $95, a level that has previously acted as a short-term floor.
Losing this level would be technically significant, potentially pushing SOL below $90—territory not seen since January 2024.
