
Solana (SOL) has stayed surprisingly steady while most large-cap coins struggled to find balance after the recent crash. Over the past 24 hours, the Solana price has slipped just 1.8%, compared to 4.8% for BNB and over 2% for XRP and Dogecoin.
The token has already rebounded by more than 20% from its post-crash lows, suggesting the “Black Friday” jitters have eased. With both holders and traders showing renewed conviction, Solana now appears poised for a larger move — one that could stretch well beyond current levels.
Long- and Short-Term Holders Are Both Accumulating
On-chain data shows that both long-term and short-term investors have been actively positioning — signaling confidence in Solana’s recovery and long-term strength.
The Holder Net Position Change, which tracks how much long-term holders are buying or selling, remains negative but is improving fast. Between October 3 and October 14, long-term holders cut their net selling from about 11.4 million SOL to 6.1 million SOL — a 46% reduction.
Even during the October 10 “Black Friday” crash, when short-term fear spiked, the metric continued improving — suggesting that selling slowed even as prices dipped. This shift likely helped Solana rebound more than 20% from its lows and regain the $200 zone.
Want more token insights like this? Sign up for Editor Harsh Notariya’s Daily Crypto Newsletter here.
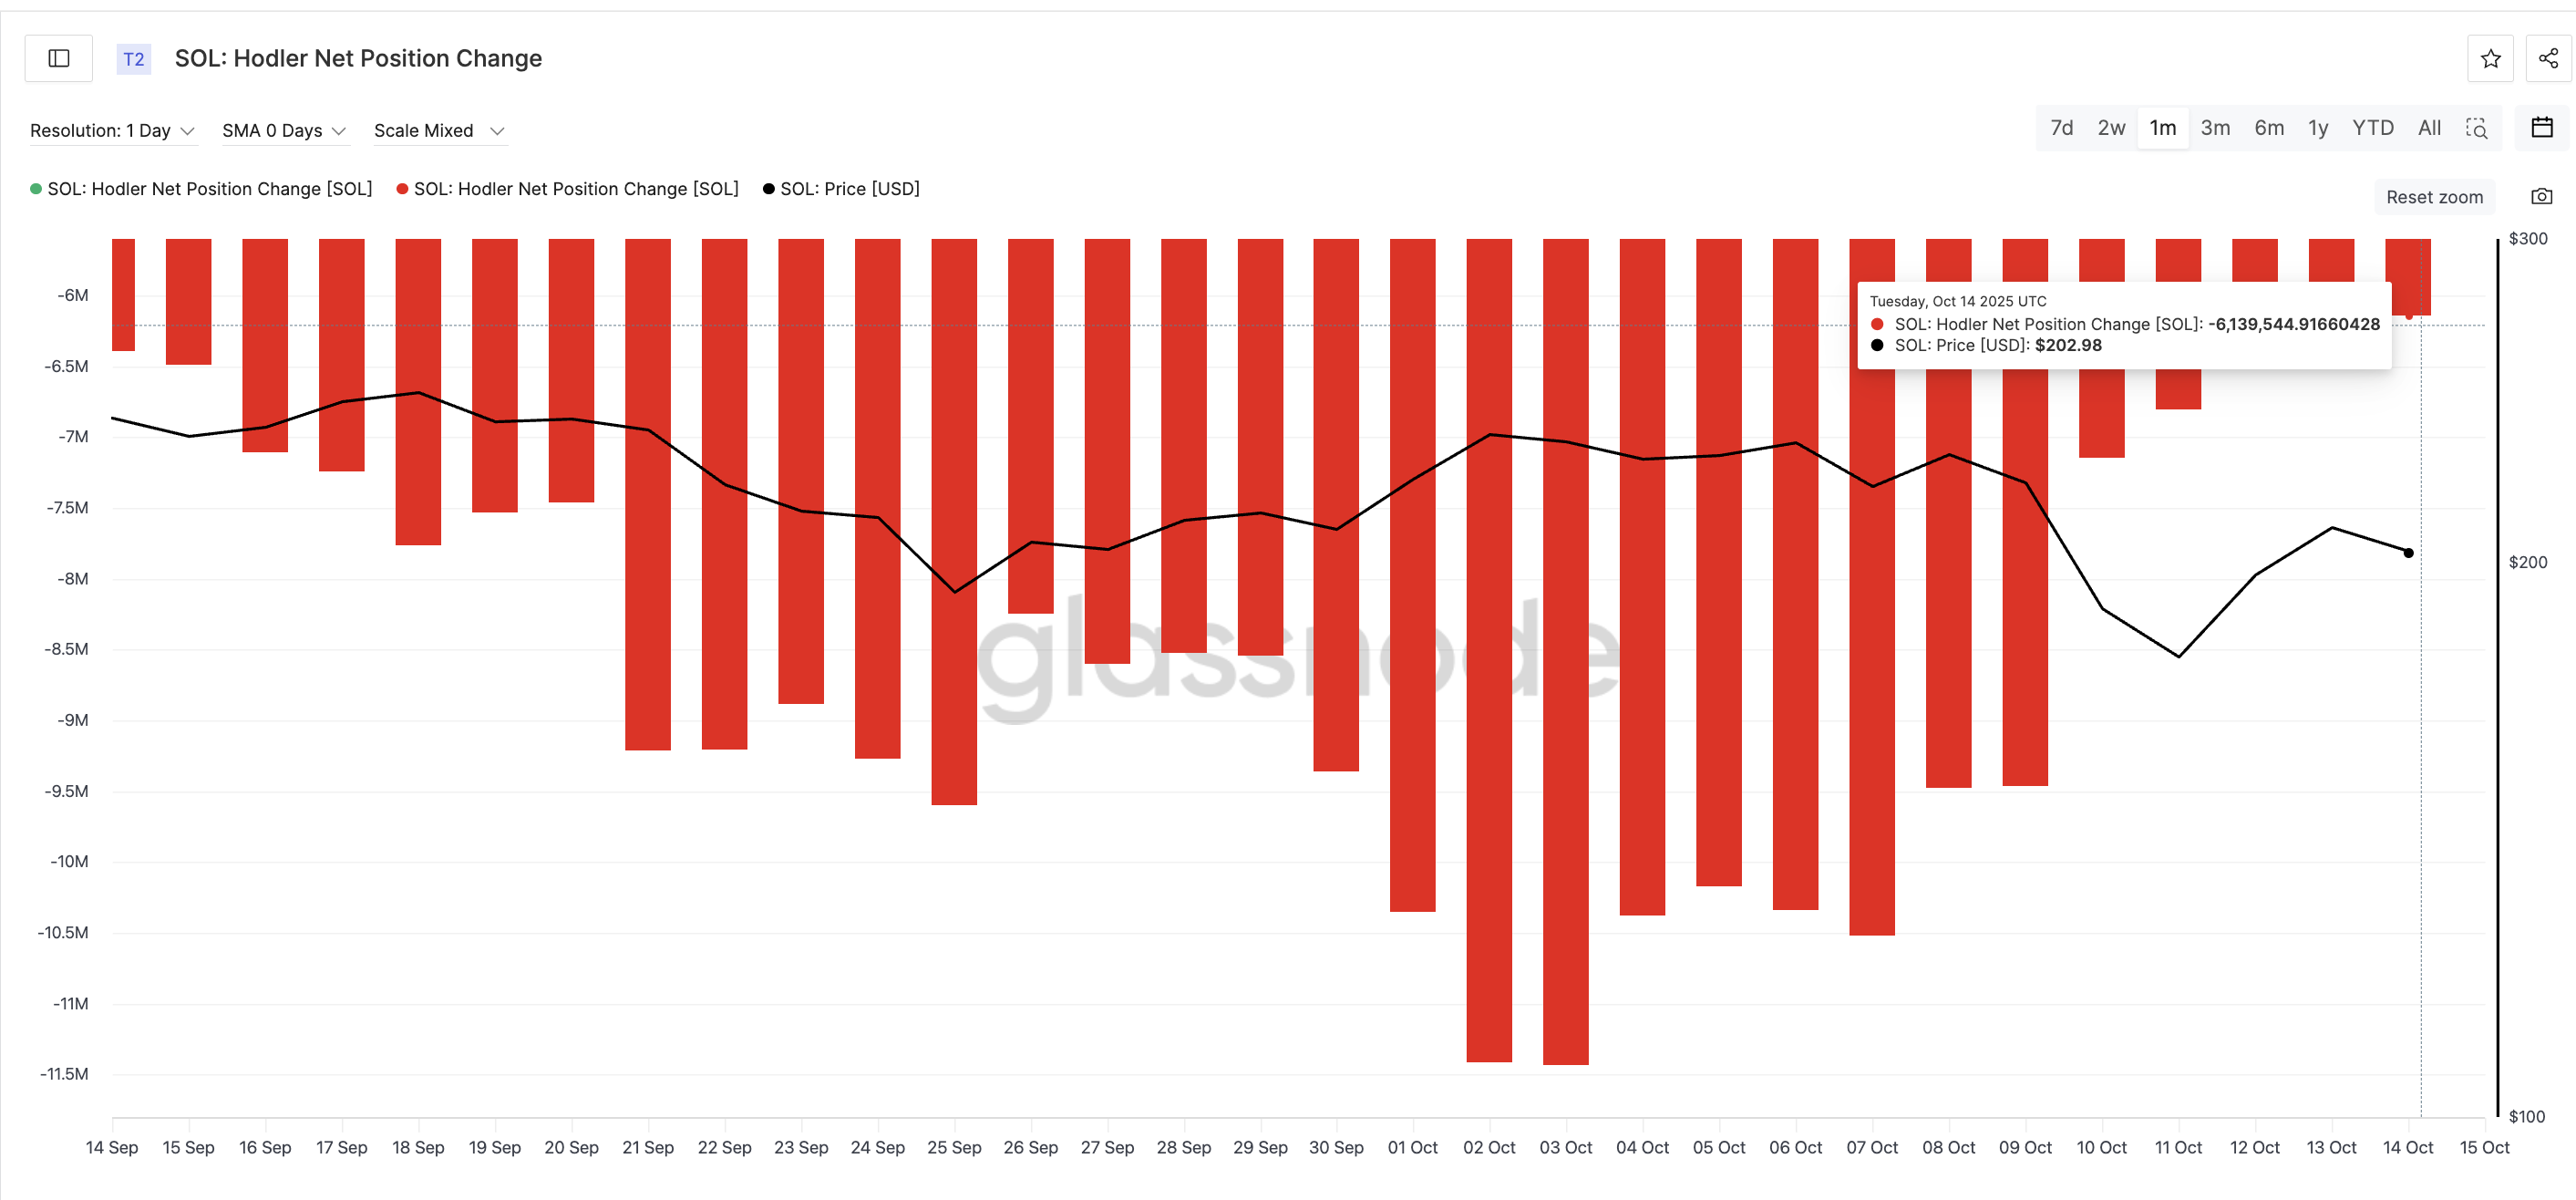
While the indicator hasn’t yet flipped to net accumulation, it highlights how long-term investors are easing off on selling pressure and positioning for strength.
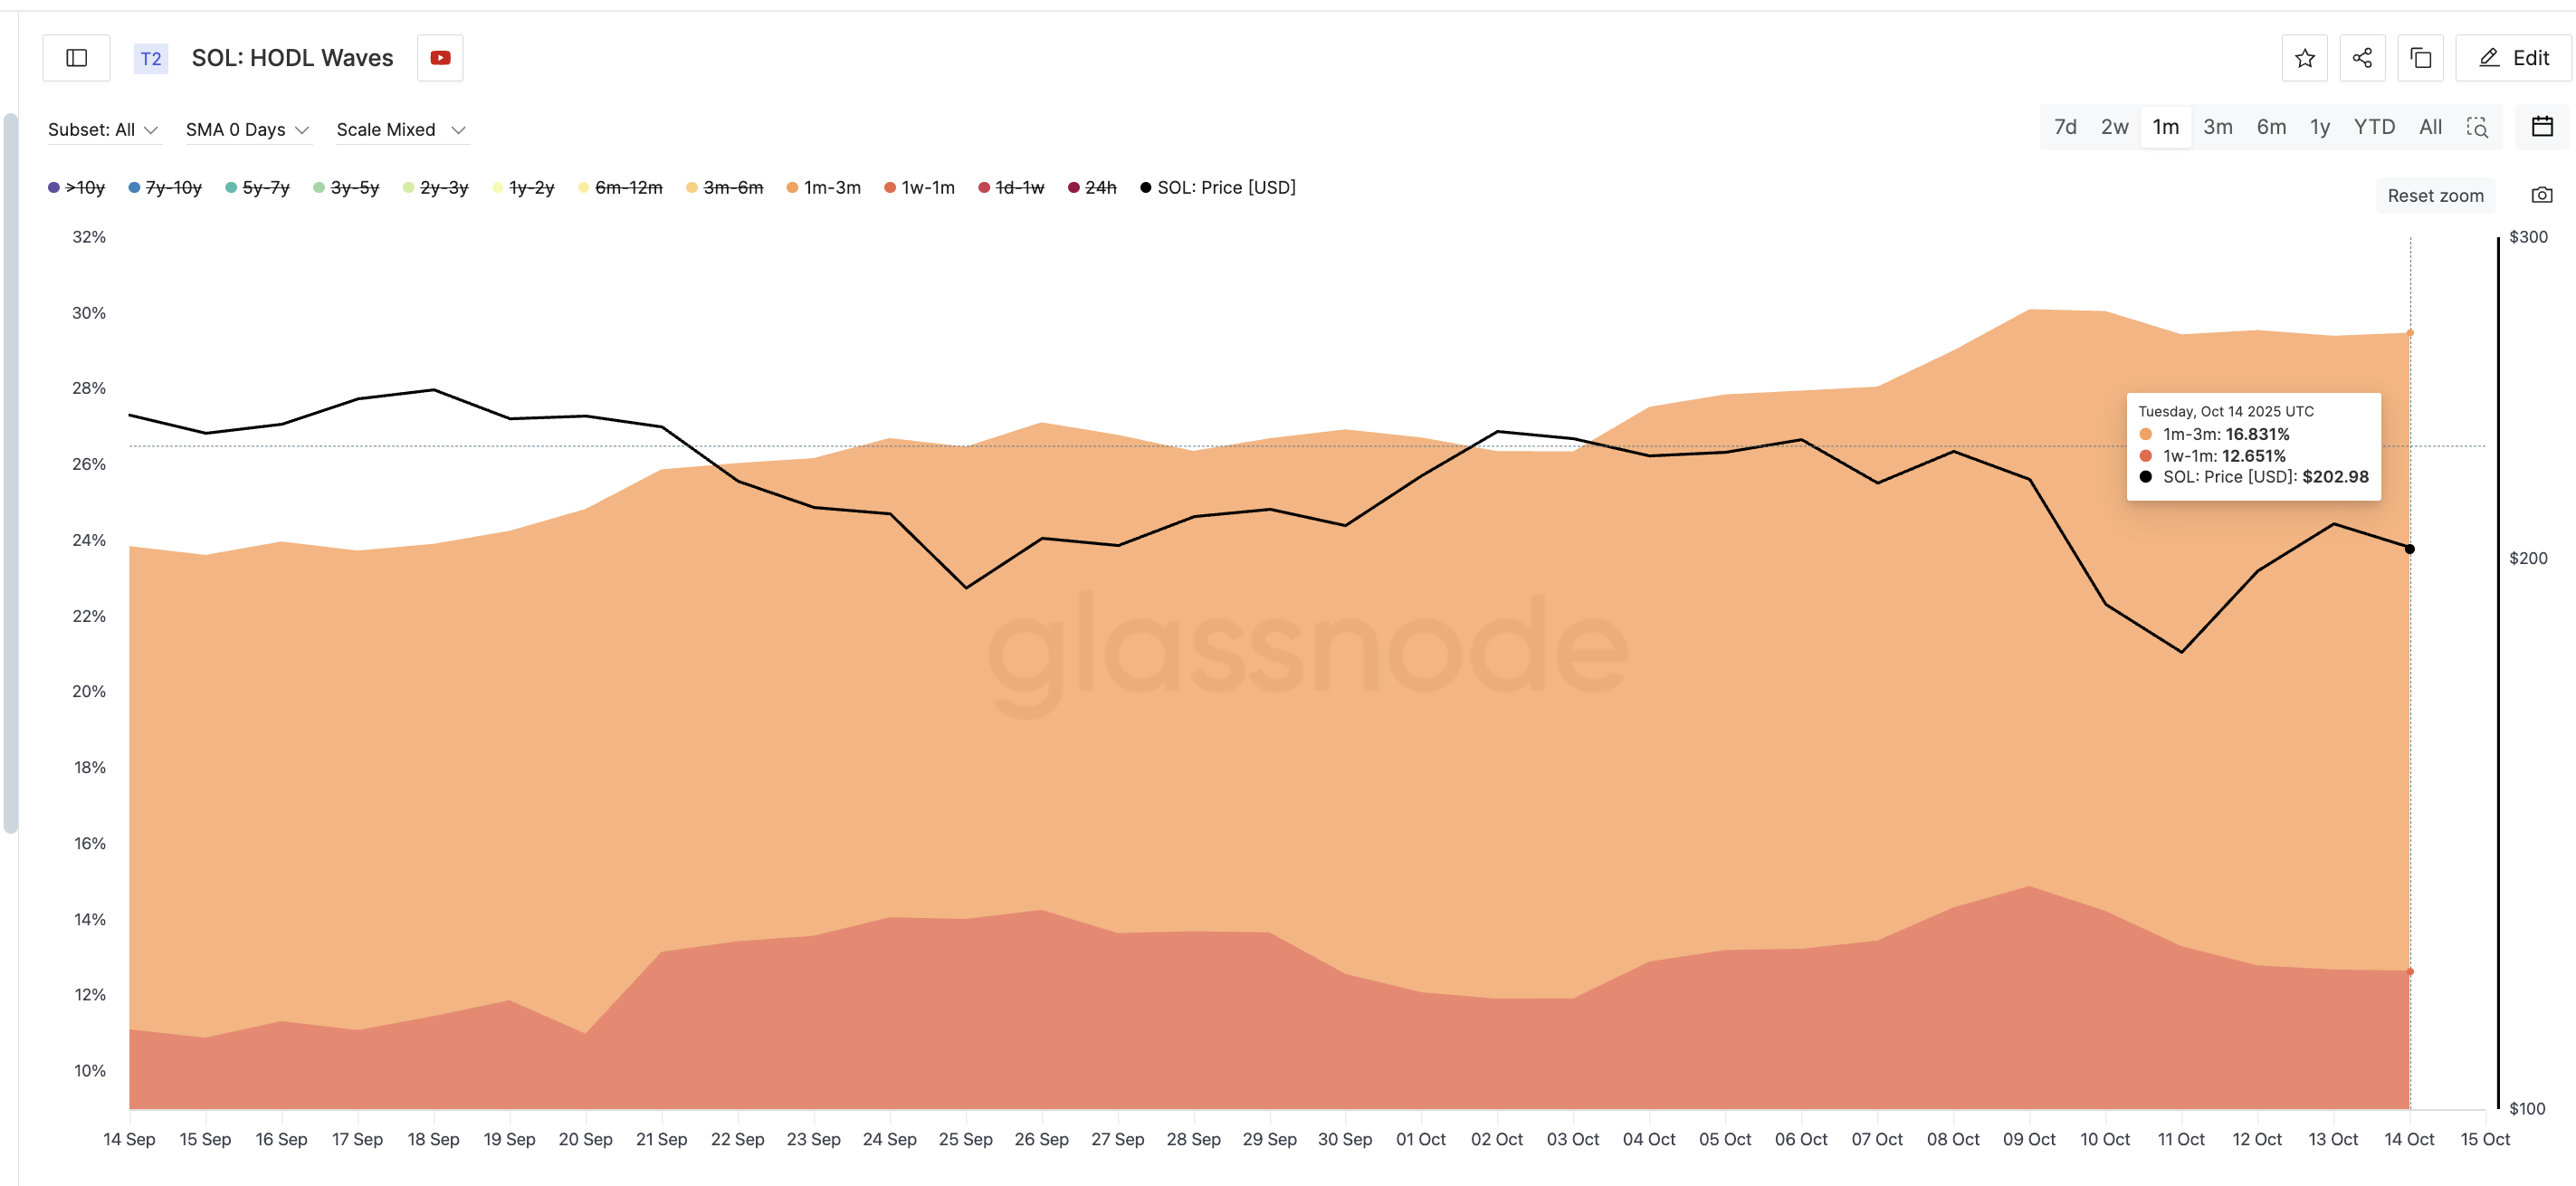
Meanwhile, short-term holders are showing clear accumulation behavior, according to the HODL Waves indicator. The 1-week–1-month cohort increased its holdings from 11.1% on September 14 to 12.65% by October 14, despite briefly trimming during the crash. The 1-month–3-month group also grew its share from 12.74% to 16.83%, one of the sharpest jumps among major coins.
The HODL Waves indicator tracks how much of a coin’s supply is held by wallets of different holding durations, helping identify accumulation or distribution trends.
Together, these shifts show both conviction and discipline — long-term holders reducing exits, and short-term traders quietly buying the dip.
One Channel Pattern Could Unlock $550+ for Solana Price
From a technical standpoint, Solana has been trading inside a broad ascending channel since June 22. Each major swing has respected this structure, with the last move between June and September producing a 100% gain.
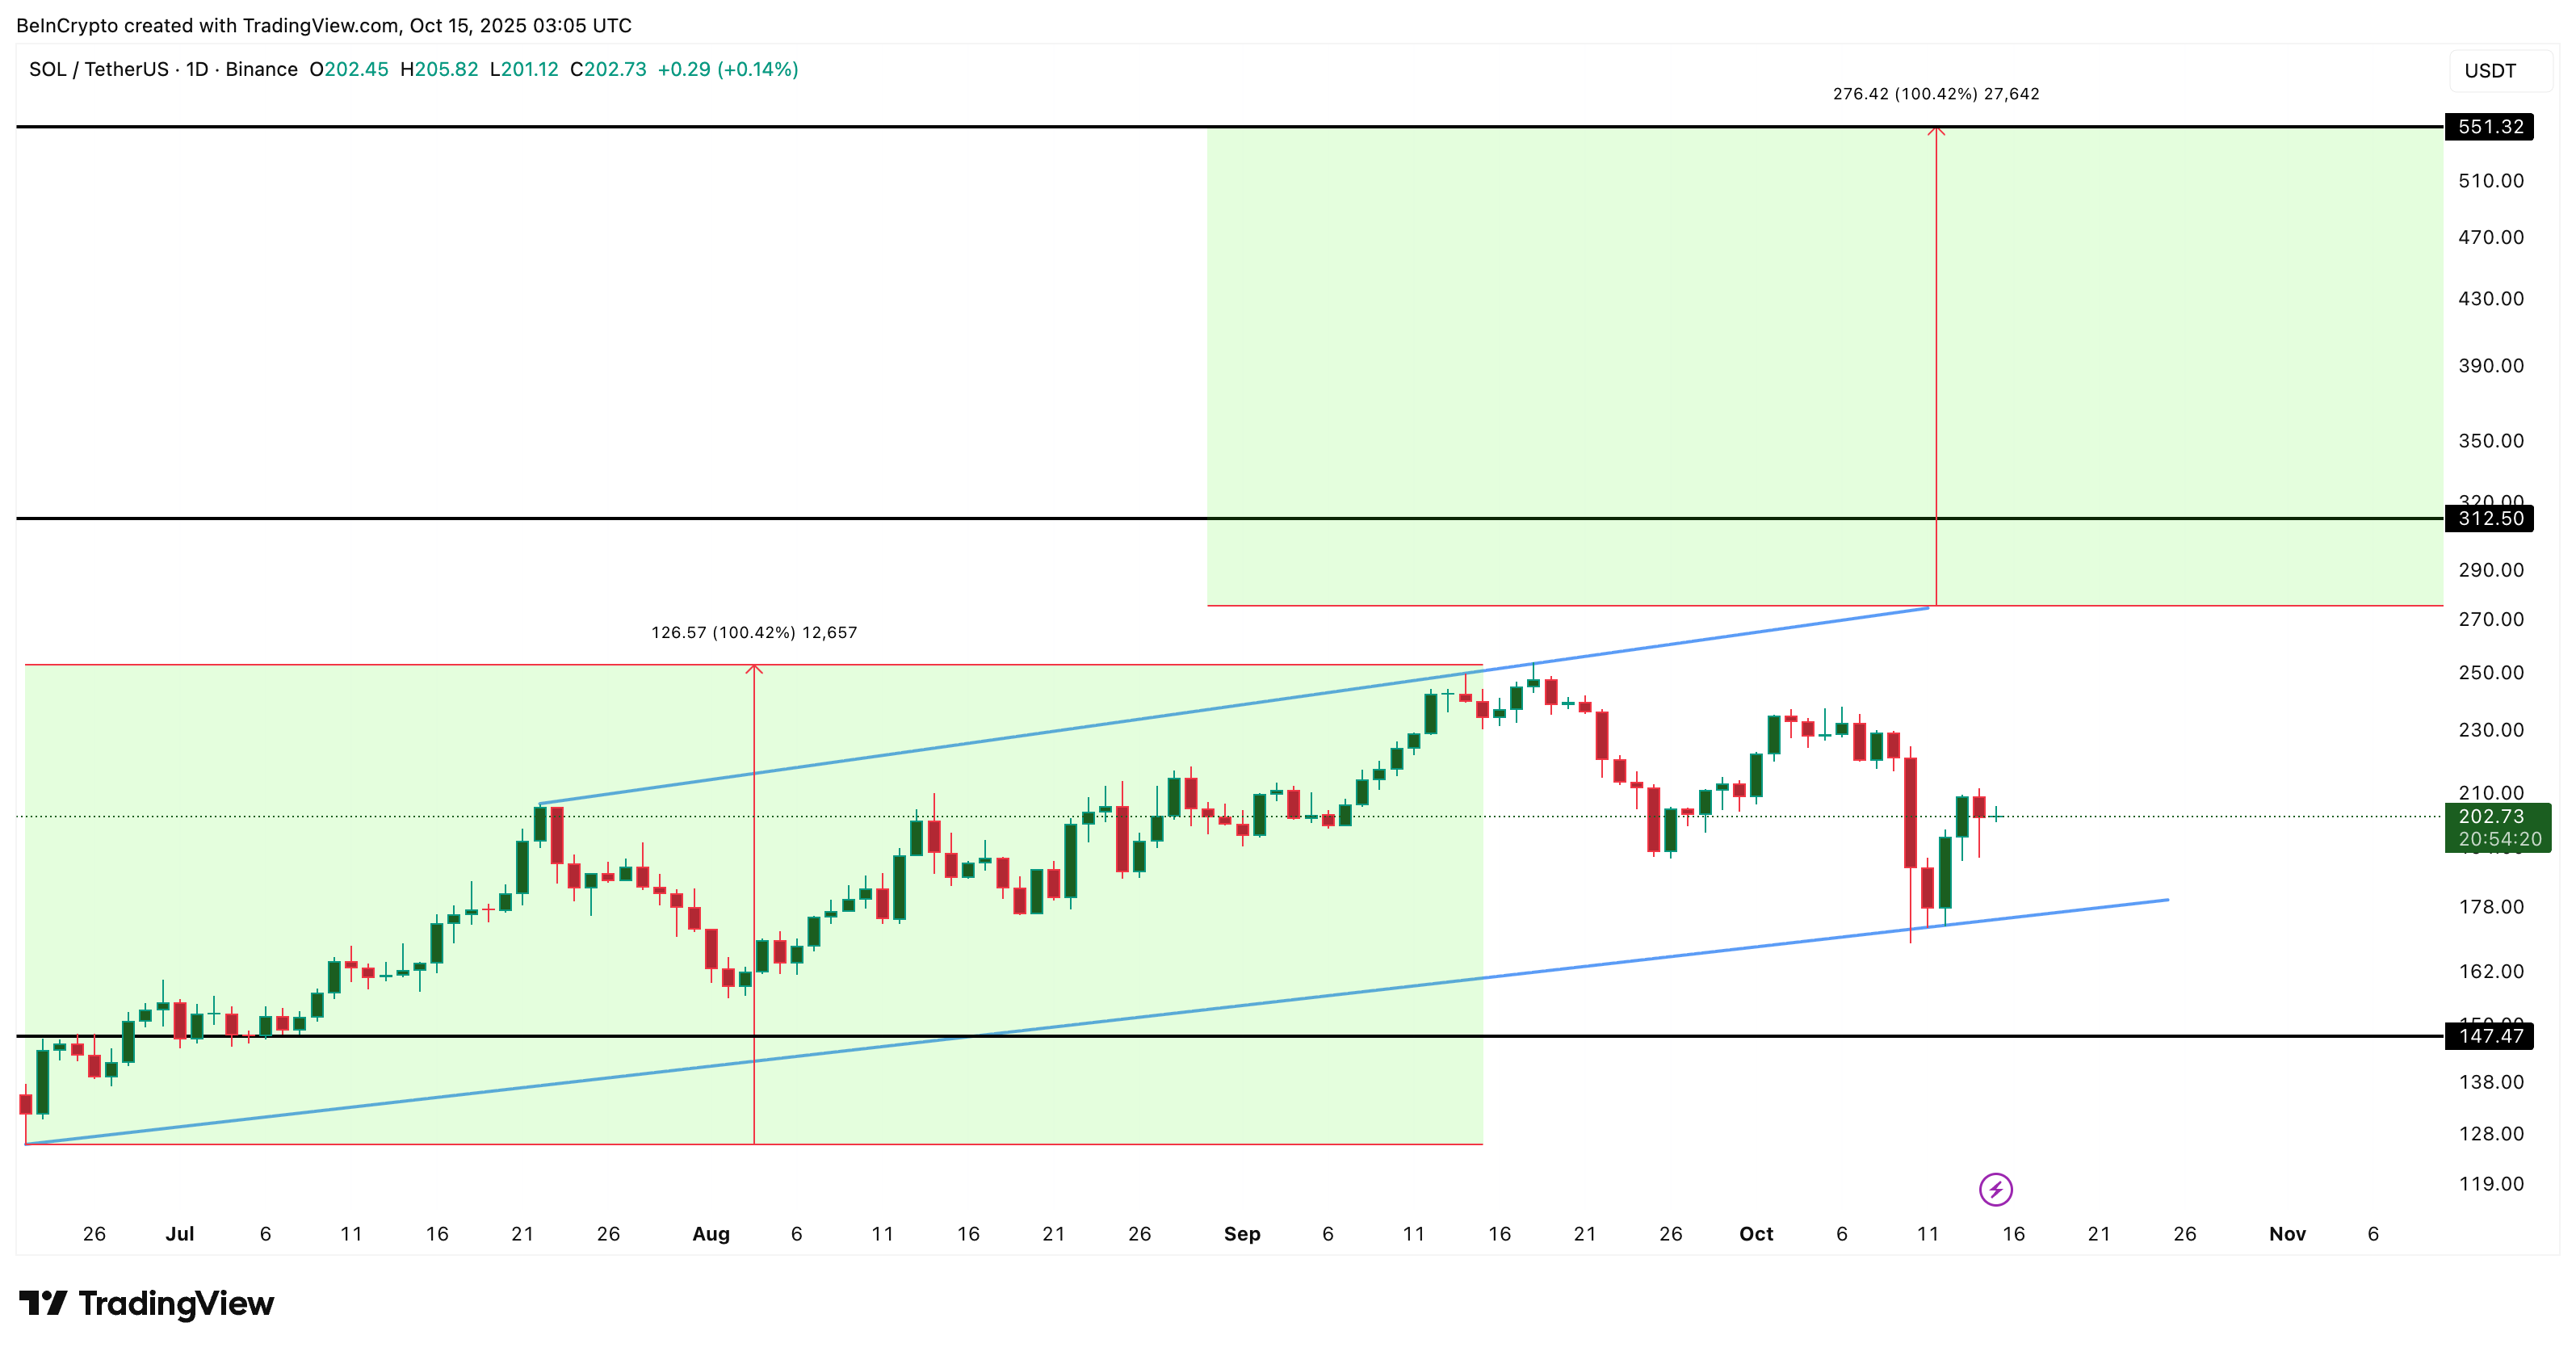
For now, resistance stands at $227 and $250, while a confirmed breakout above $287 would signal a breakout from the channel. Fibonacci extension projections then point toward $346, $453, $540, and even $599, should momentum stay intact.
This falls in the 100%+ zone projection, per the ascending channel target math, which specifically points to a Solana price of $551.
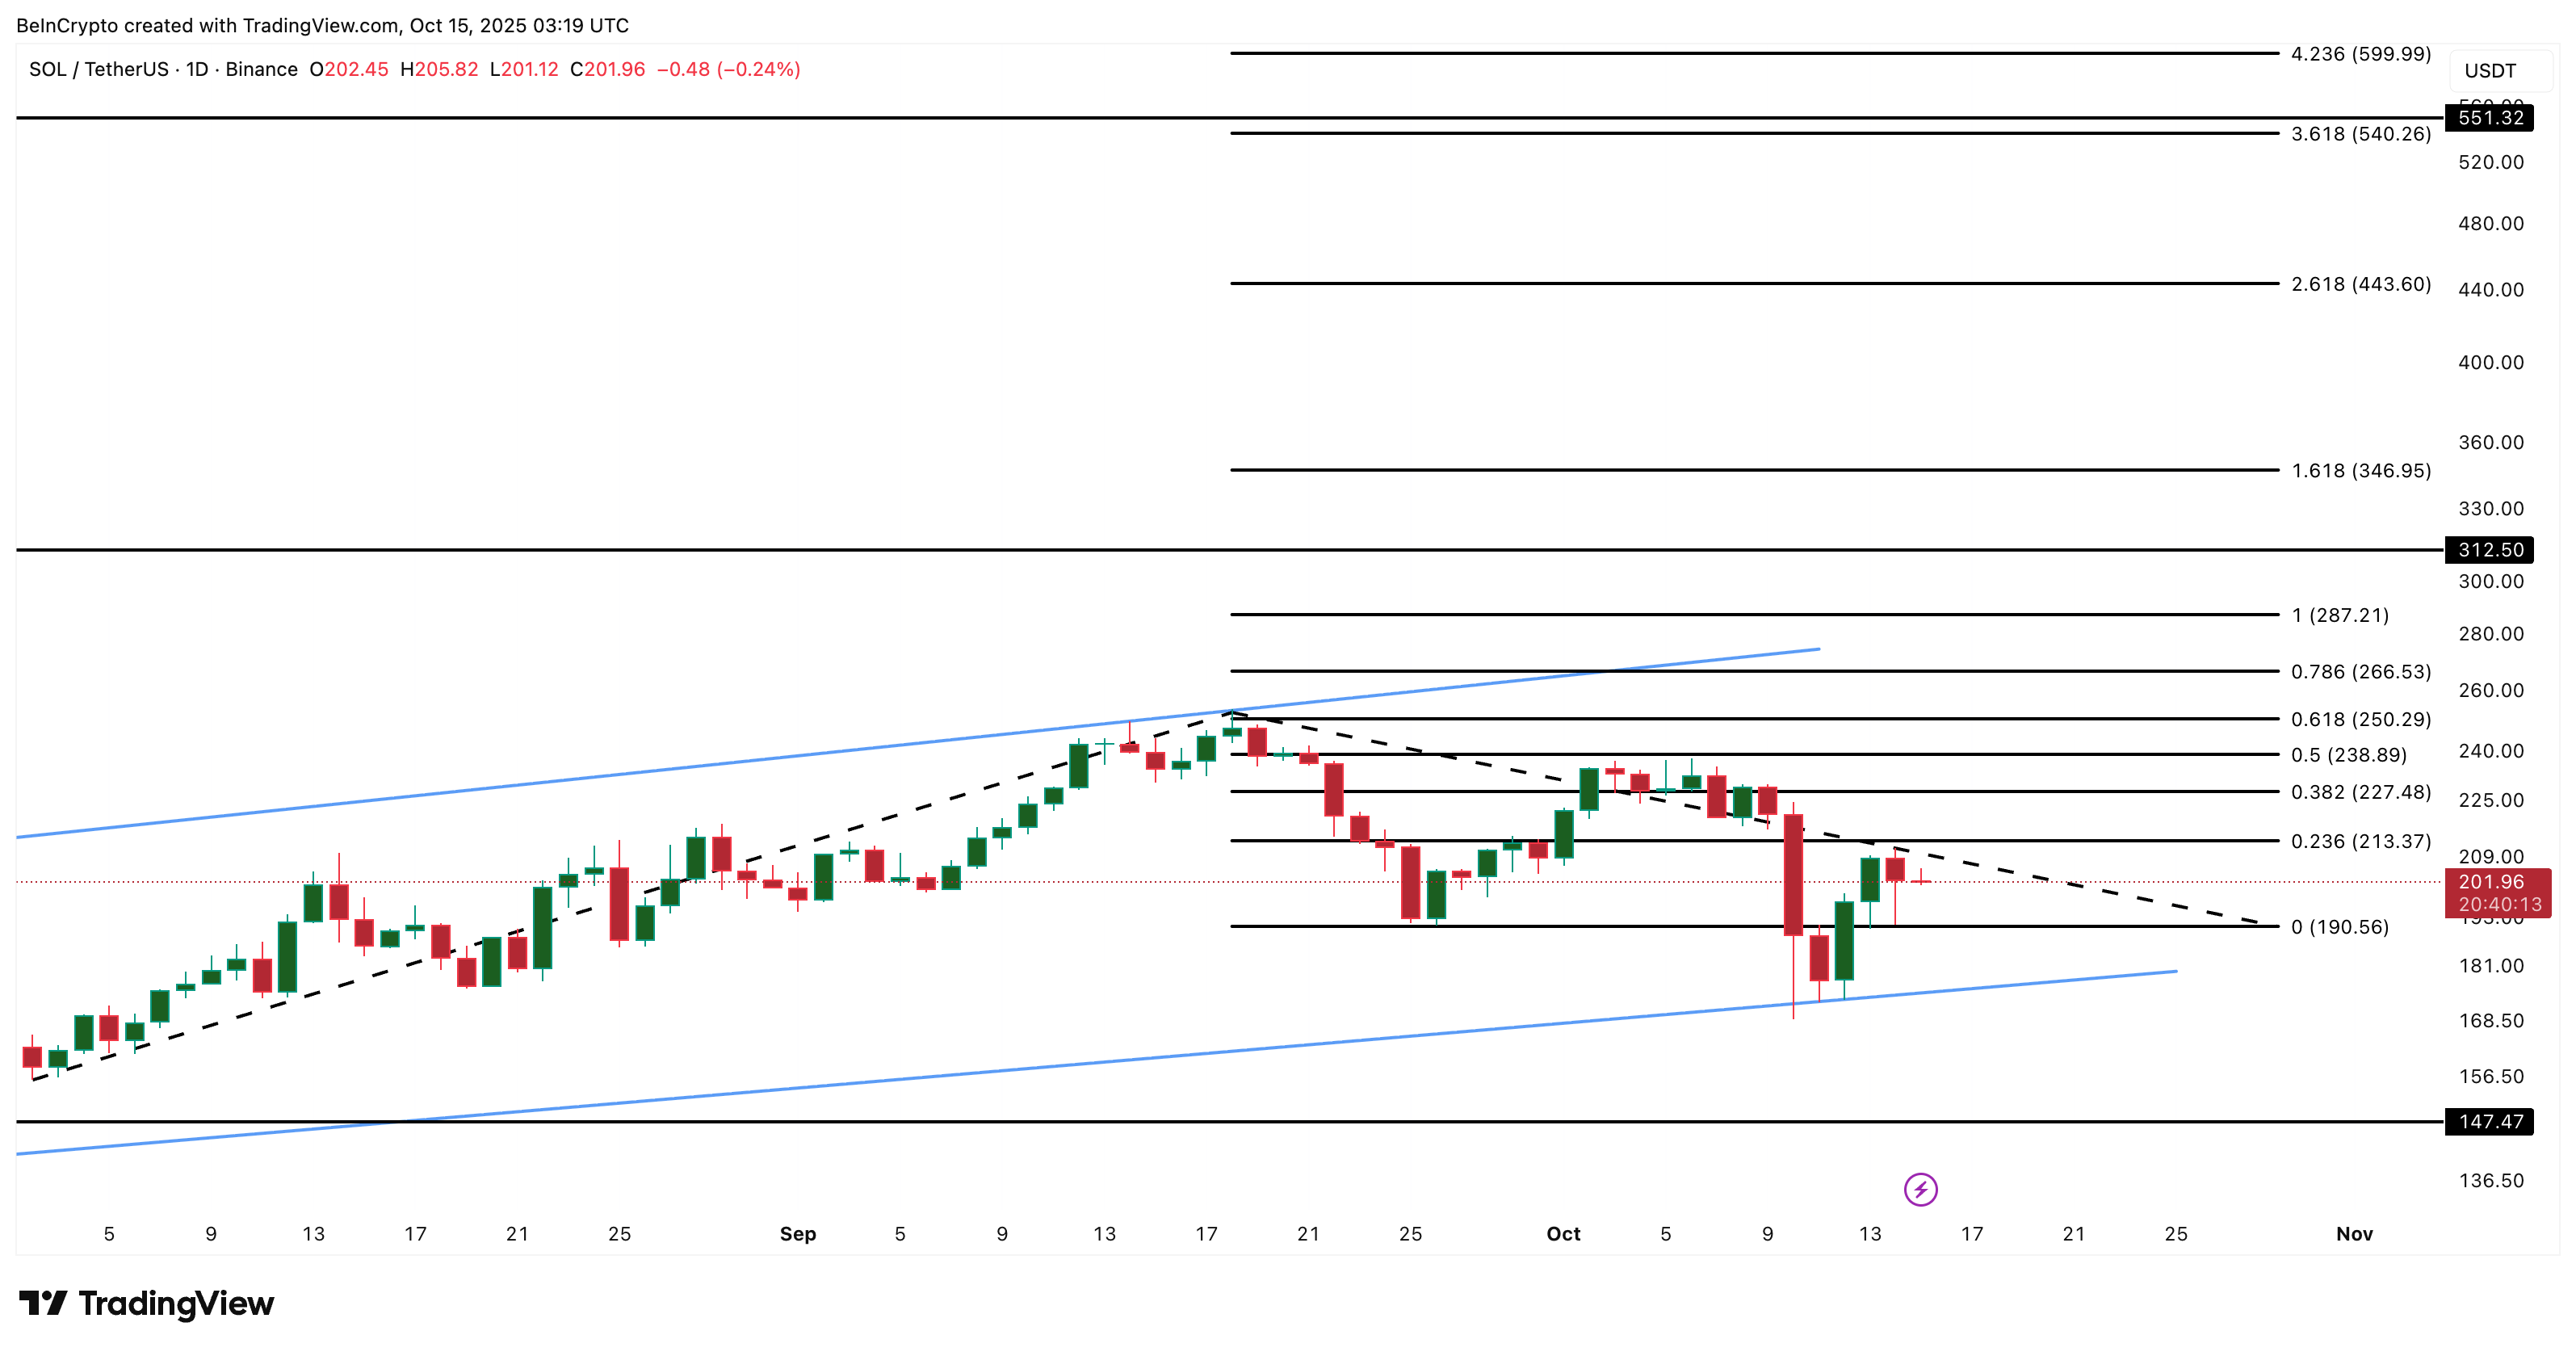
Support remains strong near the $190 region, where buyers have consistently stepped in. As long as Solana holds this range, the broader structure stays bullish. However, a daily candle dip under $190 can push the Solana price towards new lows.
