
Solana (SOL) price has dropped 4.3% in the past 24 hours. While this could look like a routine pause after recent gains, on-chain activity tells a more cautious story.
Both short-term and long-term holders are positioned in ways that have historically signaled capped rallies, and the price chart is printing a structure that often precedes deeper corrections. More when you read through!
Short-Term Holders Sit In Profit-Taking Territory
Solana’s short-term holders are sitting on relatively high unrealized profits, with the STH-NUPL (Net Unrealized Profit/Loss) currently at 0.093. This number is close to the levels observed on May 10–13, when the SOL price corrected from $183 to $131. This elevated NUPL suggests short-term holders are in the hope/fear zone, where locking in profits becomes more tempting.
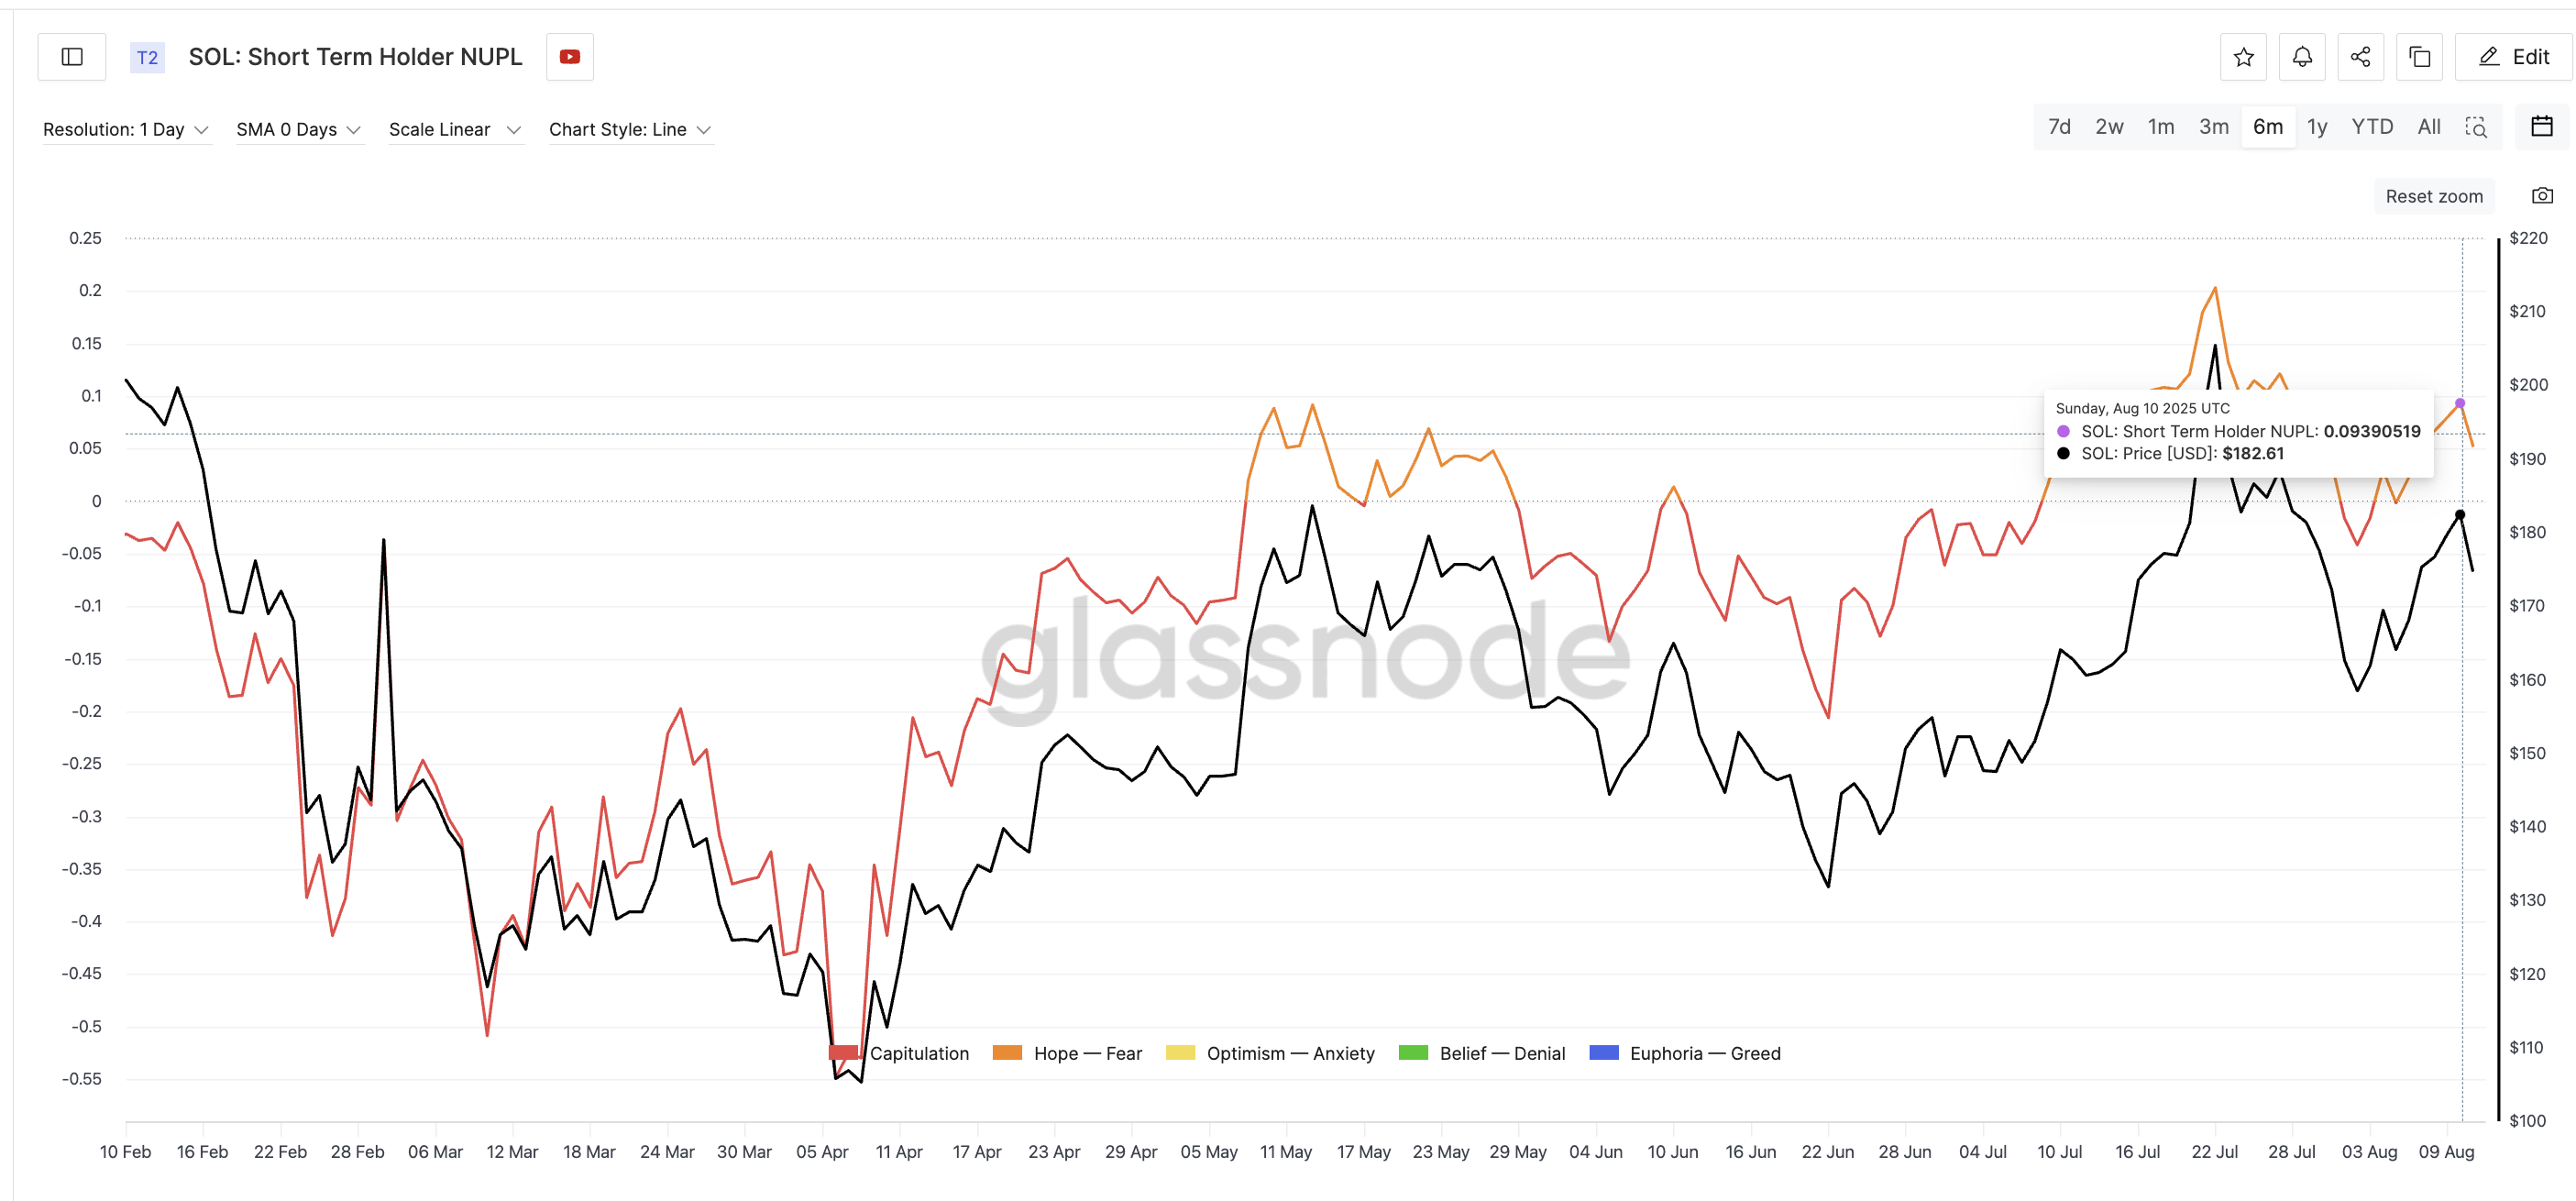
While this metric doesn’t directly confirm that holders are selling, it highlights an environment where profit-taking becomes more obvious, especially if price momentum stalls. The reading is still below the extreme highs, suggesting the market isn’t overheated yet, but it remains high enough to warrant caution.
STH-NUPL measures the average unrealized profit or loss of coins held by short-term holders. High readings mean holders are in profit and may be more likely to sell.
For token TA and market updates: Want more token insights like this? Sign up for Editor Harsh Notariya’s Daily Crypto Newsletter here.
Long-Term Holders Trim Positions
If short-term holders create immediate sell risk, long-term holders set the tone for bearish trend strength. Recently, they’ve been trimming positions; a subtle but important signal. The Solana price, over the past month, has responded every time the net position metric changed. Prices dipped when the metric dipped and vice versa.
The Hodler Net Position Change metric, which tracks the monthly net accumulation or distribution of long-term investors, has been dipping for several weeks. That means long-term holders are selling more than they’re buying, showing less willingness to hold through this resistance zone.
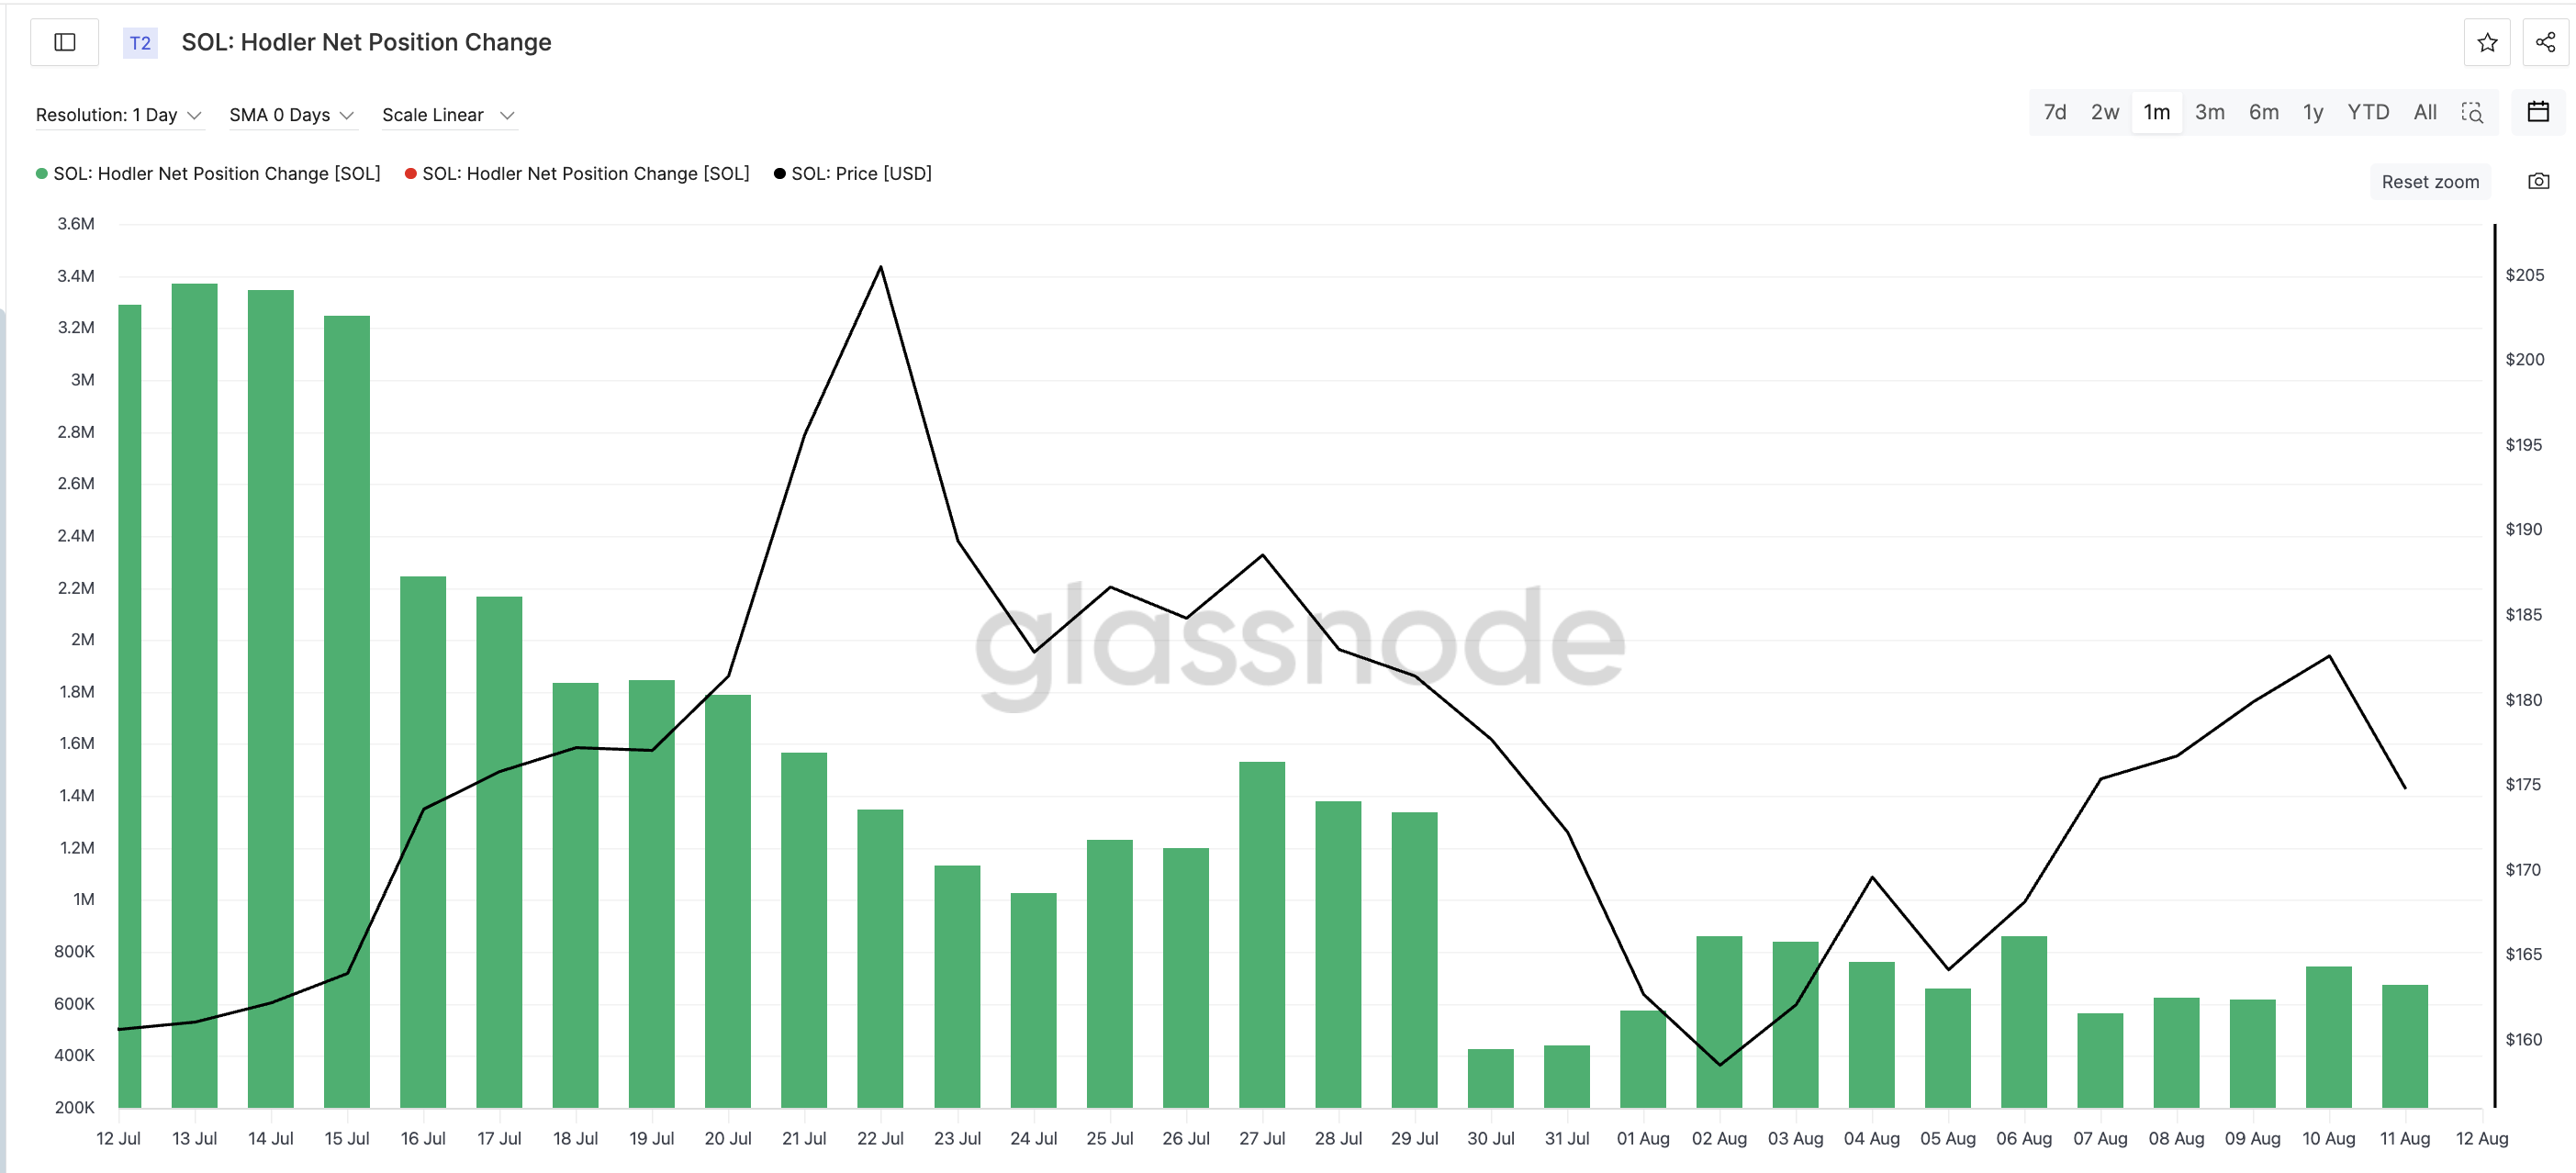
This behaviour often limits upside because it removes the strong-hands buffer that supports the SOL price during pullbacks. Combined with the elevated short-term holder NUPL, it creates a scenario where both cohorts could add to selling pressure rather than absorb it.
Two-Day Chart Shows Bearish Solana Price Compression
The Solana price action is reinforcing what the on-chain data suggests. On the two-day timeframe, Solana is forming a descending triangle — lower highs pressing against a flat support base.
This pattern is often seen in distribution phases, where rallies fade sooner and breakdown risk builds. On a longer timeframe (2-day), in this case, the breakdown risk increases.
A descending triangle is a bearish technical pattern that forms when sellers consistently cap highs while buyers defend a fixed support level. Pressure often resolves downward if support fails.
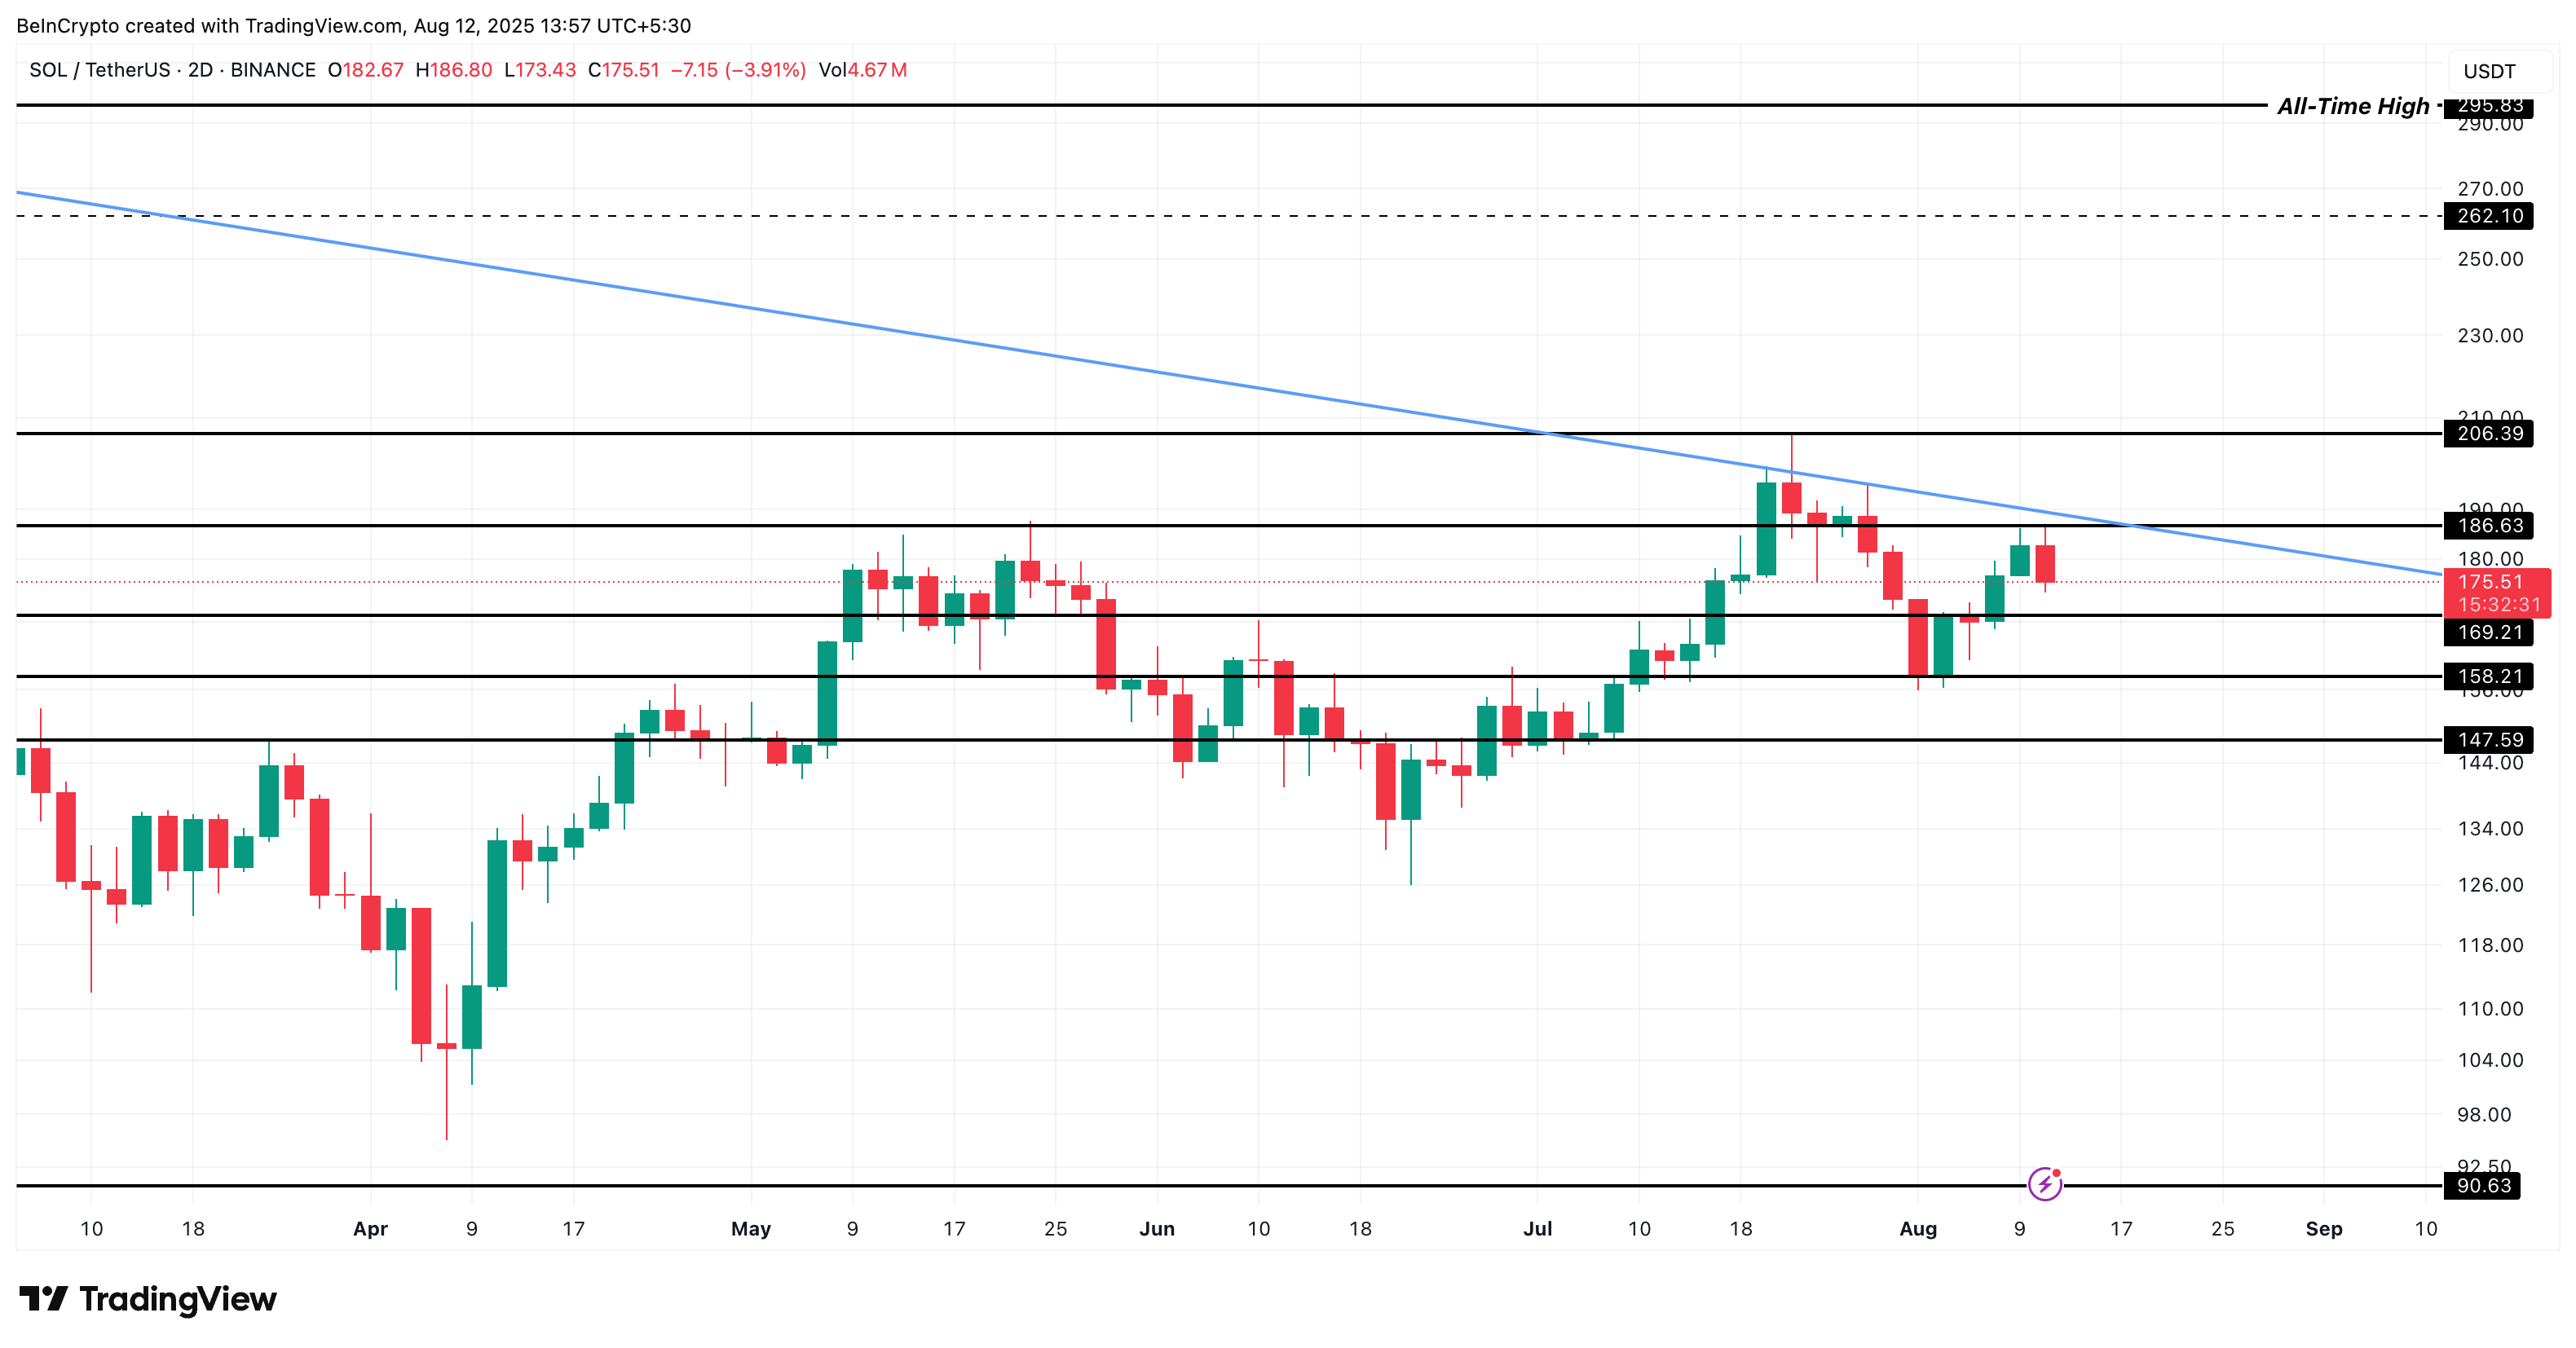
The immediate resistance to invalidate the bearish pattern remains $186, with key support levels at $169 and $158. A close below $158 would confirm a breakdown from the triangle, potentially opening deeper downside. The $147 level flips the entire structure bearish in the mid-term.
The bearish case would weaken if SOL breaks and closes above $186, ideally accompanied by falling short-term holder NUPL and a flip back to net accumulation by long-term holders. That would signal that selling pressure is easing and could open the path to retesting $205.
