
Solana price recently surged past the $200 mark but has since corrected. It now trades around $185, down over 6% day-on-day. Much like Solana-based meme coins, Solana’s core token also appears to be in a short-term cooldown phase.
But is this just a healthy dip before a bounce? Or are deeper losses brewing? On-chain activity and key technical zones tell a story of a strong support cluster just below, hinting that a reversal might not be far off.
New Wallets Are Still Showing Up
Despite the dip, short-term holders are not bailing; they’re entering. The 3-month HODL Waves chart shows a spike in the “1 day to 1 week” wallet band, suggesting that new buyers are accumulating Solana.
Both key short-term HODL bands have increased during the recent dip:
- 1-day to 1-week wallets jumped from 6.67% to 8.67%, a 30% increase
- 1-week to 1-month wallets rose from 8.73% to 9.3%, about a 6.5% increase
For token TA and market updates: Want more token insights like this? Sign up for Editor Harsh Notariya’s Daily Crypto Newsletter here.
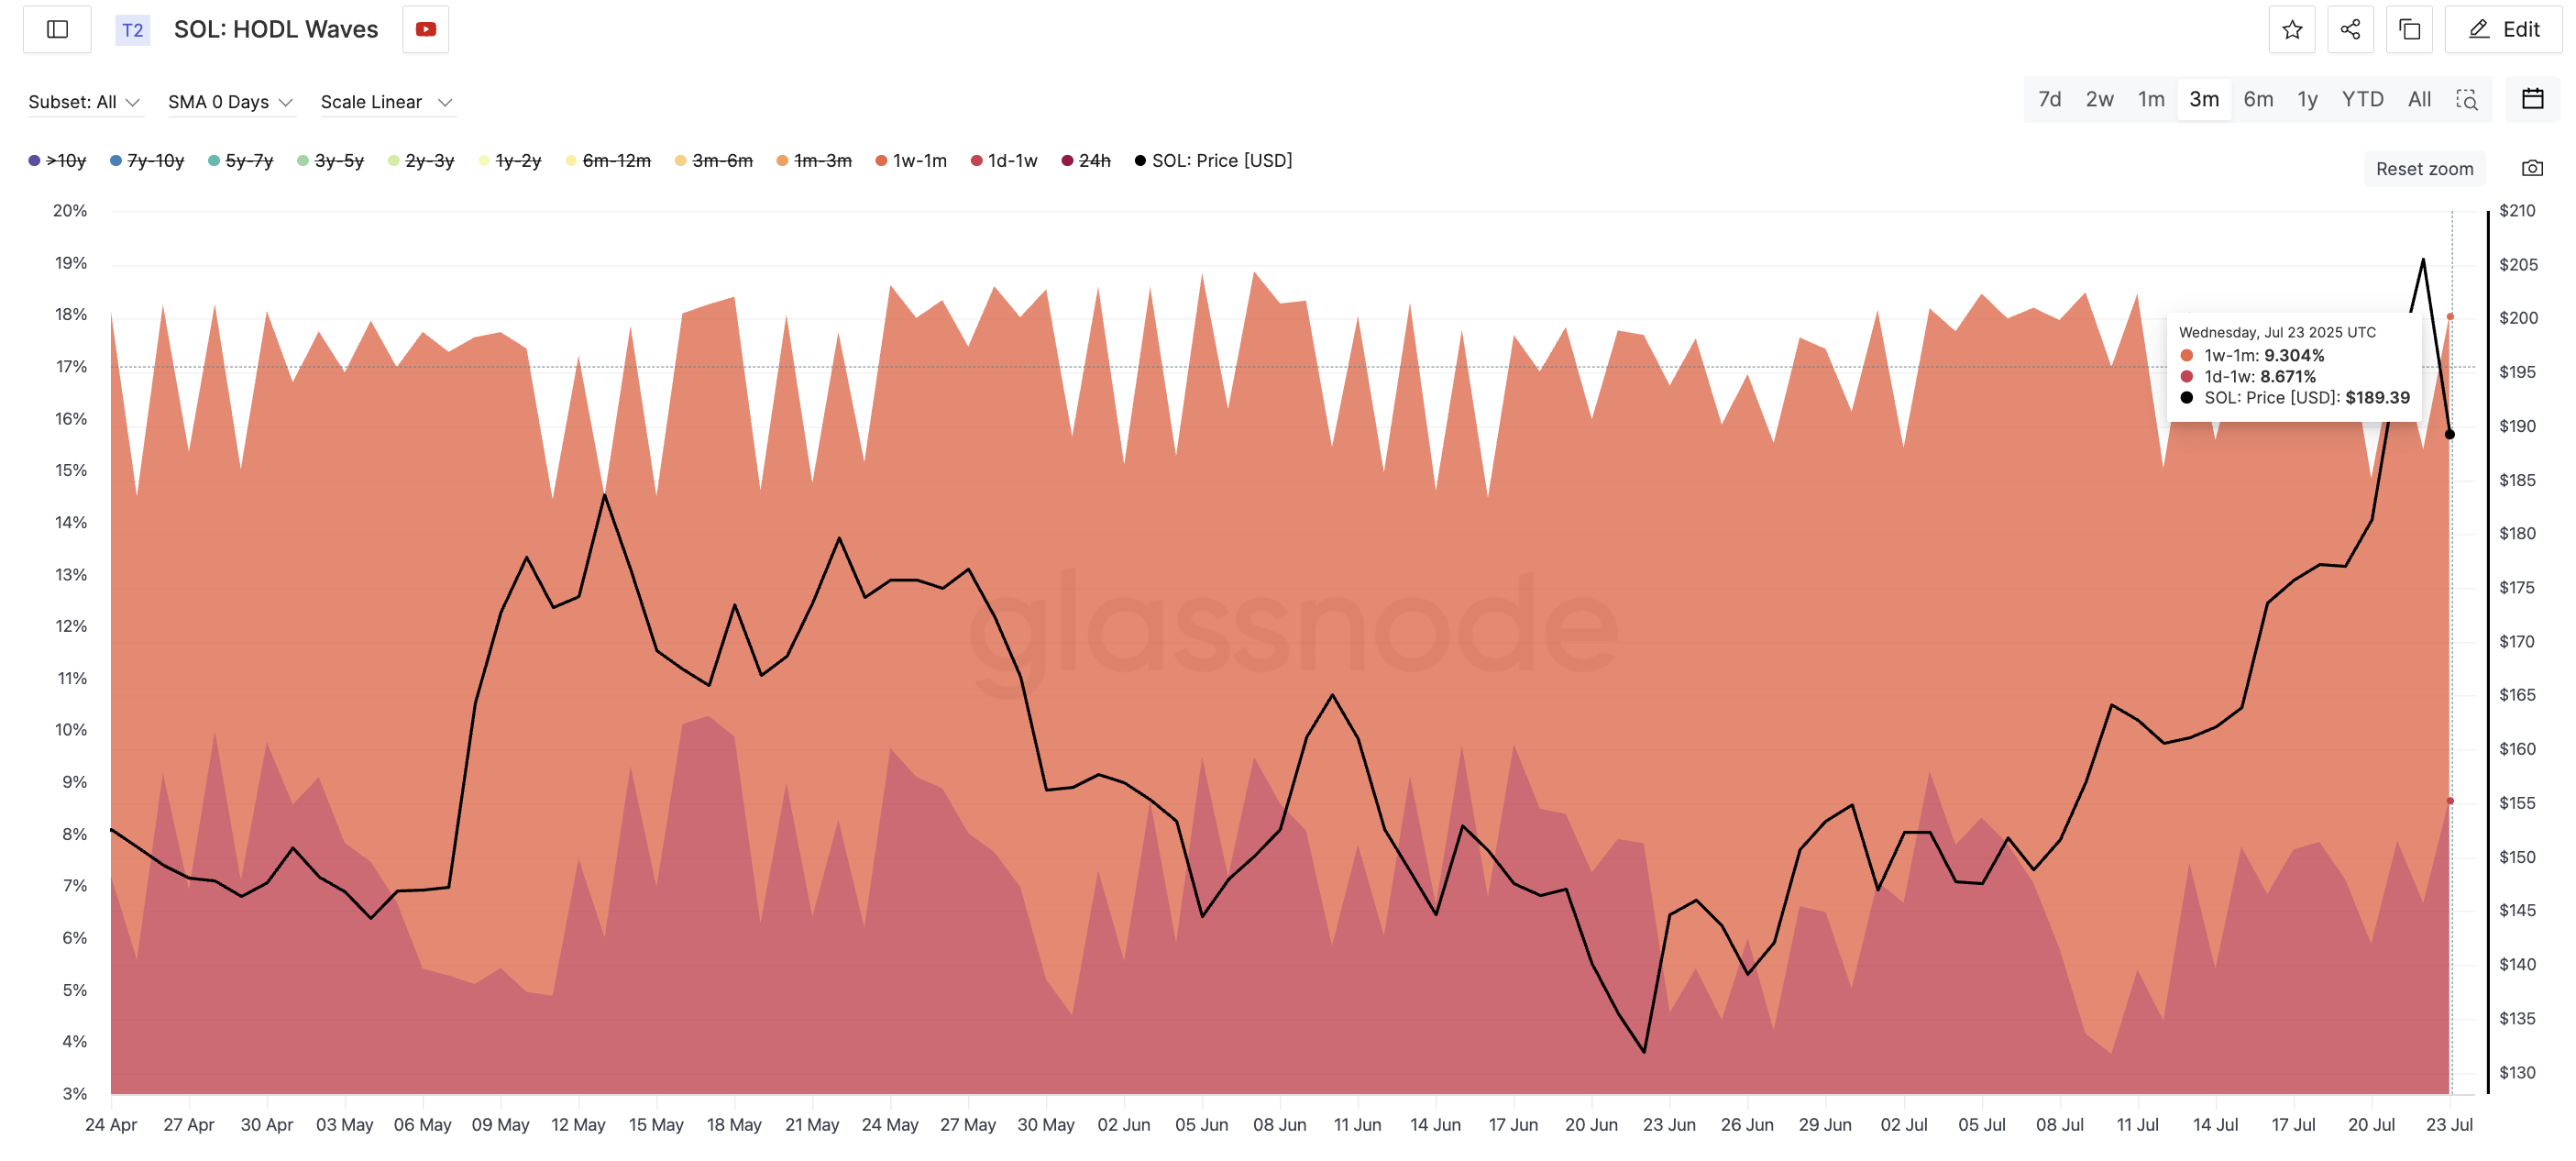
This spike is important because it mirrors a previous trend from May, when Solana saw a price dip followed by an increase in this same short-term wallet band. Back then, the dip eventually reversed. A similar rise now hints at growing buyer conviction, even as price cools.
In short, wallets holding Solana for less than a week are increasing, not exiting. That’s typically a bullish sign during corrections.
HODL Waves measure the distribution of coins by age of holding. A rise in younger bands means new buyers are entering the market.
Support Cluster: $175 to $180 Zone Remains Intact
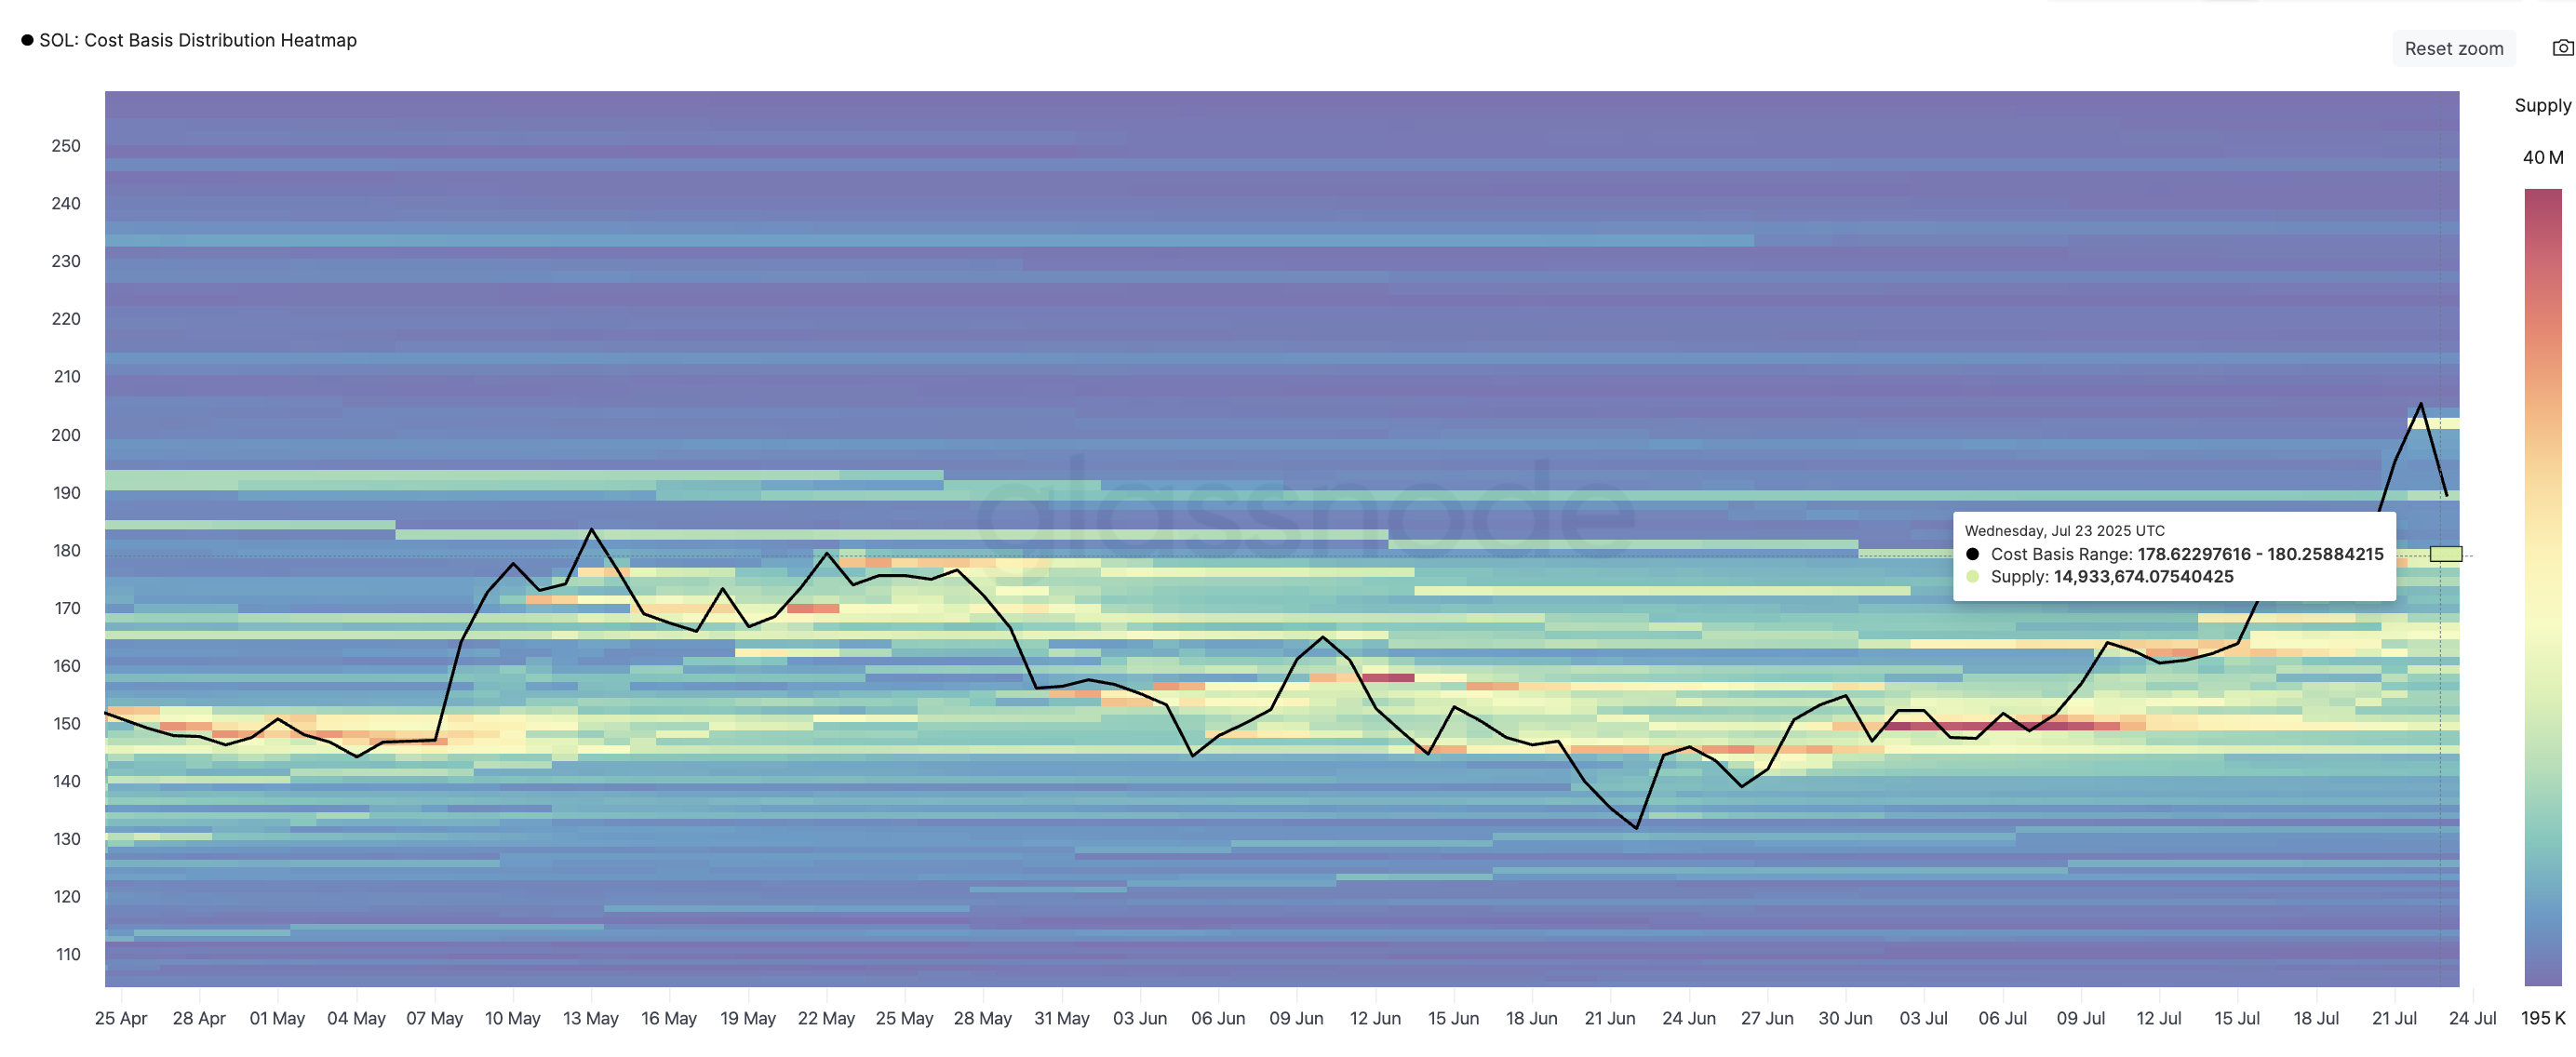
The next thing to watch is whether Solana holds its current support levels. The Cost Basis Heatmap shows a dense cluster of wallet accumulation between $175 and $180, one of the strongest zones since April. This is where many traders bought in and are likely to defend their positions. The total supply within this zone adds up to 38,964,258 SOL.
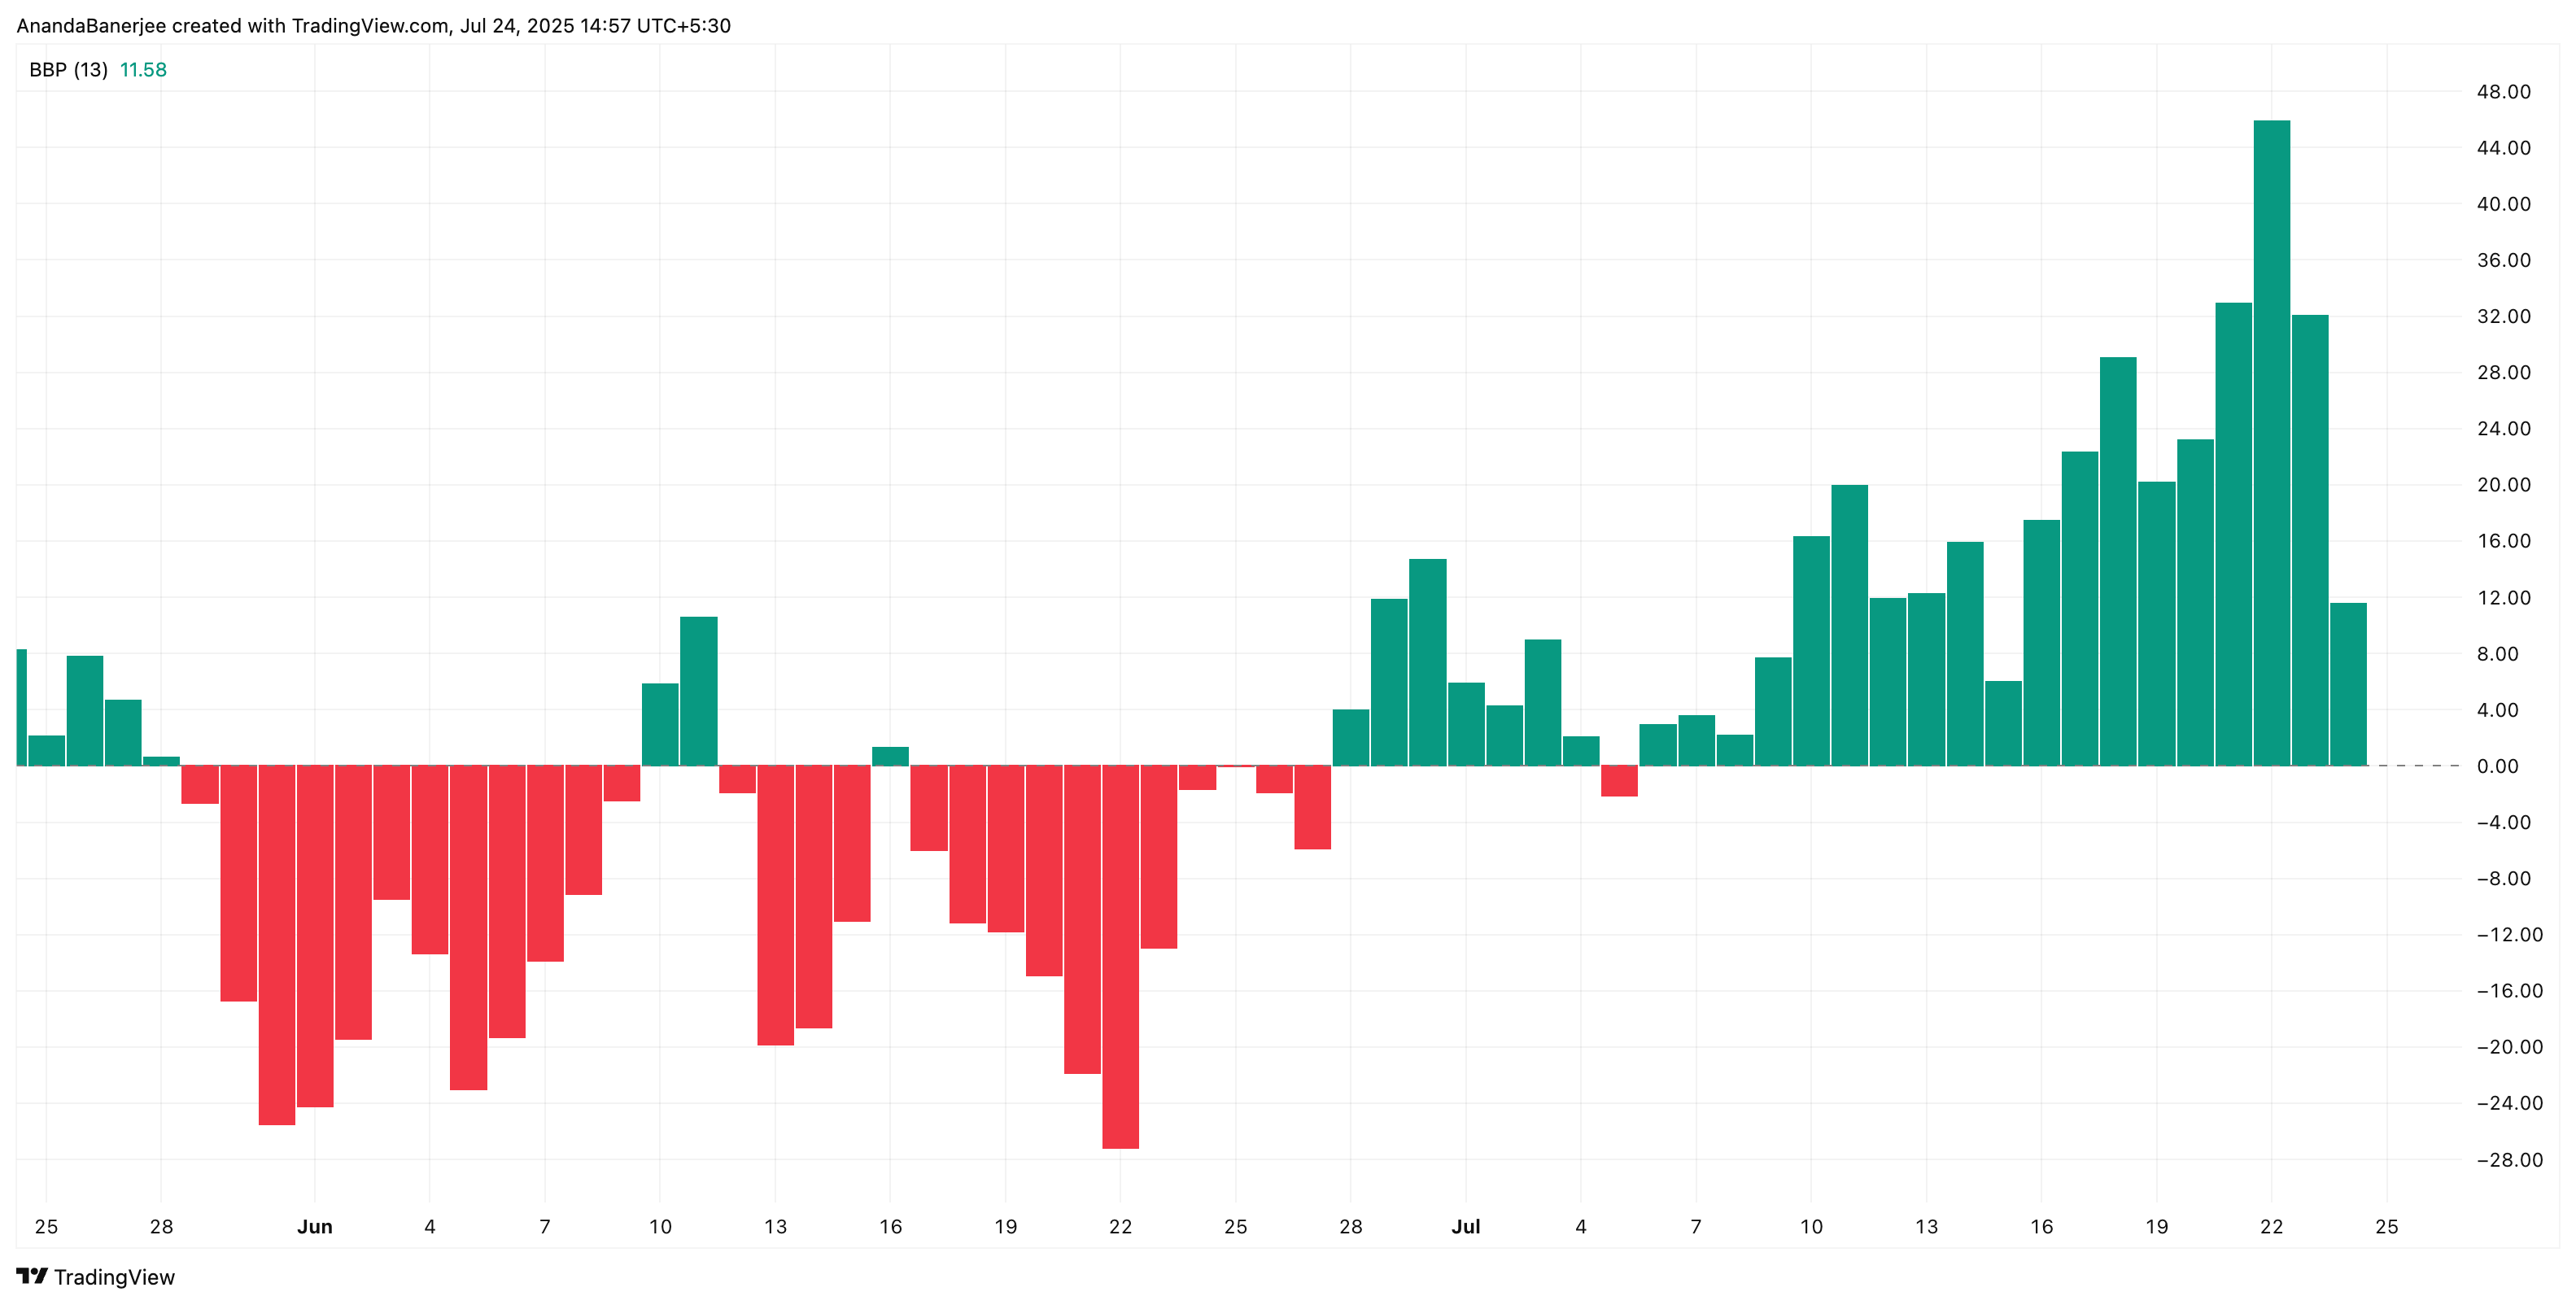
At the same time, the Bull Bear Power Index still favors the bulls. While the indicator has cooled slightly, buyers are still outpacing sellers. That’s a key clue that the dip hasn’t flipped sentiment yet. And that the bulls might just be able to support the price range on the heatmap.
This combination: strong support in the cost basis zone and bulls maintaining control, points to a potential bounce around $175, even if the price dips that low. A drop to that level would only be a 5.4% move from current prices. Unless this range breaks down hard, a quick reversal could be on the cards.
The Cost Basis Heatmap visualizes where the majority of tokens were acquired. Bull-Bear Power gauges who has more control in the current trend: buyers or sellers. And the Bull Bear Power Index measures the strength difference between buyers (bulls) and sellers (bears) to show who’s currently in control of price momentum.
Solana Price Breaks Support But Doesn’t Look Weak, Yet!
From a technical perspective, the Solana price is currently testing the 0.236 Fibonacci retracement level at $187, based on its June low of $126 and July high of $206. While the level was breached at the time of writing, the SOL price seems to be trying hard to reclaim the same.
The next technical support lies at $184. If it fails to hold here, the next strong support sits at $175, which aligns with the starting point of the cost basis cluster.
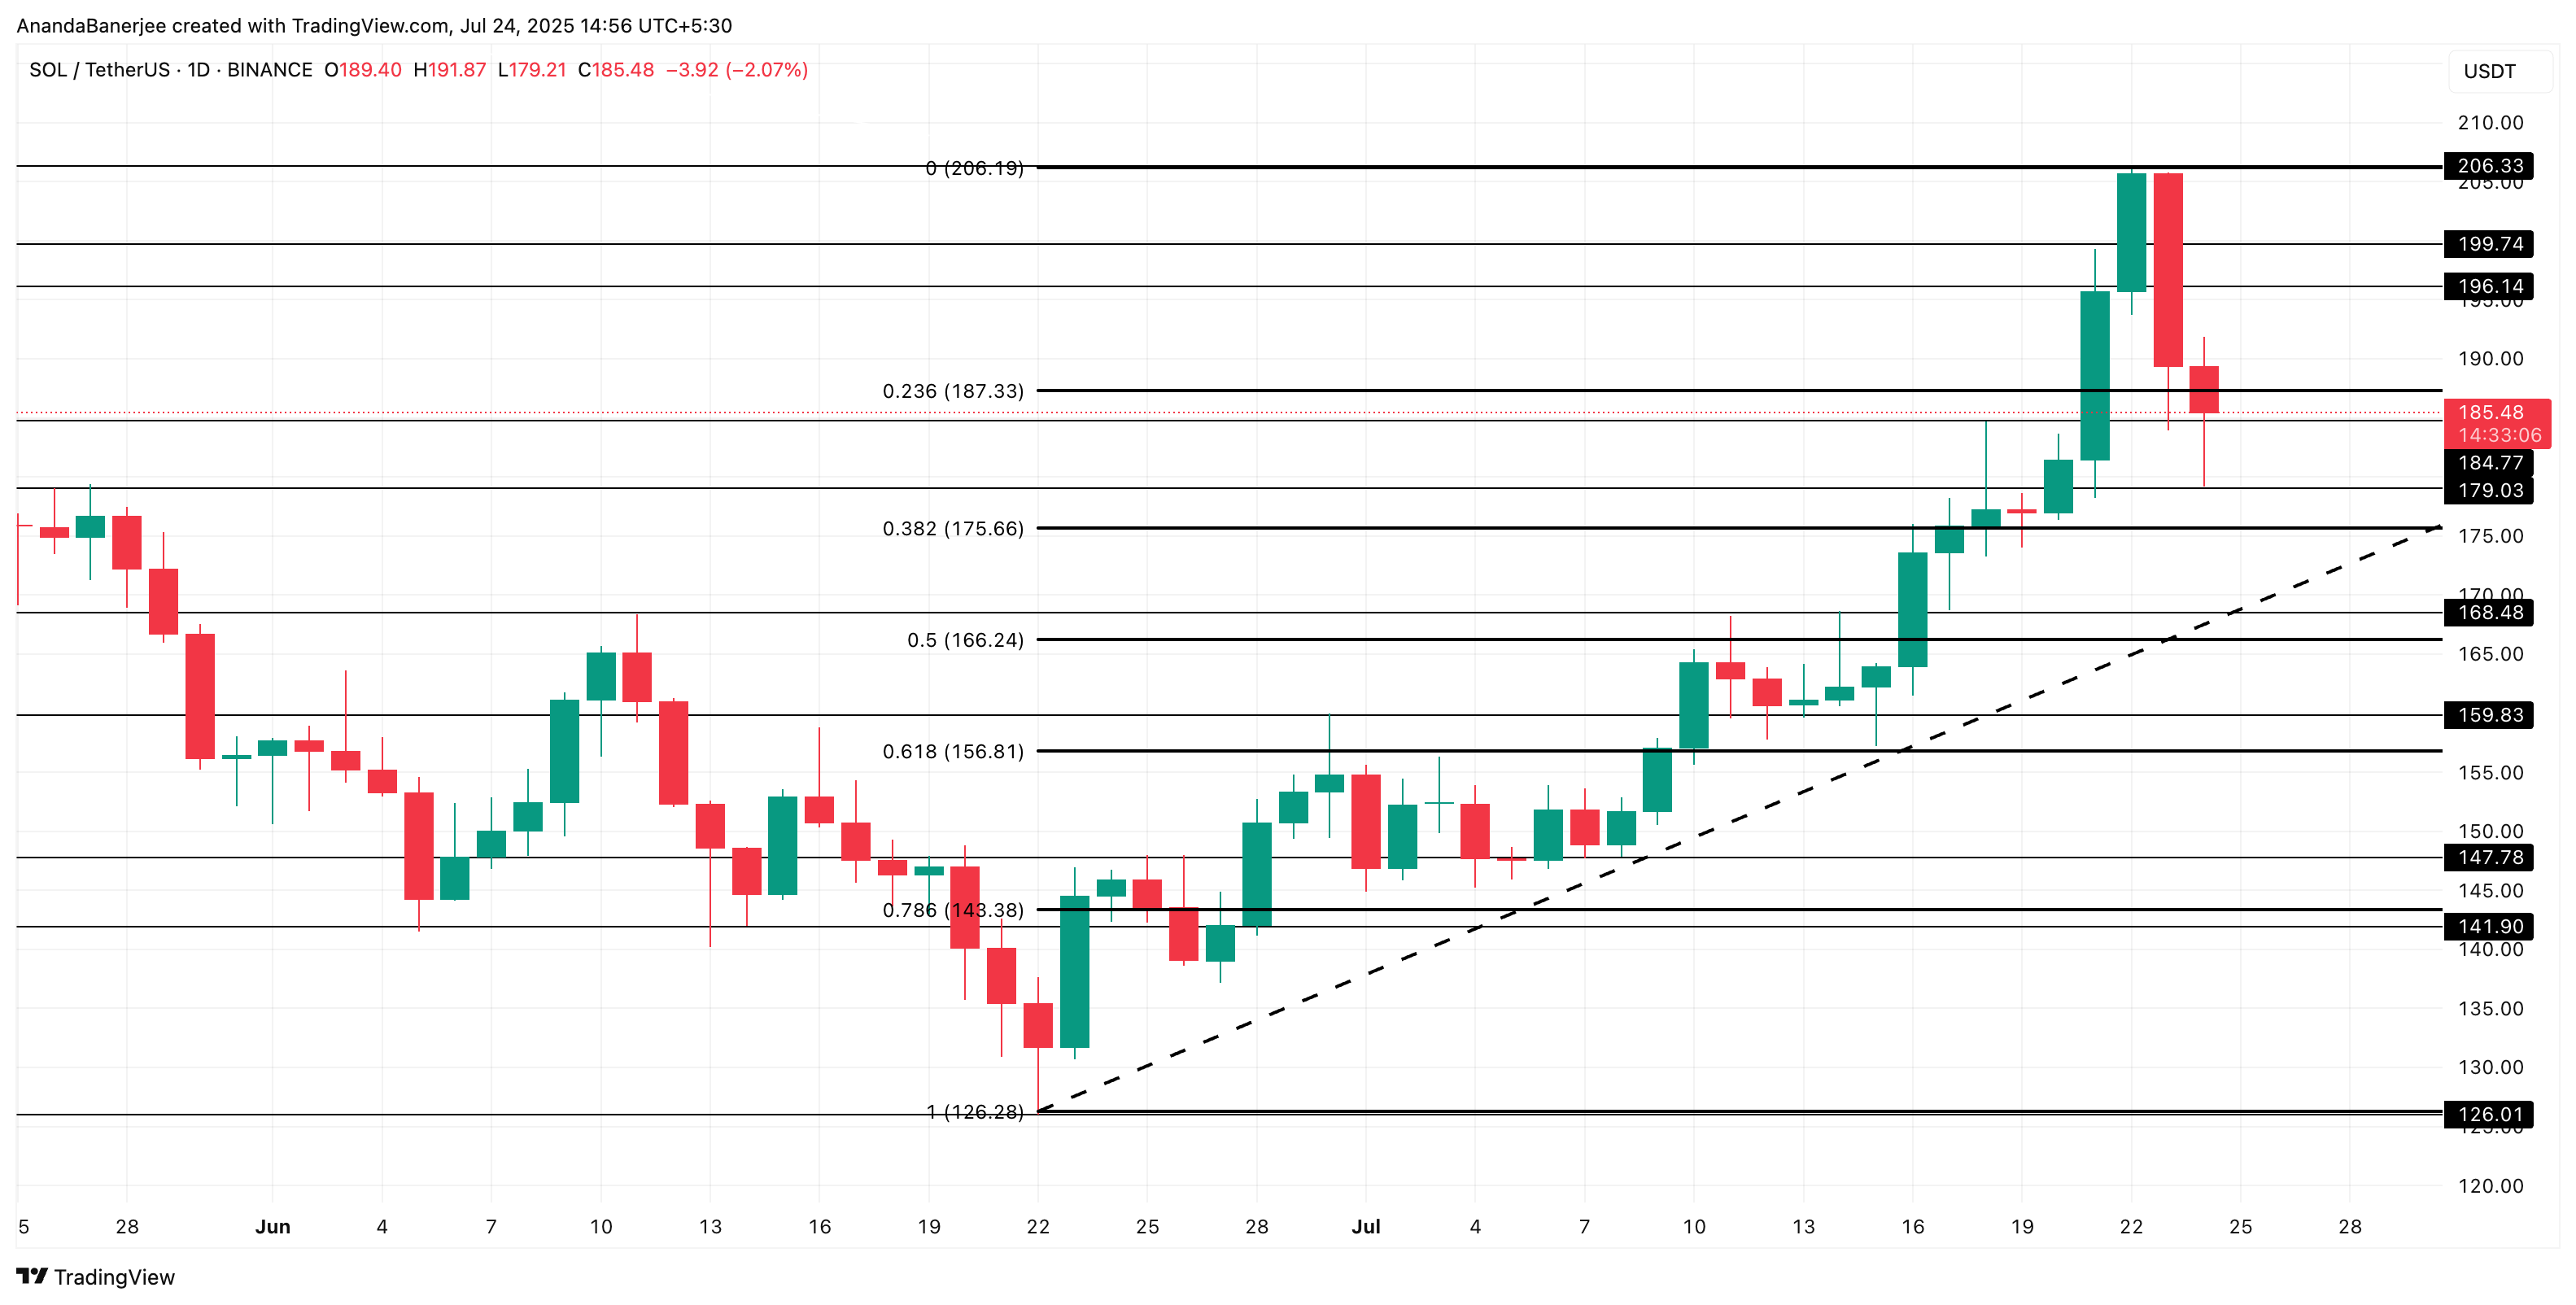
This creates a confluence zone between $175 and $180, making it the key level to watch. A bounce here could keep the bullish structure alive. But a breakdown below $175 might trigger sharper losses toward $166 and below.
